


If you’re here for a playbook that cuts waste without torching reliability, this is the right place. This insights collection is created for FinOps people by experts juggling tagging SLAs, RI/SP coverage, K8s requests/limits, showback dashboards, and a backlog of anomaly runbooks. Below you’ll find 13 cloud cost optimization best practices Cloudaware clients use every week — field-proven by my teammates and trusted industry experts who live inside multi-cloud estates.
Here’s what we’ll talk about — straight, tactical, and copy-pasteable ideas for your FinOps rituals:
- How do you model € per order/job and wire it into SLOs, so every PR shows cost impact?
- Which policy-as-code checks block untagged infra — without slowing delivery?
- What coverage/utilization targets keep RI/Savings Plans from turning into shelfware?
- How do p95-driven rightsizing + autoscaling land savings week after week?
- Which showback mechanics actually change team behavior (and stick past the first dashboard)?
- How do you make Kubernetes costs first-class — requests/limits, bin-packing, and €/namespace?
- How do you design out egress and fix storage lifecycle/TTL before they tax your bill?
Let’s dive directly into the 1rst advice 👇
Model unit costs and SLO guardrails per product/service
If there’s one thing that separates reactive cost-cutting from mature FinOps, it’s this: you measure cloud spending in terms of business output — € per order, job, GB transferred, or API call — then tie that unit cost to SLO thresholds your team already respects.
That way, every cost-saving decision has real context. You don’t just know what you’re spending — you know what each service costs to deliver at acceptable performance.
Among all cloud cost optimization best practices, this one lays the foundation for smarter rightsizing, better commitment planning, and cleaner showback.
So how do you actually implement it?
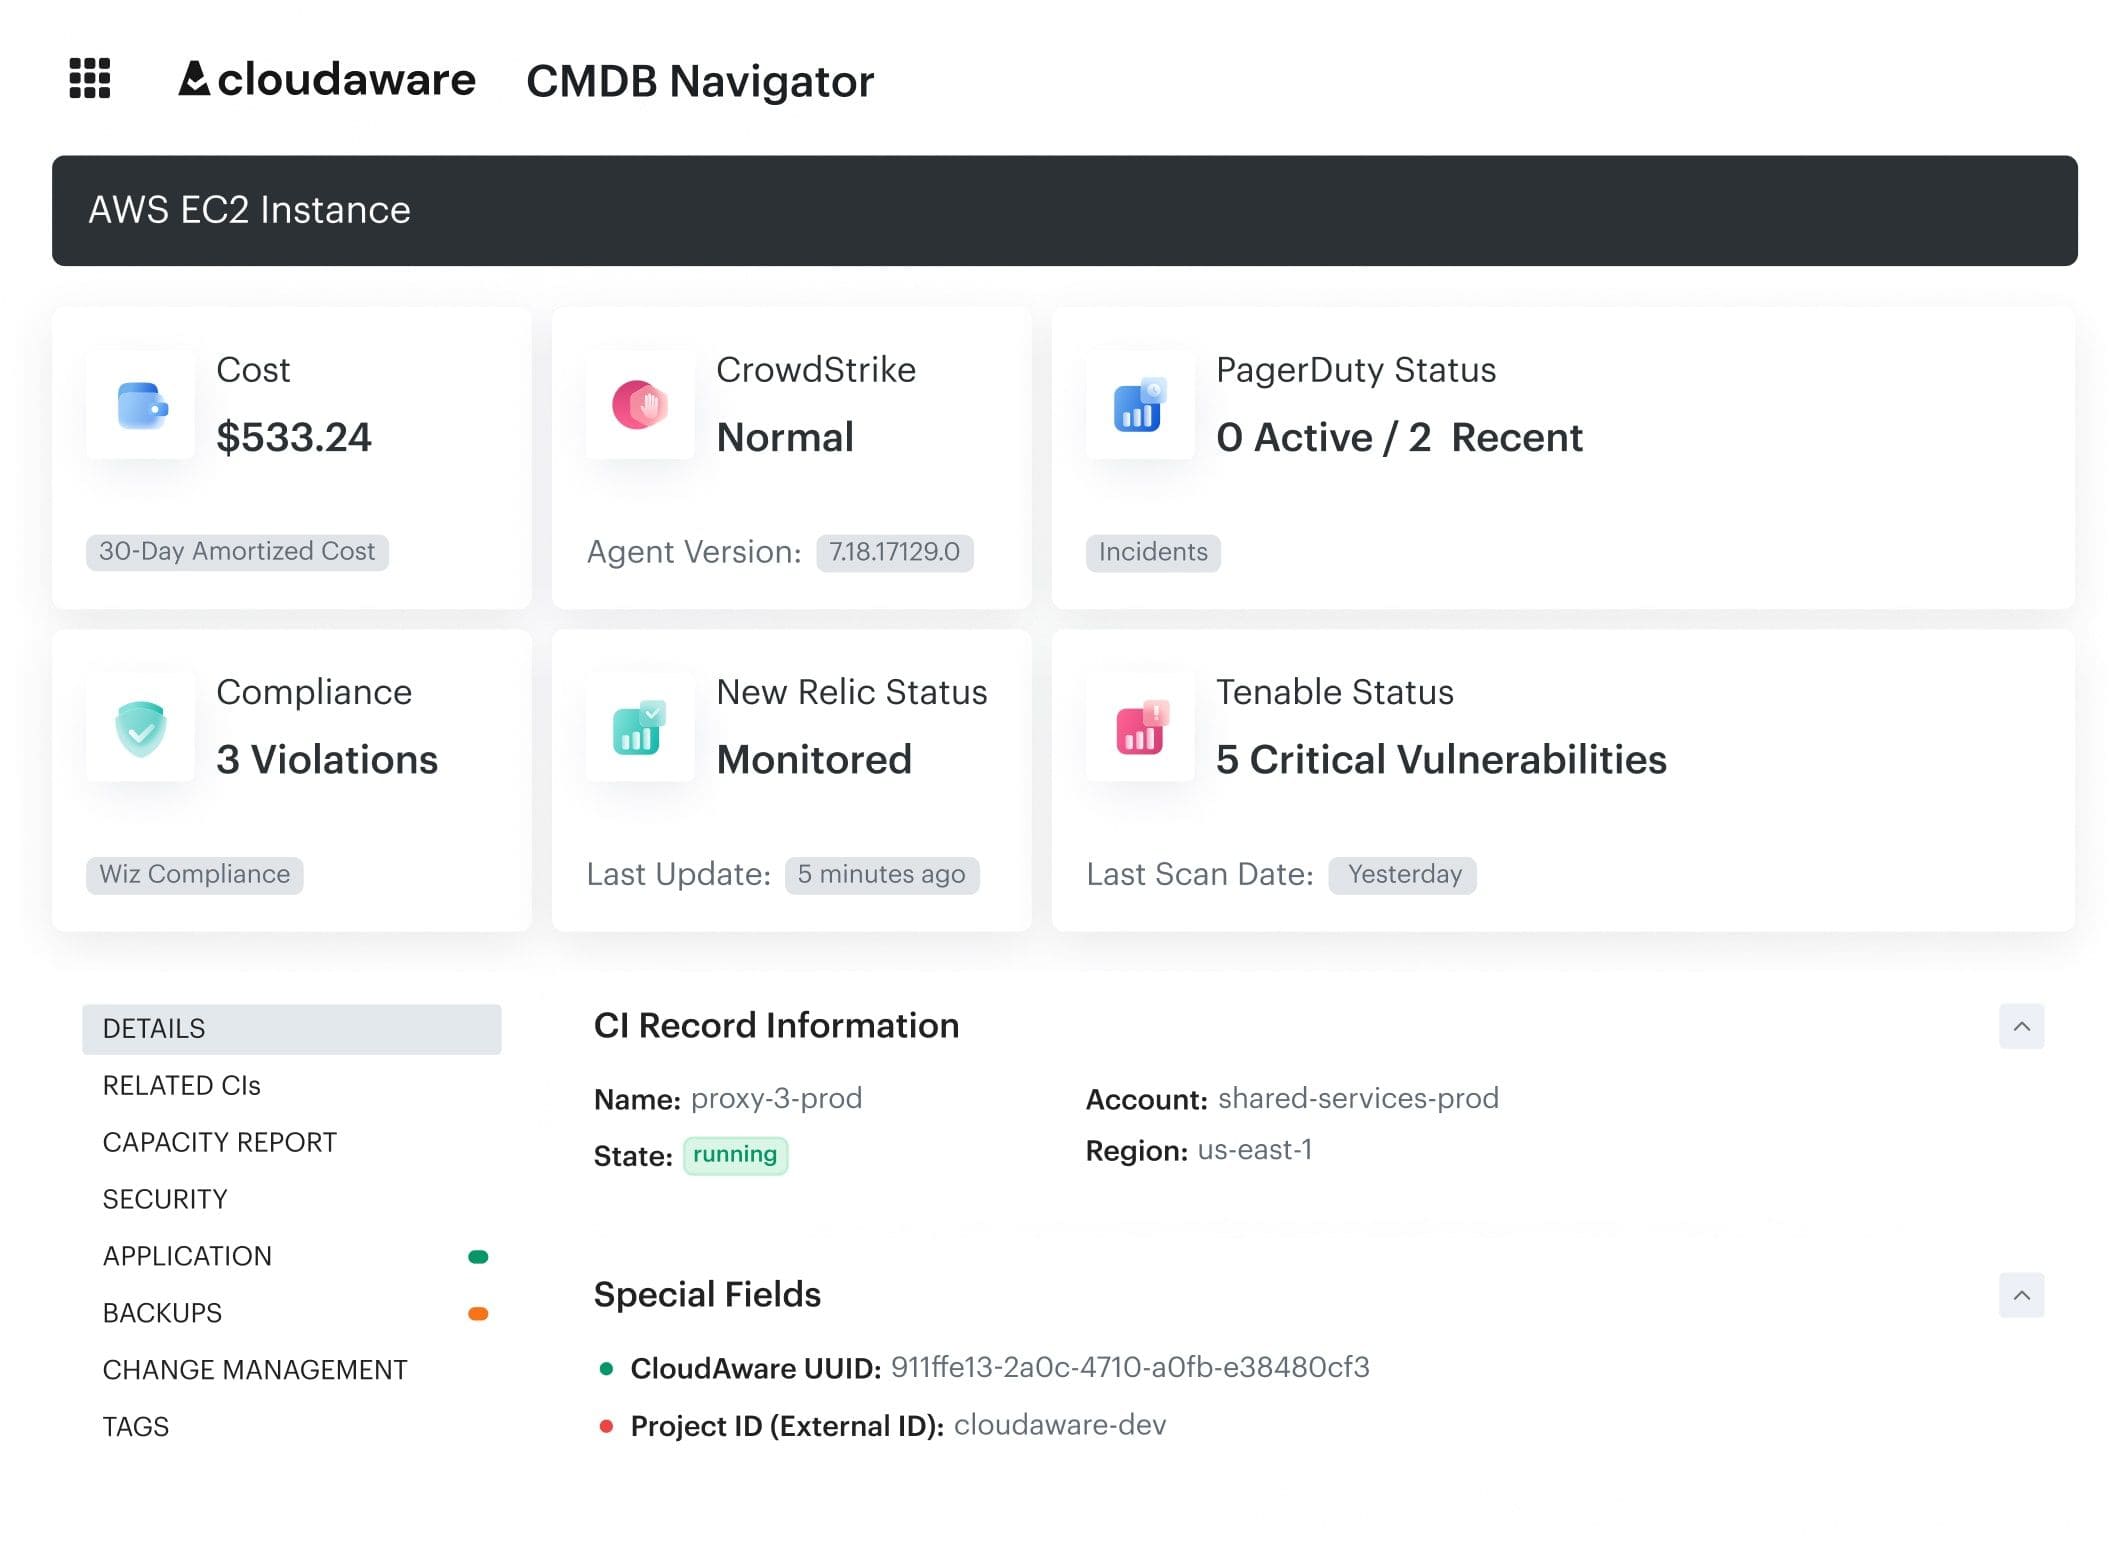
- Start by picking one customer-facing product or high-volume internal service. Use Cloudaware’s CMDB scopes to automatically group infrastructure by app, environment, and team.
FinOps dashboard in Cloudaware. Schedule demo to see it how it works for your infra. - From there, pull request count, batch size, storage volume, or job throughput from native telemetry.
- Divide your cloud cost (filtered to just the relevant infra) by the output in the same time window. That’s your unit cost.
- Now add an SLO layer: what’s the latency, error rate, or availability baseline that must not be compromised when pursuing savings?
- Get documented it in the change history. Unit cost goes down only if SLO remains healthy.
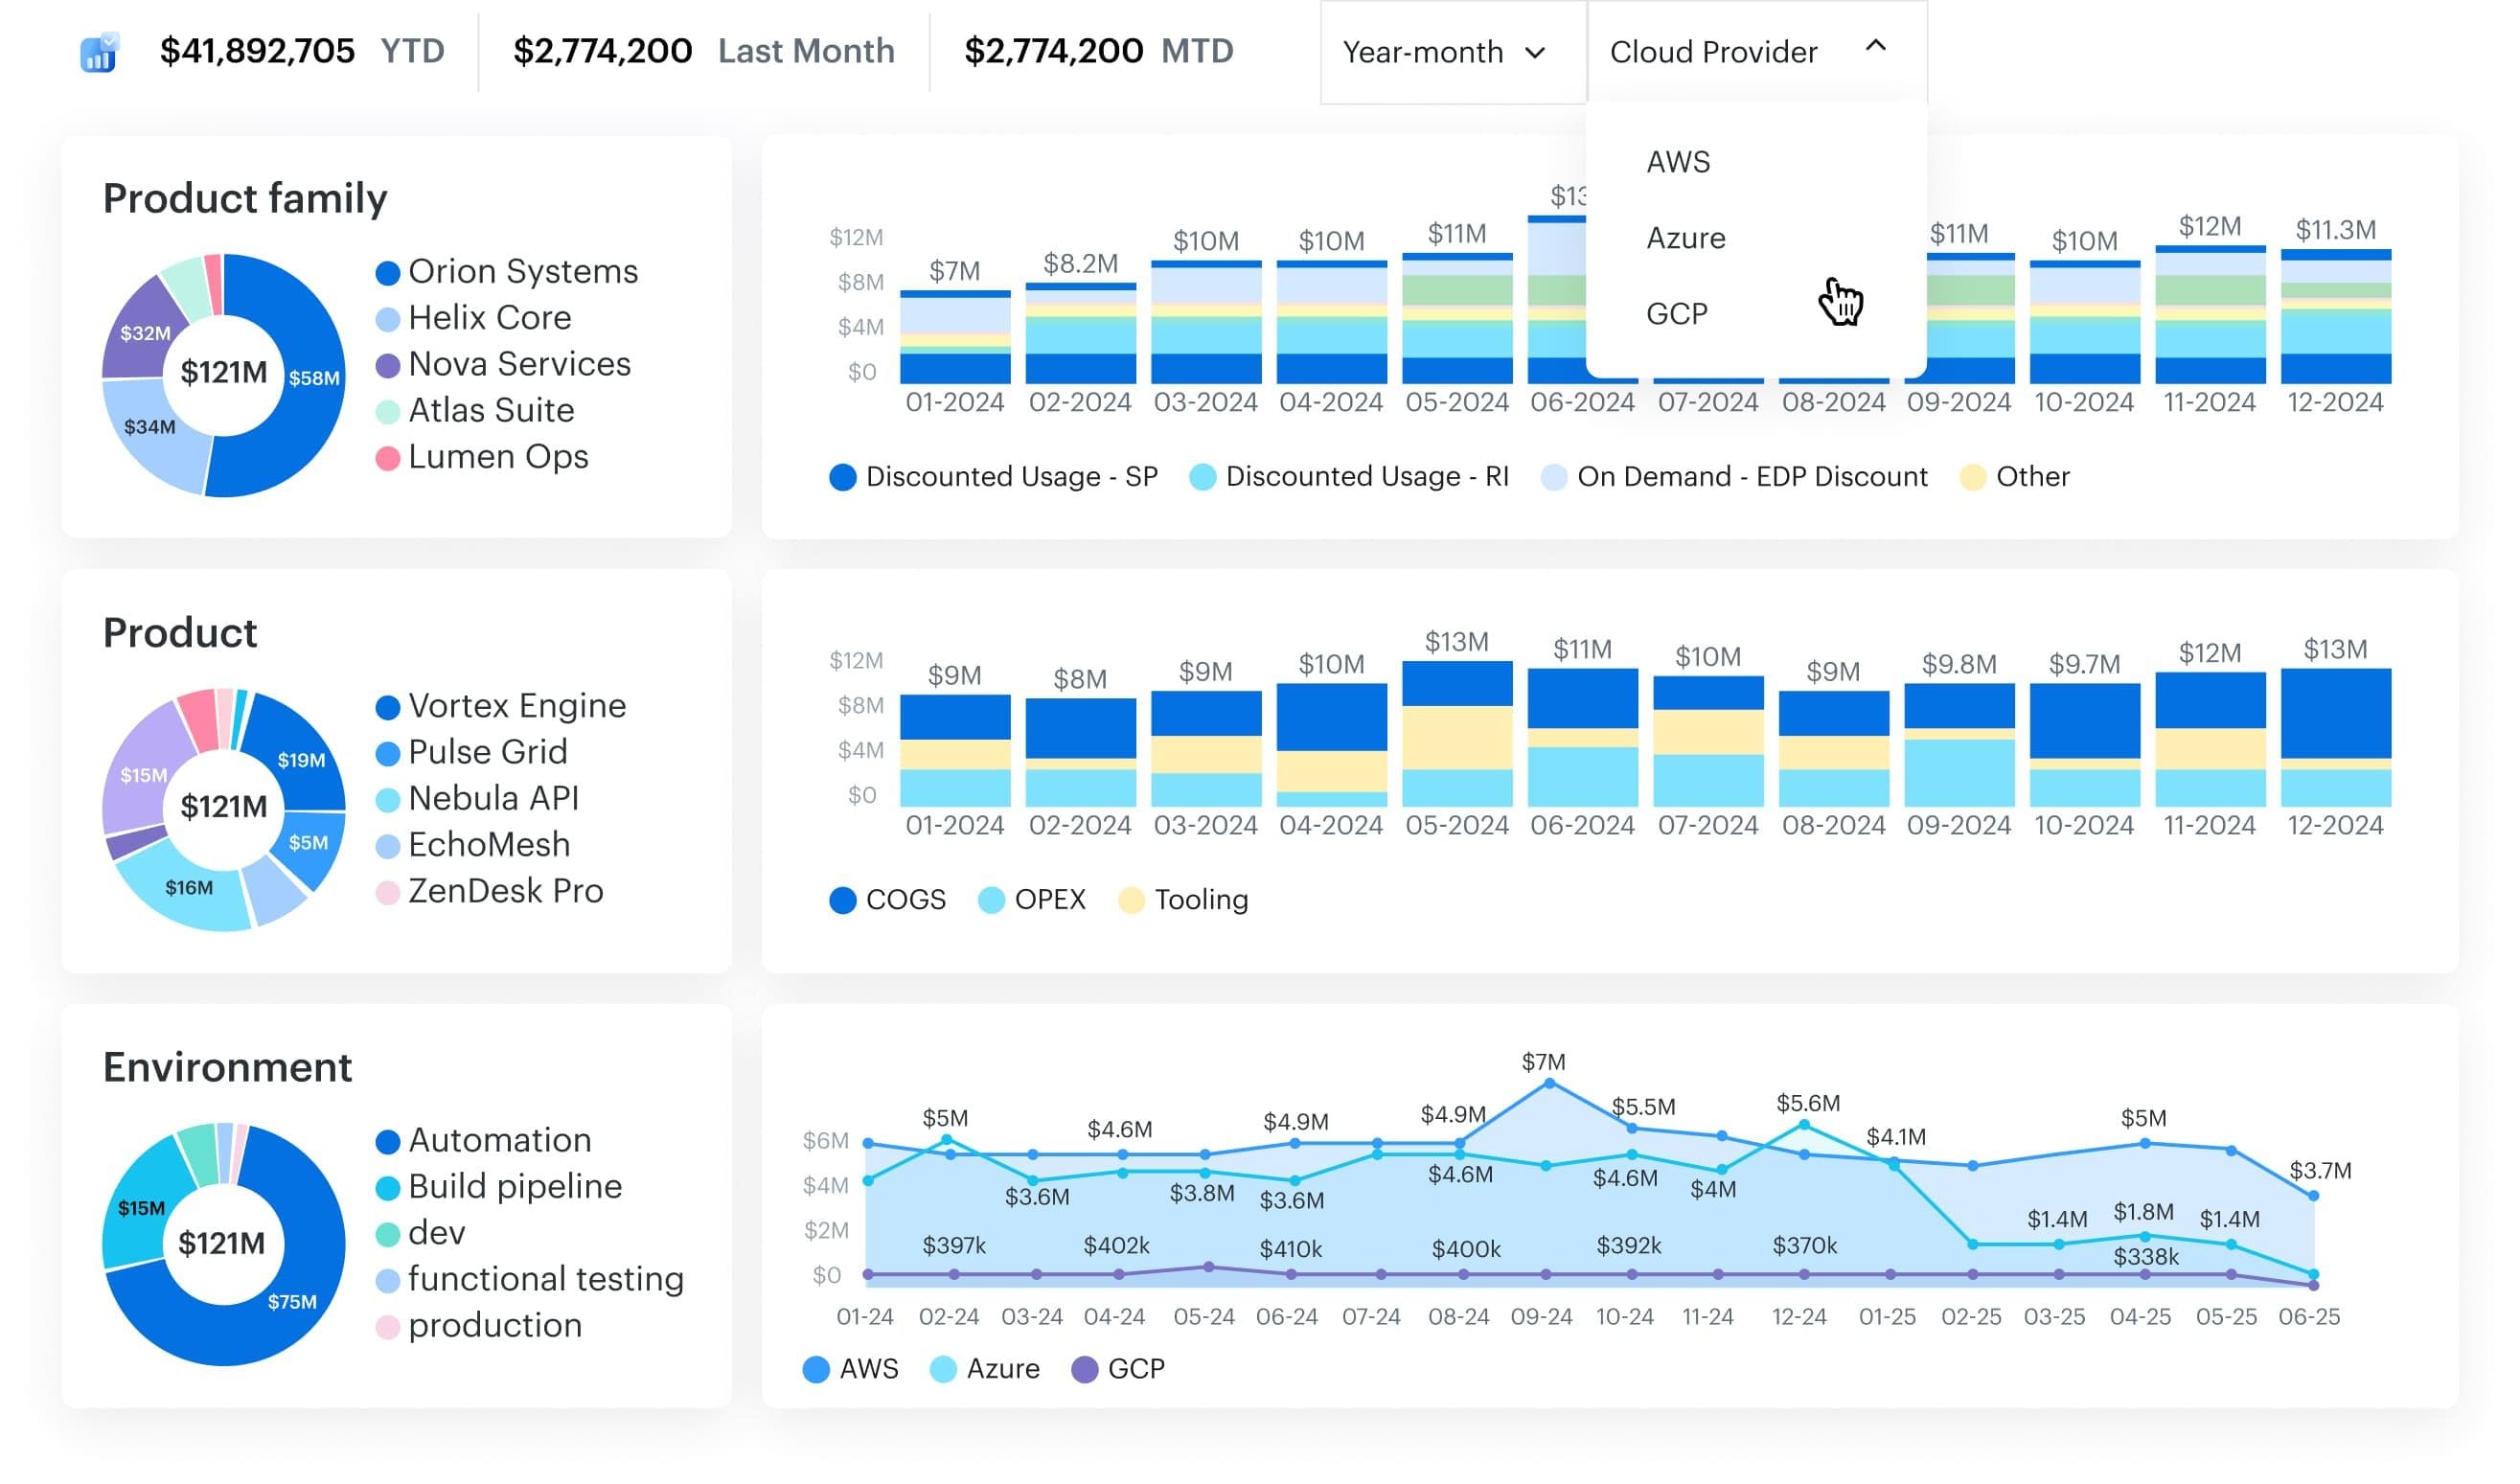
Once you’ve got the baseline, make it visible. Unit costs should show up in PR descriptions, team dashboards, and weekly FinOps reviews. For example:
Cloudaware lets you build custom cost overlays using CMDB scopes and usage telemetry — so engineers can see cost-per-job drift before the sprint ends.
Now, what should you track?
Monitor unit cost trend per product/service, current SLO burn rate, and error budgets. Also track % change in cloud cost versus % change in business output. So you know if you’re scaling efficiently or just spending more.
Anna, ITAM expert:
Don’t let teams build their own “unit cost” metrics using mismatched scopes. If one group includes staging infra or shared services in their numerator, and another excludes async jobs from the denominator, you’ll get noisy data no one trusts.
Use shared tagging schemas, CMDB relationships, and platform-backed scopes to keep cost attribution consistent.
Otherwise, you’ll spend half your time arguing definitions — and your cost management rhythm will stall.
Read also: Cloud Cost Optimization Framework - 11 Steps to reducing spend in 2026
Enforce tagging at deploy and block non-compliant resources
This one’s simple in theory, brutal in practice: if a cloud resource doesn’t have an owner, environment, cost center, and application tag — don’t let it exist. Tagging makes showback work, scopes accurate, and FinOps automation possible.
Among the most critical cloud cost optimization best practices, enforced tagging gives you full visibility into usage patterns, enables proactive anomaly detection, and ensures cost accountability across teams.
So how do you actually enforce this without slowing delivery?
At deploy time, enforce policy-as-code checks (using OPA, Sentinel, or AWS SCPs) to validate that required tags are in place — like owner, env, team, and cost_center. These rules should block the deploy by default. No soft fails, no follow-up tickets. If it’s missing metadata, it doesn’t ship.
If you’ve got something like Cloudaware running, it’ll continuously track tag completeness across all cloud resources in AWS, Azure, and GCP. The tag coverage dashboard helps you spot which accounts, projects, or services are actually compliant — and which ones are silently bypassing policy.
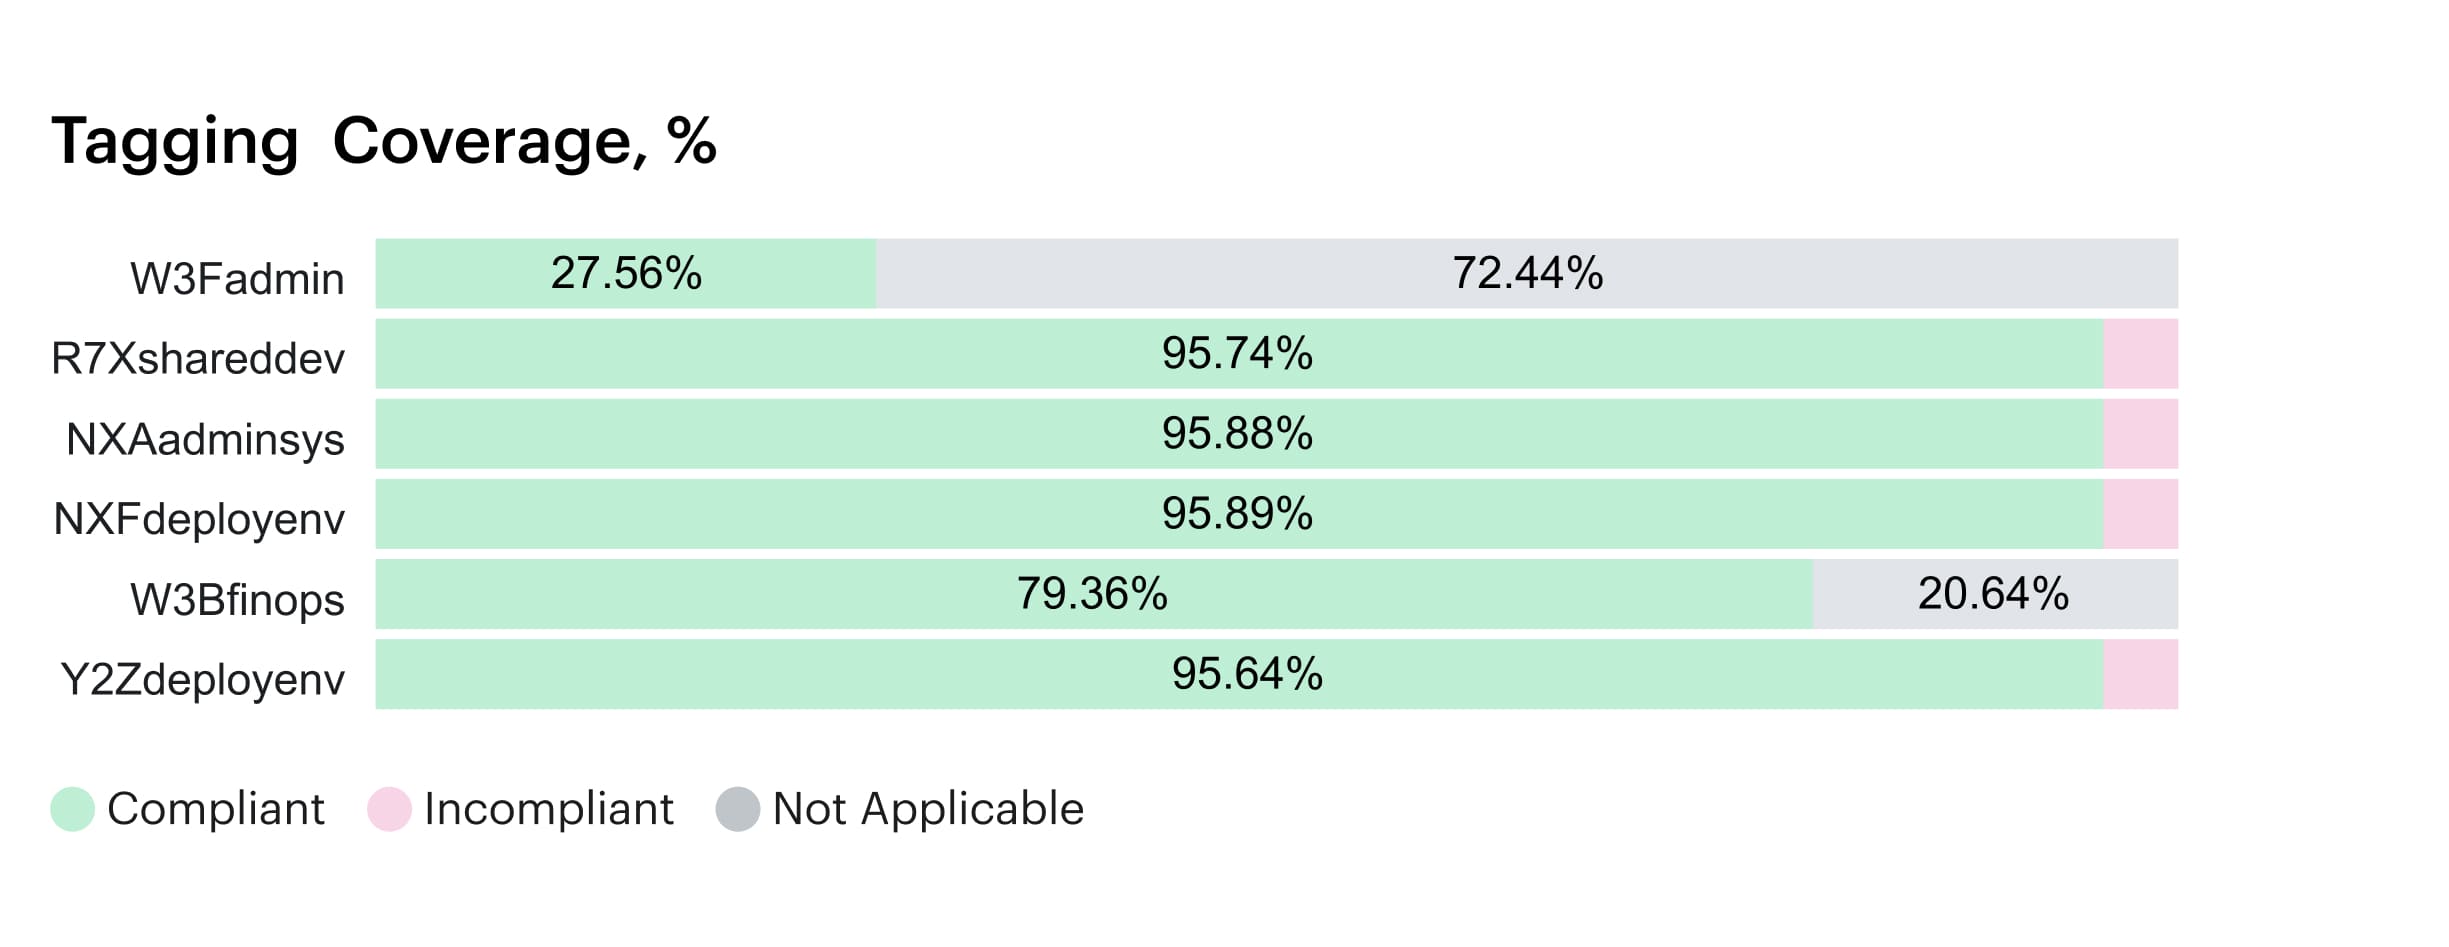
Tagging dashboard within Cloudaware. Any questions on how it works? Book a call.
You can route violations to Slack, Jira, or email automatically to close the loop in real time.
That becomes your control layer. And if you want to take it further, tag-based allocation rules can feed into automatically built CMDB scopes — so each resource gets mapped to a service, team, and environment. From there, unit cost models and chargeback logic stay clean. No more mystery EC2s floating around without ownership or context.
What should you track?
Look at tag coverage percentage across all key dimensions (owner, env, cost center, app), broken down by cloud and business unit. Watch for drift: resources launched manually, through third-party tools, or outside golden IaC modules.
Also track how many deployments get blocked due to missing tags — this helps you tune the developer experience.
One major pitfall?
Relying on retroactive tagging or periodic cleanup scripts. You’ll miss transient resources, and your management layer won’t trust the data. Worse, teams may game the system by copy-pasting placeholder values that pass validation but break downstream analytics.
Always enforce at deploy, always verify in runtime, and always alert when something slips through.
If you want reliable showback, automated cost policies, and smarter alerting, it starts here: with every cloud resource born fully tagged — or not born at all.
Read also: 10 Cloud Cost Optimization Strategies From FinOps Experts
Run a weekly FinOps loop (alerts → triage → action → verify)
A tight, recurring loop turns noisy alerts into resolved savings with owners, SLAs, and receipts. You’ll spot spend anomalies fast, decide the fix, execute safely, and confirm impact — without eroding reliability.
It becomes the heartbeat of your cost management rhythm and keeps initiatives moving after week one.
How to implement it?
Set a fixed 30-minute cadence. Every Friday or Monday, pull reports from Cloudaware’s anomaly detection and tag-based allocation views. Review:
- Any cost spikes flagged across regions/services
- Tag or ownership gaps blocking allocation
- Commitments underutilized (RI/SP coverage < target)
- Showback reports per team or namespace
- Last week’s actions: did they land the expected savings?
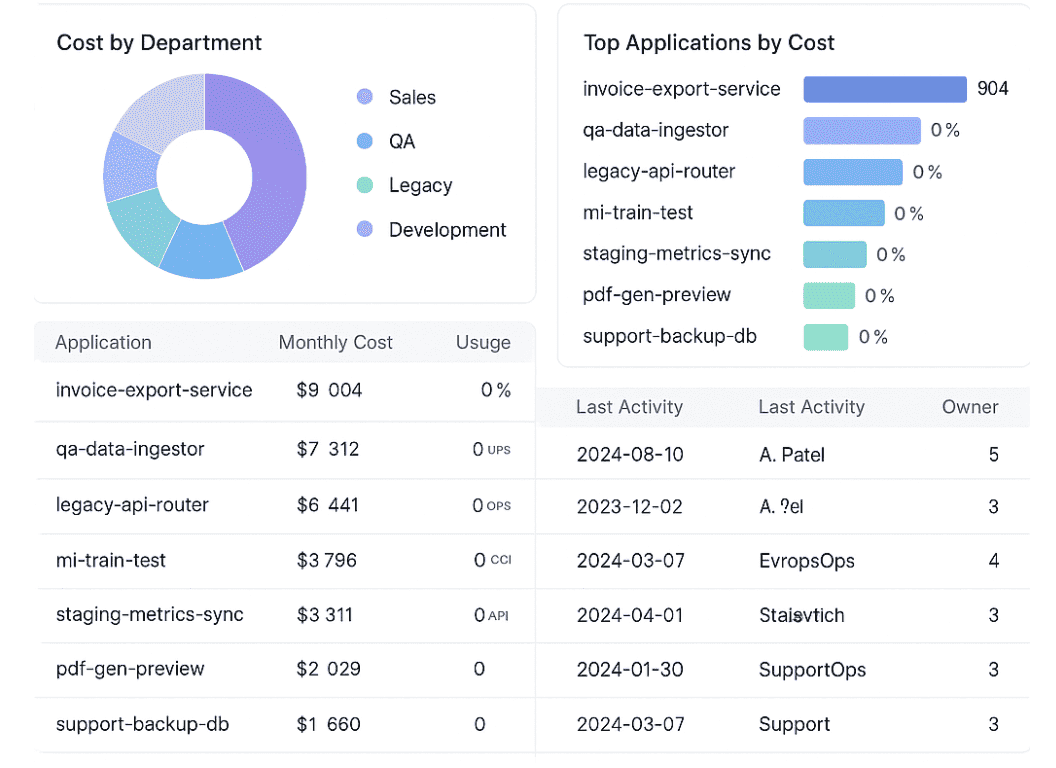
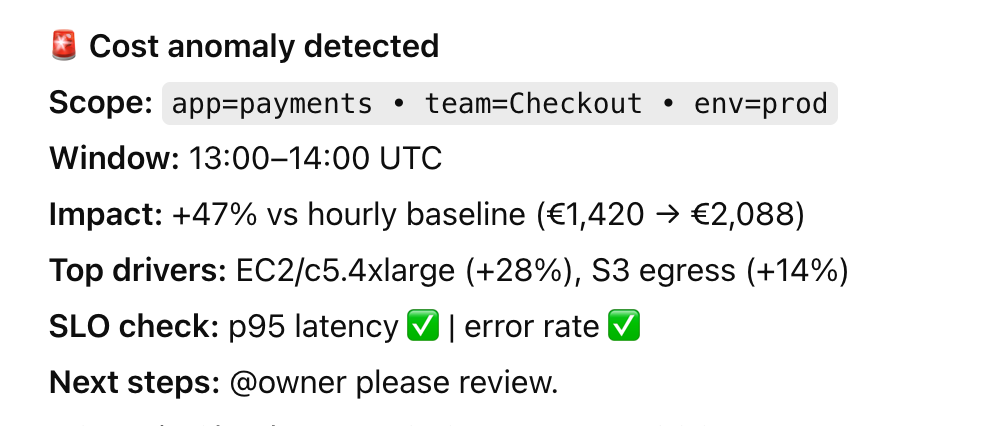
Here is how the dashboard looks like:
Anomaly detection report element. See it live
Assign clear owners for each issue. In Cloudaware, you can link allocation gaps or anomalies to CMDB-scoped resources and responsible teams. Add a savings forecast and follow up next week to verify it landed.
Bonus: log outcomes in a shared Confluence page or Slack thread — this creates tribal memory and reduces repeated mistakes.
What metrics to track
If you want to reduce cloud spend in a way that actually sticks, you need rhythm. This practice replaces one-time cleanup efforts with a structured, weekly habit: review anomalies, triage the top offenders, assign actions, verify savings, and log learnings.
Possible pitfall to consider
Two killers: verification debt and alert fatigue. If actions aren’t closed with before/after snapshots, trust decays and fixes drift.
If every project defines its own thresholds, you drown in noise. Standardize anomaly classes, thresholds, and suppression windows; store decisions beside CMDB scopes; and require a verification note before any ticket moves to “done.”
Optimization tactics differ per cloud, and many teams pair these best practices with provider-specific playbooks like Azure cloud cost optimization for VM sizing and storage savings.
Read also: 6 FinOps Domains - The Essential Map For Cloud Spend Control
Rightsize continuously with workload-aware signals
This is the heartbeat of cloud cost optimization best practices: you tune capacity to real demand using p95/p99 CPU, memory, I/O, and throughput so services stay fast while waste disappears.
Done well, it creates durable cost savings without roulette-style changes that wreck reliability.
How to implement it?
Start by defining a scope for each service — usually app + environment + team.
From there, layer in workload telemetry: requests per second, queue depth, batch size, and storage IOPS. This helps you understand how compute is really being used, not just what’s provisioned.
Set performance guardrails to shape your resizing logic — like p95 CPU between 35–60%, memory between 40–70%, and disk queue depth no higher than 1.
For compute, build a simple decision tree:
- If p95 CPU sits below 35% for a full week → downsize one instance class.
- If p95 spikes past 80% during predictable bursts → explore horizontal scale or a scheduled scale-out window.
If you’re using something like Cloudaware, you can annotate these actions directly on the CMDB scope, then push the new configuration through your infrastructure-as-code pipelines and verify the impact over the next 48–72 hours.
Example of the rightsizing dashboard in Cloudaware:
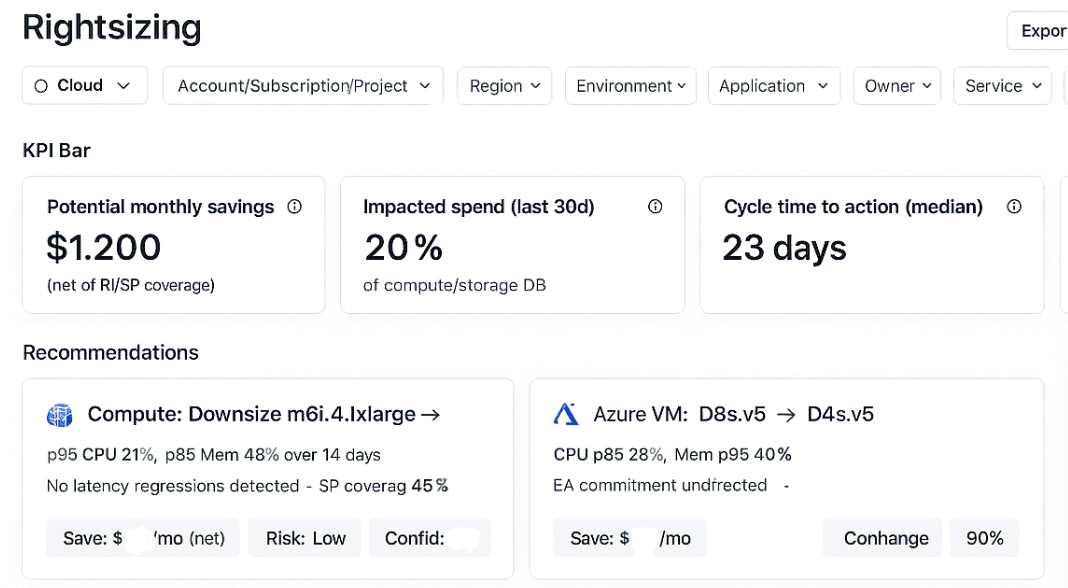
Schedule a demo to see it live.
Tie it to “down hour” policies for non-prod environments, suspend sandboxes after TTL, and clean up stateful nodes once snapshot policies are confirmed.
What metrics to track
Unit cost per request/job, p95 resource utilization, error budget burn, re-size success rate, and before/after spend per scope. Track drift across infrastructure regions and families.
Possible pitfall to consider
Averages hide burst. If you size by mean utilization, you’ll oscillate or throttle. Another trap is resizing without rollback criteria — always capture baseline, set SLO guardrails, and stage changes behind a feature flag.
Keep one source of truth for thresholds to prevent “policy fork,” and document every optimization action with who/when/why so verification isn’t guesswork.
Read also: 12 Cloud Cost Management Tools: Software Features & Price
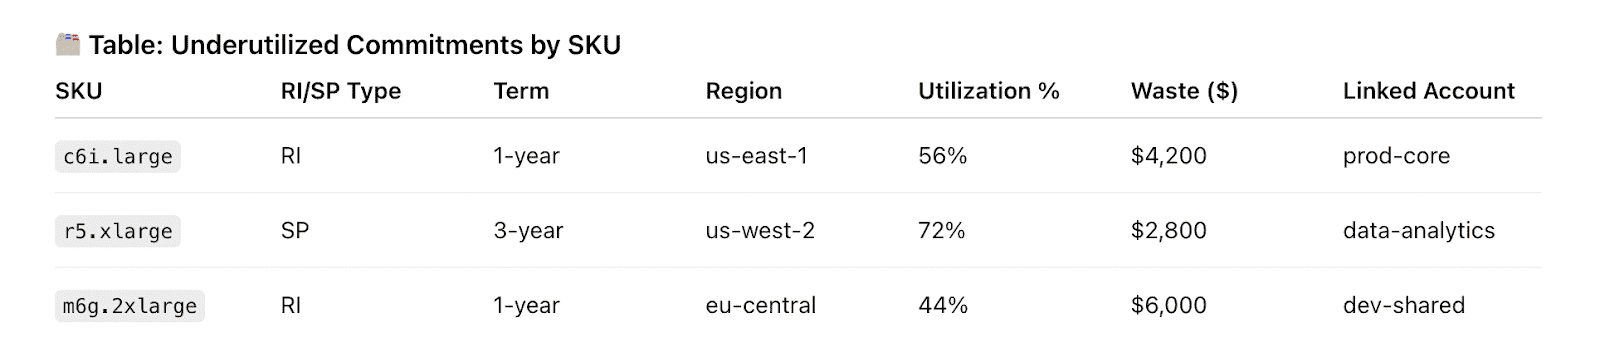
Run a commitments portfolio with coverage & utilization targets
This practice turns your cloud discount strategy into a managed investment portfolio. Instead of guessing, you define clear coverage and utilization targets for reserved instances, savings plans, and committed use contracts — broken down by clouds, service family, region, and term.
The result? Predictable discounts, less risk, and a portfolio that flexes with your real usage patterns. It’s one of those “set it up right once, then fine-tune monthly” moves that quietly saves a ton of cloud spend in the background.
How to implement it?
Then establish baseline targets for coverage and utilization. A good starting point might be:
- 70–85% coverage for steady-state compute (EC2, Fargate, AKS)
- 90–95% utilization for active reservations
- A mix of 1-year and 3-year terms based on workload predictability
- Cross-cloud visibility across your infrastructure.
If you’re using something like Cloudaware, you’ll see that data come together automatically. The platform pulls in your active commitments and overlays them against usage data. Thus, you see where you’re paying on-demand unnecessarily, underutilizing existing reservations, or approaching contract expiry.
An element of the Cloudaware FinOps dashboard. Schedule demo to see it live.
It also lets you flag workloads for renewal, resale, or conversion, so you can prep clean handoffs during your next FinOps cadence.
Historical usage graphs can be attached to justify every decision — whether it’s a buy, a skip, or a roll-forward — and help shift those commitment reviews from last-minute guesswork to planned conversations.
What metrics to track
Track commitment coverage (% of eligible usage covered), utilization (% of committed hours used), break-even analysis, effective hourly rate vs on-demand, and expiry pipeline by quarter.
This helps teams tie discount performance to actual delivery workloads.
Possible pitfall from client experience
Mikhail Malamud, Cloudaware GM:
A common trap is locking in commitments based on last quarter’s spike — like a batch processing run that won’t repeat. When that usage drops, so does utilization, and suddenly you’re sitting on unused hours that finance now flags as waste.
The better move is to tag workloads by intent — prod, batch, ephemeral — before buying. Review your coverage monthly and set thresholds for when to buy, skip, or convert. Include expiration alerts and plan out how to reassign unused reservations across linked accounts or projects, if your cloud provider allows it.
Commitments work best when they’re tied to steady-state patterns, not seasonal noise. Set your targets, monitor real usage, and adjust incrementally. It’s easier to scale coverage up than explain a 50% utilization dip after finance pulls the report.
Autoscale to demand and expire sandboxes by TTL
This practice makes your infra elastic and disposable. You scale production services based on real-time usage patterns — and enforce expiration policies for non-prod environments, test clusters, and sandboxes.
It’s one of those FinOps best practices for cloud cost optimization that directly targets idle cloud resources, zombie jobs, and forgotten dev stacks that quietly rack up spending. When done right, you reduce waste without touching performance.
How to implement it?
Use tagging to group dev, QA, and test environments, and apply TTLs accordingly — 24h, 3d, or 1w depending on context. With a system like Cloudaware in place, those tags can be automatically picked up and scoped into logical environments, making it easier to spot idle resources before they drift.
Set alerts or automation rules to suspend or deprovision anything past its TTL. Track instances and services with low activity — say, no CPU or request traffic for X hours — and flag them for shutdown or FinOps approval.
These patterns are especially useful for cleanup of sandboxes, demos, and internal tools that spin up quickly but often don’t get torn down.
For production workloads, tune autoscaling policies to workload signals: CPU, memory, queue depth, or SLO latency.
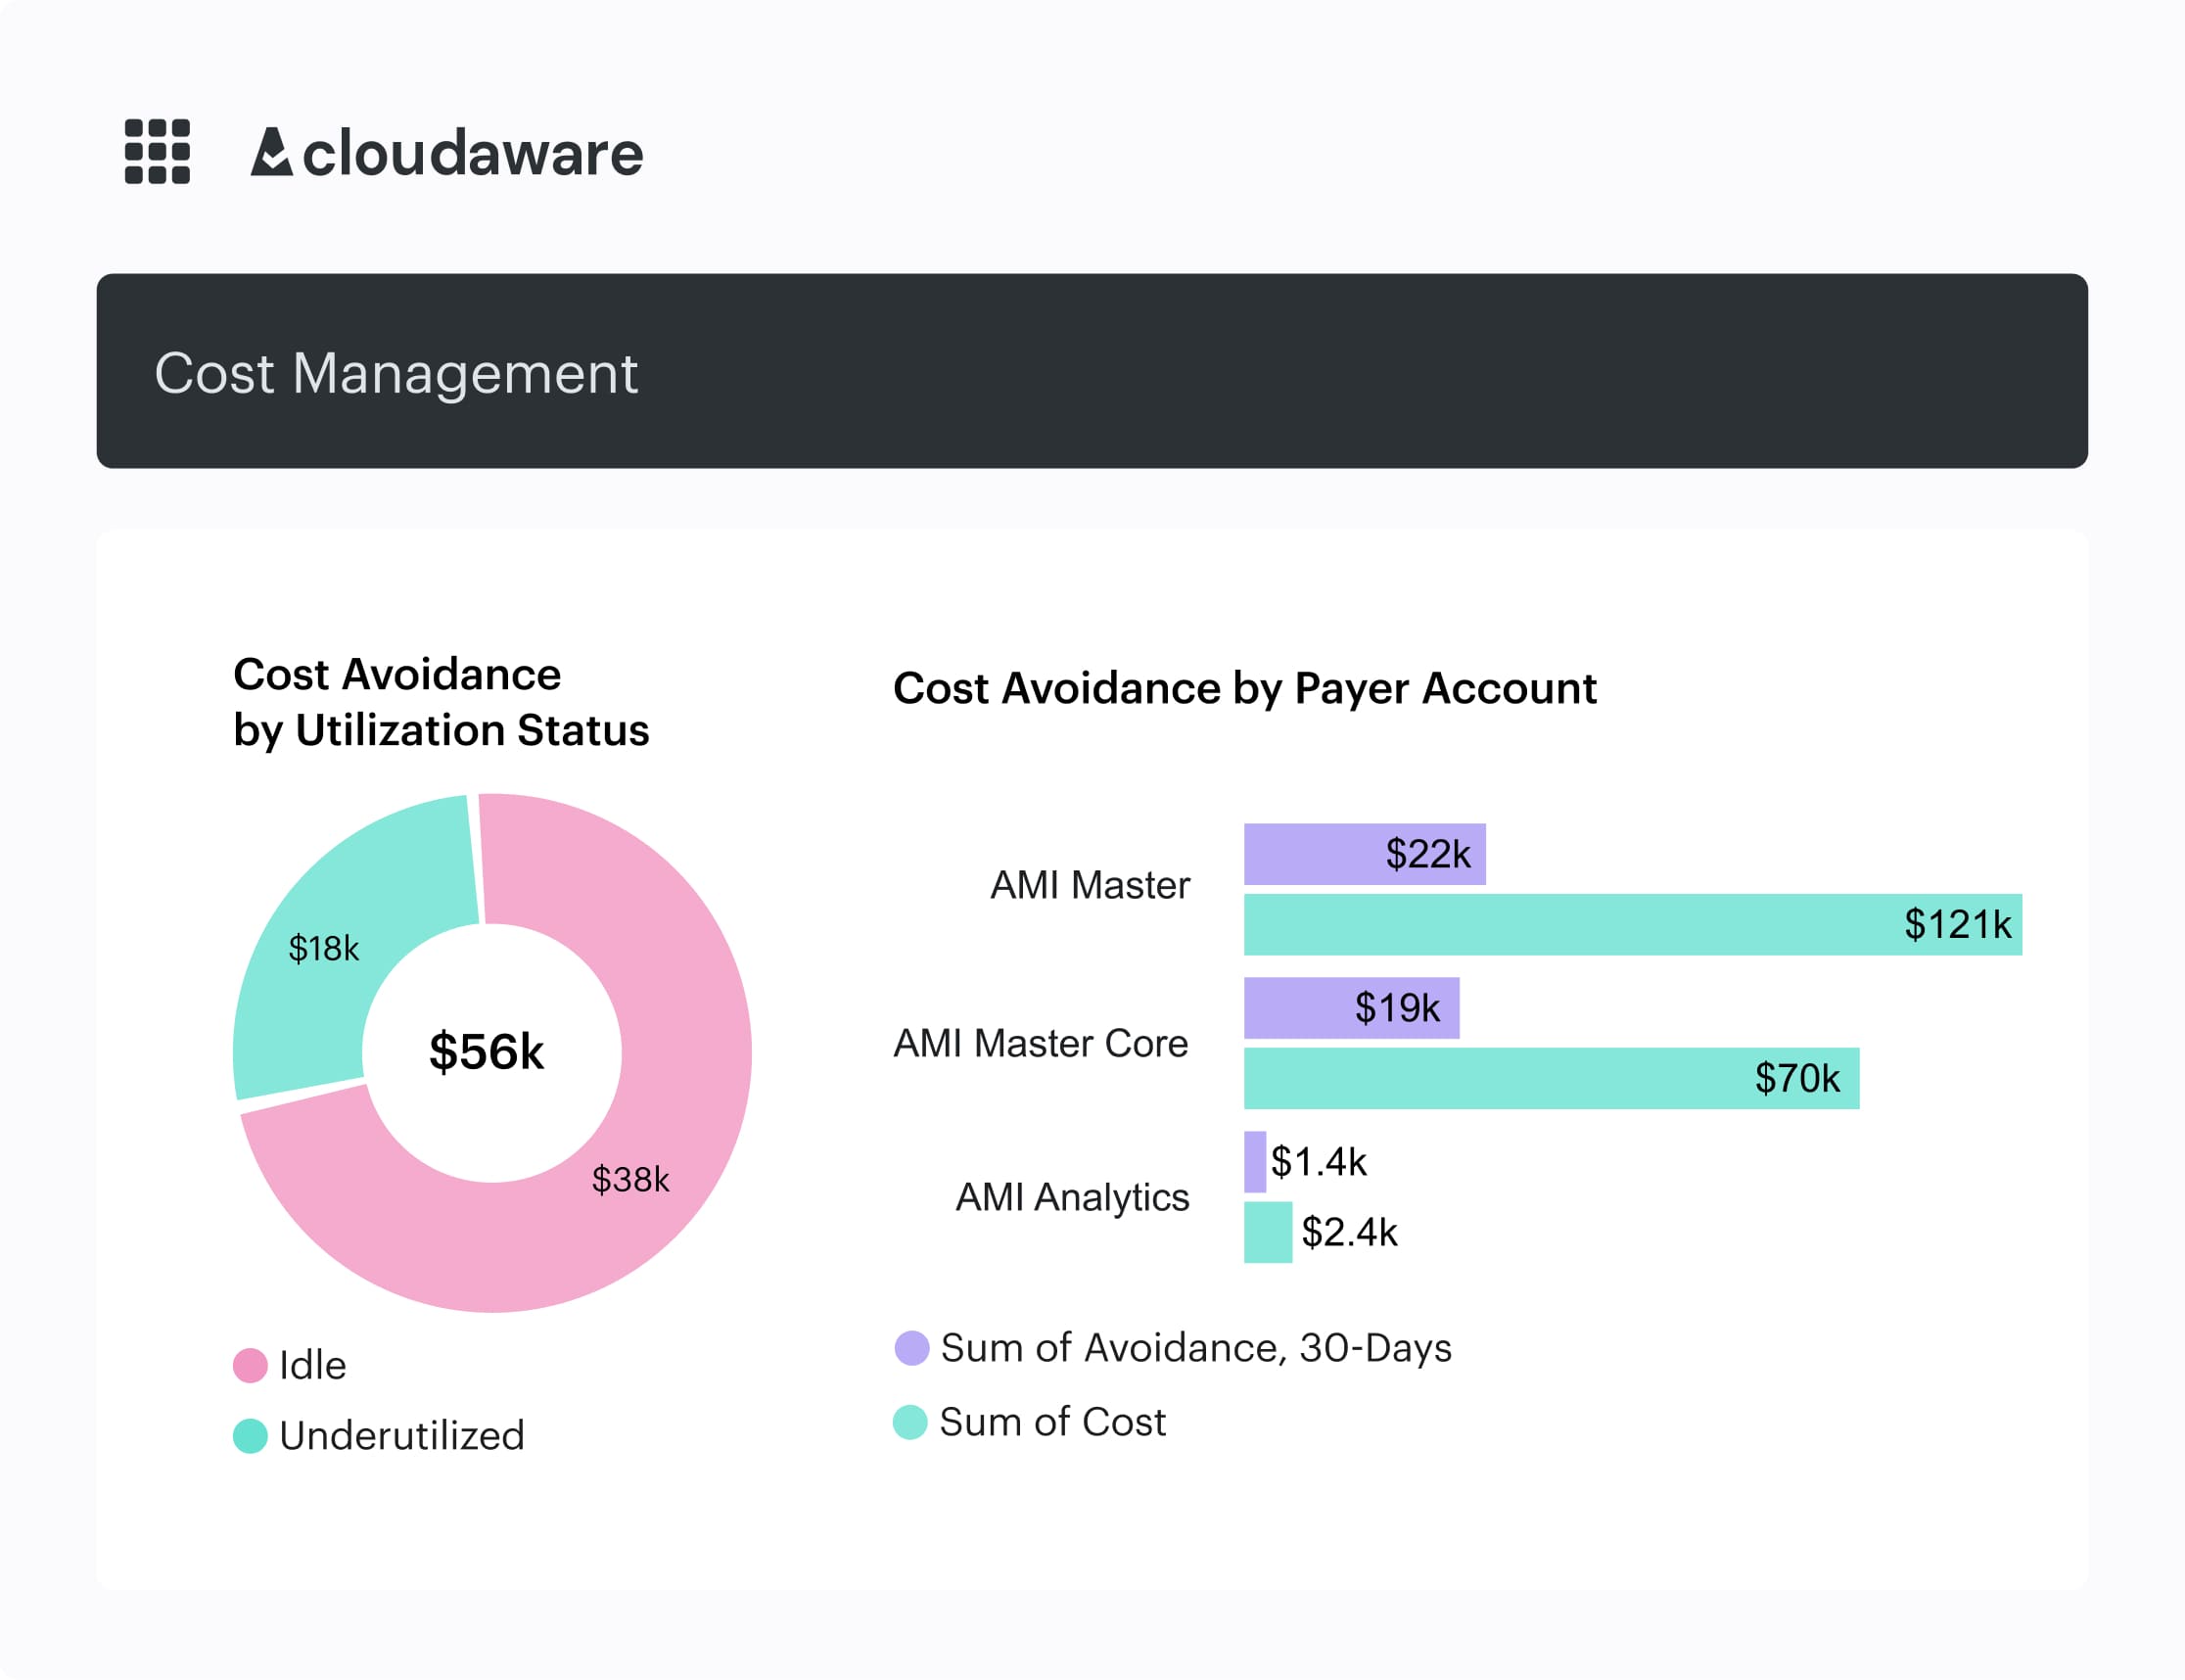
Platforms like Cloudaware surface underutilized nodes, oversized auto-scaling groups, and low-efficiency clusters across cloud accounts.
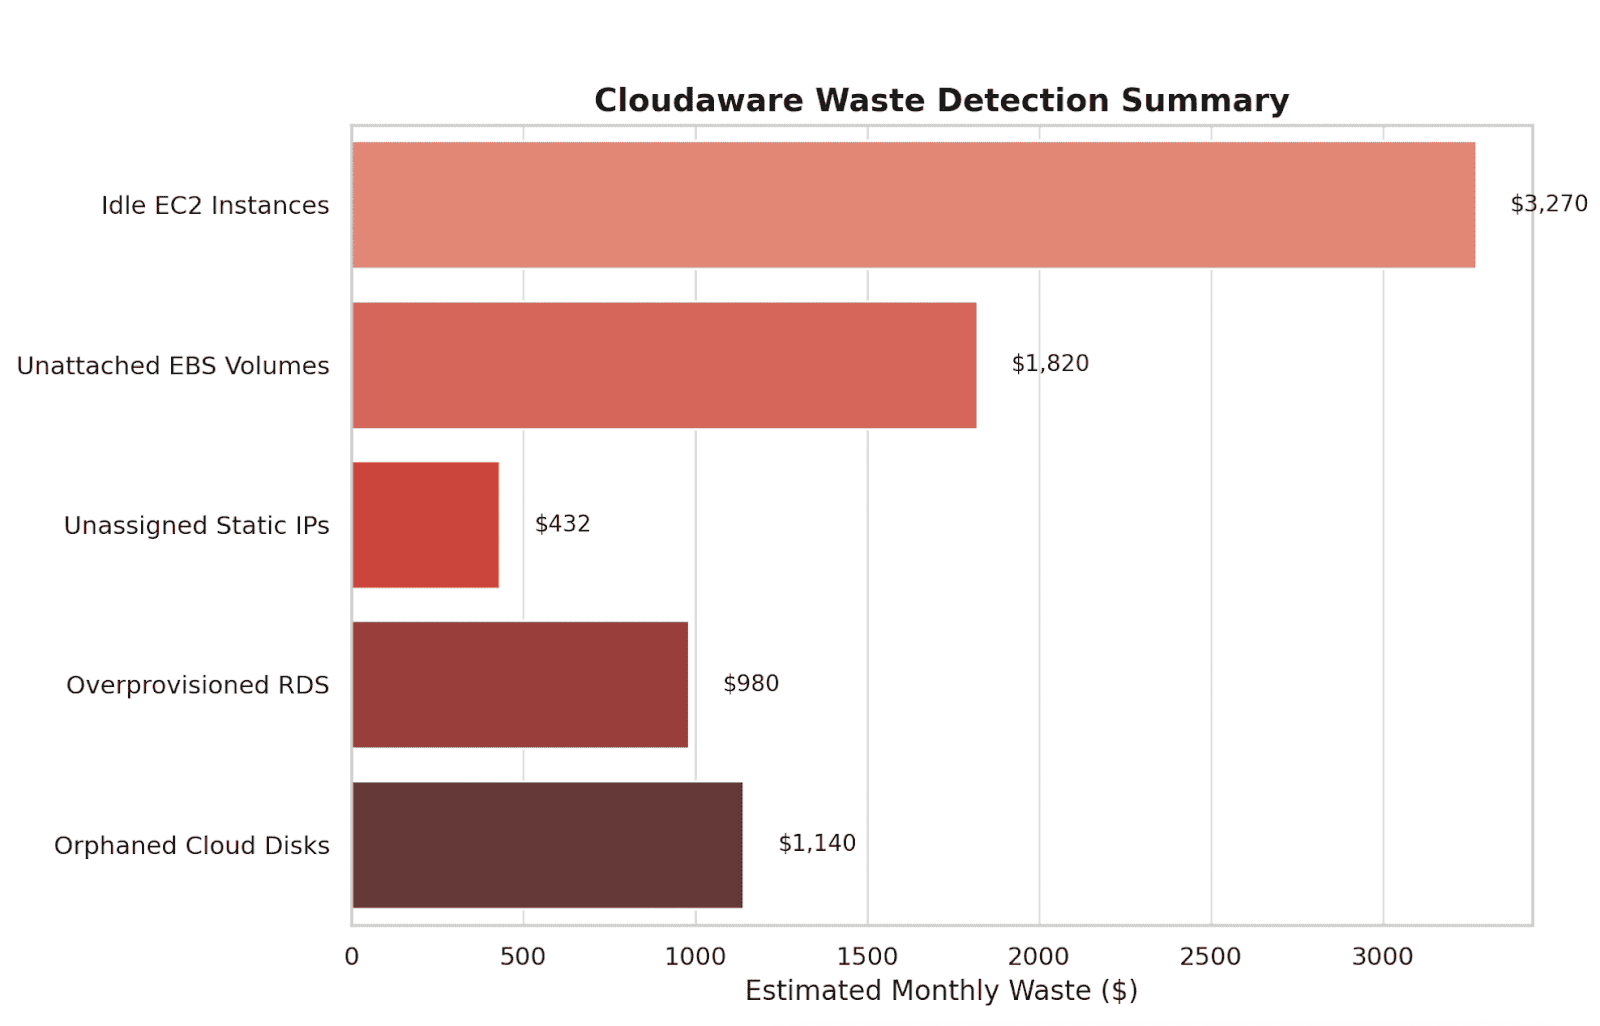
Element of the Cloudaware FinOps report. See it live
So you can schedule action during FinOps syncs or sprint planning.
Off-hours scale-down for analytics, model training, or dashboards can also be enforced by scope, so nothing runs at 3 a.m. unless it’s meant to.
What metrics to track
Monitor idle time per instance group, % of non-prod usage expired on schedule, cost per dev/QA scope, and autoscaling event history. Also track total compute hours saved through TTL enforcement and time-window scaling.
Possible pitfall
Kristina S., Senior Technical Account Manager at Cloudaware:
One team built autoscaling rules that worked great on paper — but forgot to configure TTL for their staging clusters. Over six months, they spun up more than 1,100 non-prod instances, most idle outside business hours.
Since those clusters weren’t tagged correctly, their control mechanisms missed them.
The fix: build TTL into the golden IaC modules, enforce expiration tags in CI/CD, and tie those tags to auto-cleanup policies in Cloudaware. Teams need to see TTL as part of the deploy contract, not something added later.
Bonus: make expired infra visible in Slack or Jira, so engineers get feedback and stay engaged.
Read also: 12 Multi Cloud Management Tools: Software Features & Pricing Review
Tier storage by access & lifecycle
This best practice targets the slow, silent creep of storage waste. When you tier files, objects, and volumes based on access patterns you free up budget, shrink backup bloat, and dodge retrieval tax surprises. It’s one of those moves that doesn’t just support better cost management, it compounds over time.
Think less cold data in hot tiers, fewer zombie EBS volumes, and no more ten-month-old snapshots of something you don’t even run anymore.
How to implement it?
Start by defining lifecycle windows by workload type.
Active product data? 0–30 days hot.
Analytics logs? Drop them to infrequent access after 7 days.
Backups? Rotate daily/weekly/monthly, and delete anything older than 90 days unless flagged.
Cloudaware supports this by pulling storage asset metadata — volume IDs, object paths, snapshots, tags — into unified CMDB scopes across clouds.
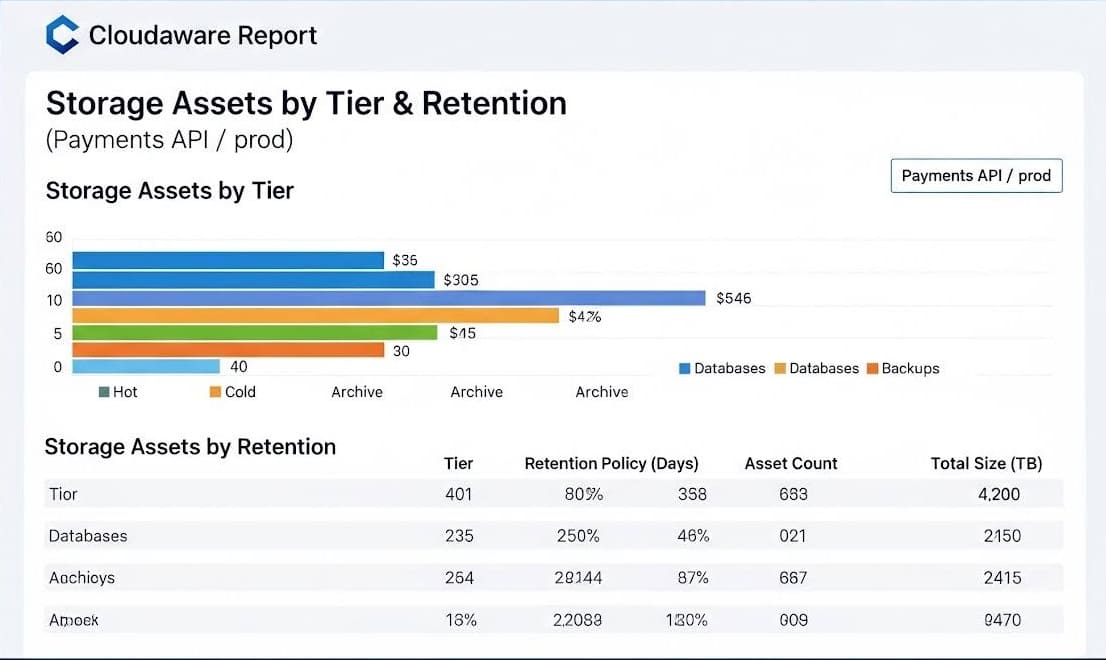
Cloudaware Report — Storage Assets by Tier & Retention (Payments API / prod)
From there, it layers in access timestamps, tag-based retention flags, and object age so you can spot drift, missed transitions, or forgotten volumes. You might define a policy like: “expire snapshot after 60 days unless tagged keep,” then review services or teams holding the largest share of high-tier data with no recent reads.
It gets even more effective when you align this with your change review flow. Bake lifecycle rules into your IaC modules, version them per storage class, and expose the tiering plan right in the PR.
That way, no one ships a workload with gigabytes of cold data sitting in the premium tier “just in case.”
What metrics to track
Track % of storage in each tier (hot, infrequent, archive), cost per GB per tier, volume of snapshots pruned per week, and missed policy violations. You can also calculate the effective savings per GB/month from tier shifts and lifecycle deletes.
Read also: 27 FinOps KPIs to Get the Most from Your Cloud Spend
Possible pitfall
One common mistake: moving large volumes into archive class without accounting for retrieval patterns. A client once archived 200+ TB of data that was pinged weekly for compliance checks. The retrieval costs doubled their projected savings.
Solution? Map actual access logs before applying cold-tier transitions, and always estimate retrieval fees per use case. Cloudaware flags frequent-access volumes and helps you simulate the cost delta before you commit.
These are the kinds of cloud cost optimization examples that teach your org to think beyond provisioning — into lifecycle, ownership, and long-term storage habits.
Read also: Cloud Migration Costs for Enterprises: Forecasting, Risks, and Savings Controls
Design to minimize data transfer and egress tax early
This practice helps you catch one of the sneakiest sources of cloud waste — egress charges. When workloads, services, and data sit in different regions, AZs, or networks, transfer costs quietly stack up behind the scenes.
Building with data proximity and traffic flow in mind reduces those fees before they even show up on the bill.
Among the most impactful cloud cost optimization best practices 2025, this one pays off the longer your system runs and scales.
Here’s how to implement it
The key is architecture-level awareness. Cloudaware automatically discovers your infrastructure and builds service-level scopes from tags and metadata. From there, the platform surfaces egress-heavy traffic patterns — cross-region transfers, inter-AZ traffic, and high-volume API calls between services in different VPCs or regions.
These costs are tied directly to scopes like app, team, or environment, so engineers can trace the financial impact of design decisions.
Once the signals are clear, start applying controls:
- Group compute and data in the same AZ or region.
- Use private links, VPC endpoints, and peering for internal traffic.
- Collapse chatty microservices that cross zones.
- Add caching layers for bursty APIs.
- Co-locate analytics jobs and storage to reduce transfer tax.
Design reviews should factor in expected GB/day egress and region-to-region flow patterns. Baking this into IaC modules and onboarding docs early helps shape a cost-aware architecture before it lands in prod.
What metrics to track
Measure total egress per environment, GB transferred per service pair, and €/GB in cross-region and inter-AZ traffic. Also track reduction in duplicate data movement across pipelines.
Possible pitfall to consider
Short-term projects can create long-term egress headaches — especially when they cross regions without proper network planning. One example: a week-long ETL workload pushed data between regions without using private links or setting any budget thresholds. The egress charges from that single job wiped out the month’s savings from commitments.
The issue wasn’t just cost — it was visibility. No alerting, no rollback plan, and no checklist to catch it before it ran. That kind of oversight is avoidable.
Build a deployment checklist for high-volume workloads that includes expected egress volume, network path (peered vs public), and fail-safes. Route jobs through private connectivity when possible, and apply soft or hard spend limits tied to usage metrics. If your platform supports it, set automated alerts based on regional transfer costs per service or scope.
The earlier you catch noisy patterns, the easier it is to course-correct — before the invoice lands.
Make Kubernetes costs first-class (requests/limits + showback)
Treating K8s spend as a first-class signal aligns engineering decisions with cloud cost optimization outcomes. When requests/limits, bin-packing, and namespace showback are enforced, you cut waste from over-requests, idle nodes, and orphaned PVCs — without guessing.
The payoff: fewer surprise bills, healthier clusters, and predictable capacity planning.
How to implement it?
Start with ownership. In Cloudaware, scopes are created automatically by reading your Kubernetes labels (team, service, env, etc.). The CMDB auto-discovers these groupings and ties them to cost, performance, and usage signals — no manual setup required.
Kubernetes Cost & Hygiene — Showback report element within Cloudaware.
Now harden hygiene:
- Establish guardrails: min/max CPU/memory requests per workload class; block
limits=0at admission. - Turn on VPA for drifted services and keep Cluster Autoscaler tuned to your node SKUs; verify pod disruption budgets so scale-in is safe.
- Right-size node groups for common pod shapes (avoid stranding due to CPU/mem fragmentation).
- Surface noisy neighbors: throttle events, OOMKills, and burst credits next to cost for the same scope.
- Clean storage: enforce TTL on ephemeral PVCs; snapshot policies for stateful sets.
Cloudaware’s platform ties these controls to cost overlays, commitments coverage, and anomaly views, so action items land in change reviews with owners and due dates.
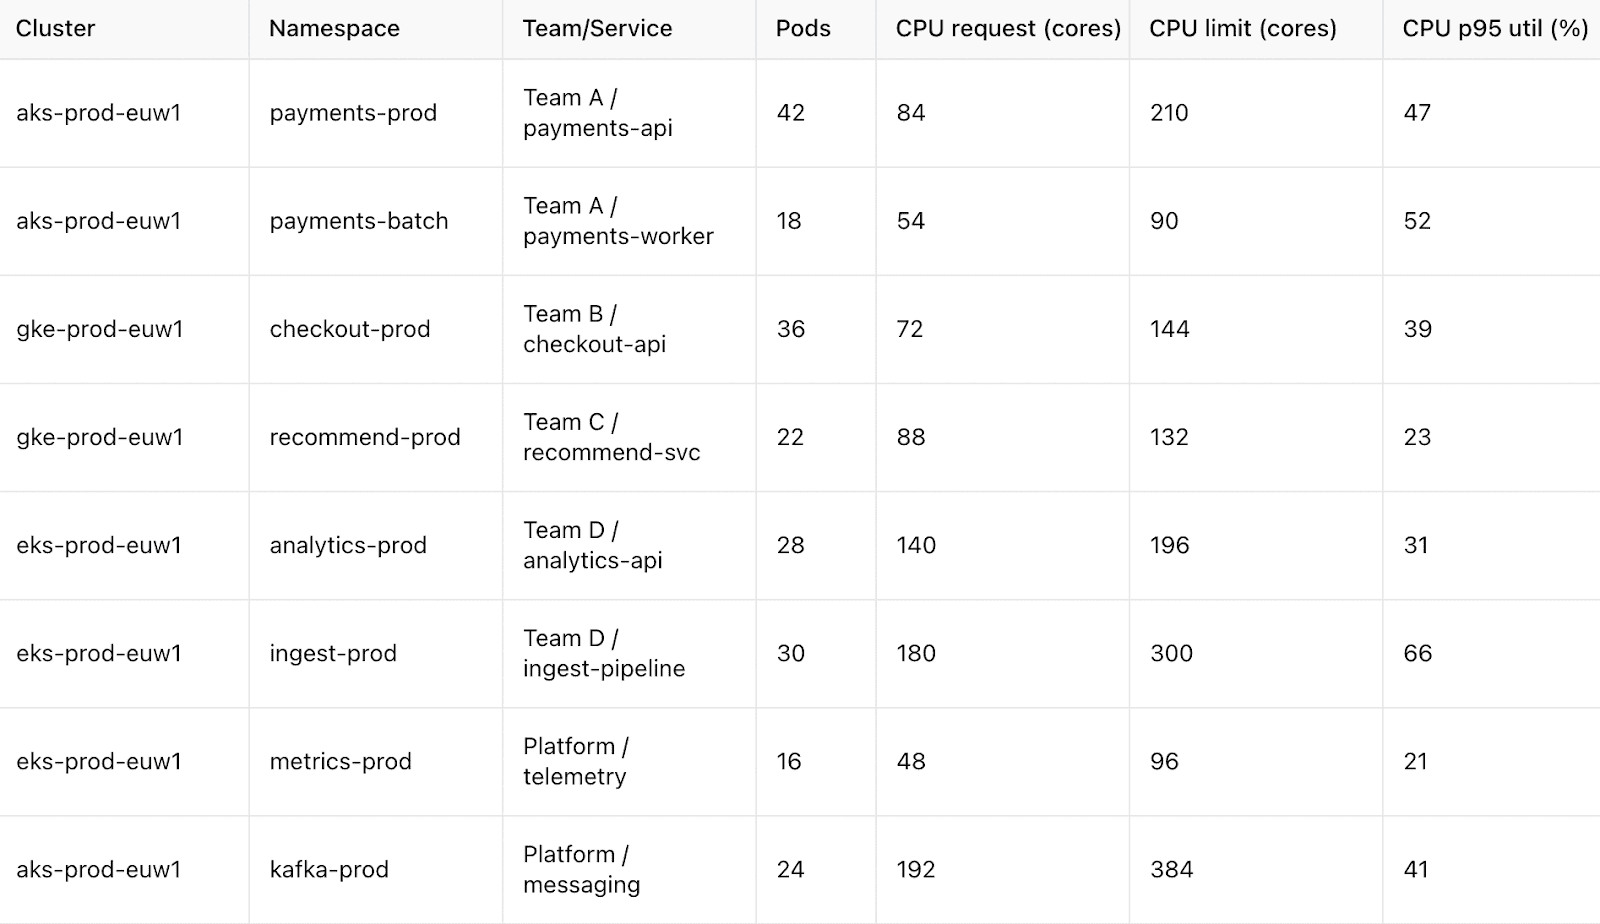
What metrics to track
Pod request vs. usage p95 (%), throttling rate, bin-packing efficiency (requested/allocatable per node), node idle hours, €/namespace and €/workload, unit cost trend, and % workloads within target request bands.
Add GPU queue time and utilization if you run accelerators. This feeds ongoing cost management and weekly FinOps reviews.
Possible pitfall to consider
We often see clusters “optimized” only at node level. Over-requests remain, autoscaler can’t scale in due to PDBs, and DaemonSets keep every node alive.
Another gotcha: mixed pod shapes on a single node group — fragmentation strands capacity even when utilization looks low.
Fix with: admission policies that cap requests, workload classes with sane defaults, periodic VPA recommendations, storage TTL for PVCs, and node group shapes aligned to dominant pod profiles. Document these norms in the service catalog and audit monthly, so drift doesn’t creep back.
Read also: Augmented FinOps - How the Best Teams Scale with Automation
Standardize “right-by-default” IaC modules
This practice builds cost awareness into your infrastructure from the very first deploy. By using standardized, pre-approved infrastructure-as-code (IaC) modules, you ensure that every provisioned resource arrives with the right size, tags, budgets, encryption, and alerting baked in.
It’s one of those rare moves that tightens cost management without slowing teams down. And over time, it brings cloud spending into predictable patterns that scale cleanly with usage.
How to implement it?
Start by curating a set of golden modules (Terraform, CloudFormation) with version control and owner documentation. For each module, define:
- Defaults: instance/storage classes, autoscaling boundaries, backup retention, encryption via KMS, network path rules, budget alarms, and tag schema.
- Interfaces: required inputs like
owner,env,app,cost_center— so metadata flows downstream. - Controls: attach policy-as-code checks to validate every plan — no untagged, unencrypted, or overpowered resources slip through.
Cloudaware automatically picks up these resources the moment they land. Its CMDB auto-discovers new stacks across cloud accounts, builds scopes based on your tagging conventions, and populates them with real-time data.
From there, allocation, anomaly tracking, and commitments coverage all work without manual mapping.
Use the tag completeness panel to catch anything misaligned and surface violations directly in CI so they’re fixed before merge.
PR templates should include a unit-cost delta preview and reference SLO thresholds. So cost tradeoffs are visible right at review. You can even attach scope-level budget alerts to flag drift before it snowballs.
What metrics to track
Measure % of infrastructure deployed via golden modules, CI policy pass rates, drift remediation time, and variance in €/unit between services using different module versions. That’ll show you which patterns need a tune-up.
Possible pitfall to consider
We’ve seen teams clone a golden module, change a default or two, and bypass governance entirely. Over time, this erodes consistency and leads to drift that’s expensive to unwind.
Cloudaware customers who’ve avoided this build a tight module lifecycle: auto-deprecate stale versions, enforce tagging + budget alarms as code, and back every upgrade with cloud cost optimization examples — actual before/after savings, fewer anomalies, and clearer team accountability.
That’s what keeps “right by default” from becoming “right once, forgotten later.”
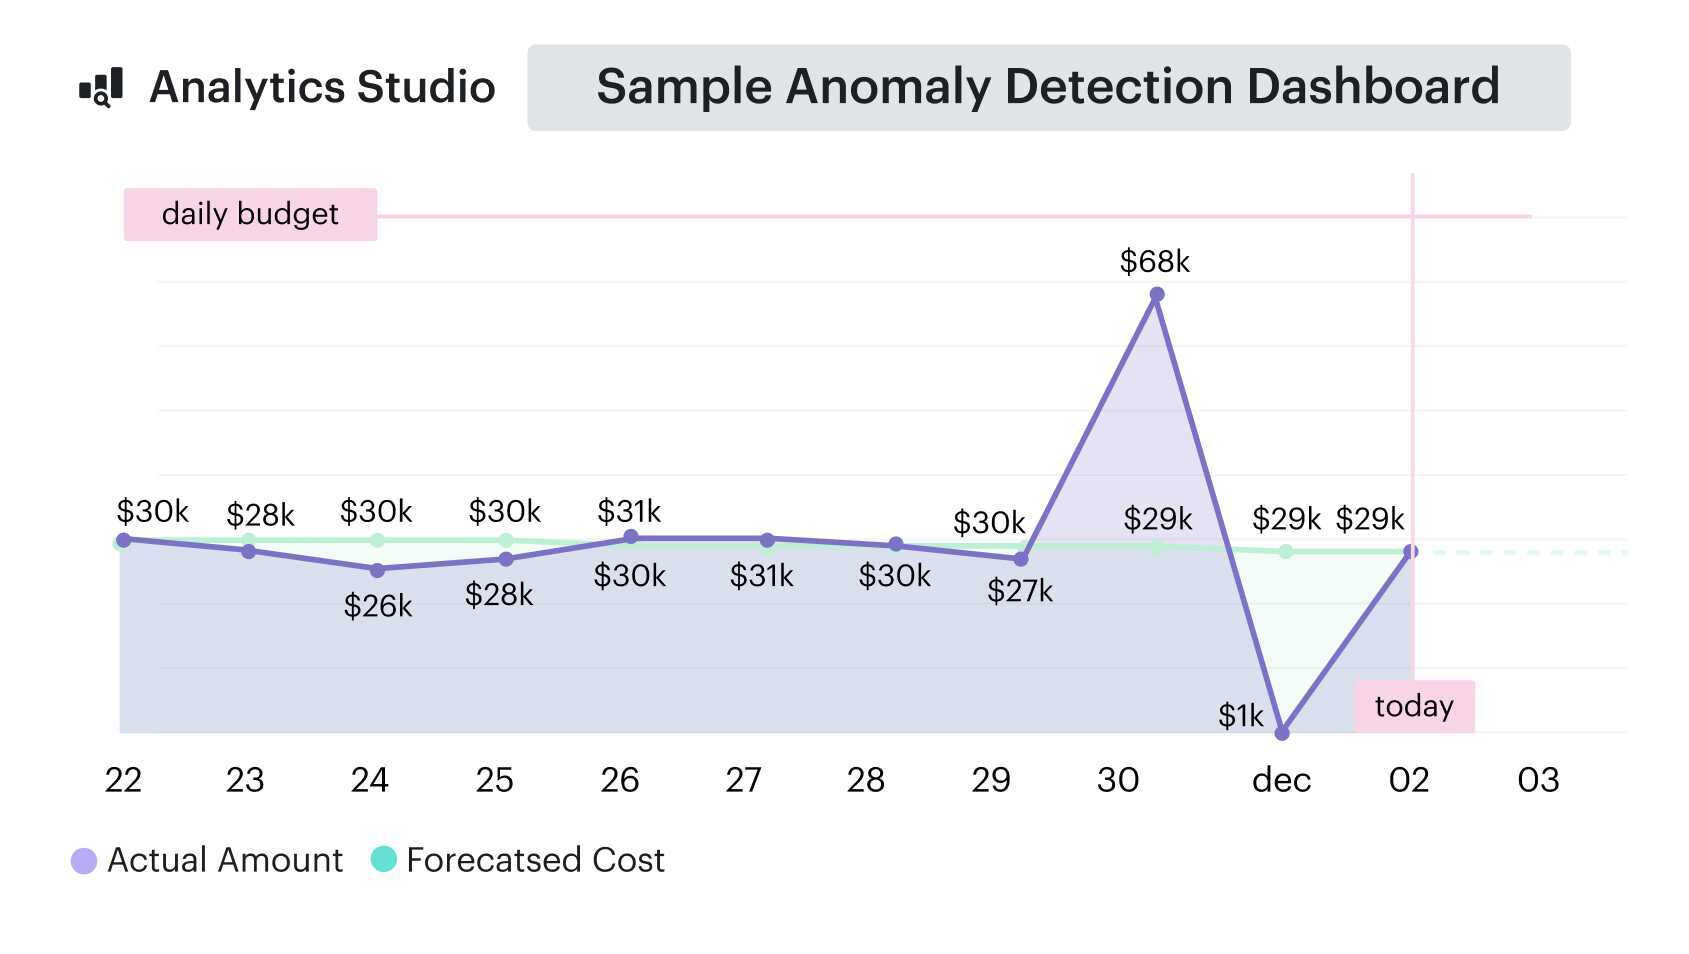
Operationalize anomaly detection with on-call runbooks
When spend spikes or usage patterns drift, the worst place to find out is in a monthly report. This practice shifts anomaly detection from “report and react” to a proactive, on-call-ready process.
You spot abnormal cloud resource behavior fast, assign ownership, trigger the right response, and log outcomes for future reference.
It’s one of the most pragmatic FinOps best practices for cloud cost optimization — and when done well, it shortens time-to-action from days to hours.
How to implement it
Start by defining anomaly types that matter in your environment. Think: unexpected usage spikes in a known scope, commitments utilization drops, tag gaps, or unplanned regional egress. Each anomaly type needs a playbook:
- Who owns the triage?
- What thresholds trigger escalation?
- What’s the rollback or fix action?
- Where do you verify the result?
If you’re using a platform like Cloudaware, you can plug anomaly detection directly into scopes built from your existing tagging. That means spikes are automatically tied to an app, team, and environment — making it clear who needs to act.
You can push alerts into Slack or Jira and attach the matching CMDB scope for full context.
Tagging inconsistencies, forgotten sandboxes, or underutilized committed spend are surfaced without manual digging.
To keep response tight, embed anomaly checks into your weekly FinOps loop. Treat them like incidents: track time to detection, time to resolution, and variance between forecasted vs. actual spend.
This makes anomaly resolution part of your regular cost management rhythm.
What metrics to track
Track false positive rate, mean time to detect, mean time to resolve, and how many anomalies resulted in a verified fix or savings. Review anomaly classes quarterly — retire noisy ones, tune thresholds, and flag new patterns as they emerge.
Possible pitfall to consider
What slows this down most? No ownership. Anomalies get flagged, but without clear triage responsibility, they pile up. We've seen teams log dozens of unresolved deltas because no one knew who owned the scope or had the control to act.
Avoid this by making anomaly ownership explicit in your CMDB or tagging conventions — tie each alert back to a person or squad with the ability to remediate. And always close the loop with verification, or you'll end up solving the same issue more than once.
Read also: 10 Cloud Cost Optimization Benefits In 2026
Showback/chargeback that changes behavior
This practice turns cost visibility into action. You publish clear, credible numbers per product, namespace, and team, then connect those numbers to budget owners and decision gates.
Done well, it nudges design choices, backlog priorities, and runbooks — quietly shifting habits week after week. It belongs in every list of cloud cost optimization best practices 2025 because it aligns engineering momentum with financial outcomes.
How to implement it?
- Start with clean attribution. Use tags/labels to map cloud resources to app, team, and environment. If you’re running something like Cloudaware, scopes are built automatically from that metadata and can be tied to per-scope cost, usage, and unit metrics.
- Next, publish showback scorecards on a fixed cadence: €/team, €/namespace, €/feature, plus unit cost (€/order, €/job). Add budget thresholds and “what to do next” prompts — rightsizing candidates, idle endpoints, egress outliers.
- For chargeback, keep it simple: direct costs flow to the owning scope; shared services are allocated by a fair driver (requests, GB, seats). Wire the numbers into the places work happens: PR templates, sprint review notes, and change approvals.
- If desired, light-touch incentives help: a small “savings credit” teams can trade for backlog work or lab time.
What metrics to track
Look at how many teams or scopes have active cost views, % of infrastructure with full tag coverage, number of actions triggered from showback data, and change in unit cost over time.
You can also track deviation from budget by team and how often that leads to actual optimization tasks.
Possible pitfall to consider
One thing that derails this fast: showback without context. If you dump raw spend into a dashboard but don’t tie it to business units, product metrics, or SLOs, it gets ignored. We’ve seen tools generate cost reports that look good on paper but never land in standups or planning docs.
The fix is alignment. Showback works when it reflects how people already structure their work — and when it becomes part of the conversation, not a parallel one. Tag with care, scope with intention, and revisit the format every few sprints to keep it actionable.
Refactor high-friction patterns to cut “operational tax”
This practice hunts down complexity that quietly taxes delivery — too many moving parts, noisy cross-region paths, duplicated data stores, one-off runtimes. Refactoring these hotspots reduces toil, egress, and failure blast radius, and it unlocks faster change cycles.
It absolutely belongs on any list of cloud cost optimization best practices because fewer seams mean fewer leaks.
How to implement it?
Run a quarterly “operational tax review” per product. Build a lightweight complexity score from signals you already collect:
- Count of components (functions, queues, databases) and cross-account edges.
- Inter-AZ/region GB, hop count per request, and egress € per service path.
- Change failure rate, MTTR, on-call pages, and deploy lead time.
- Idle runtime hours and orphaned endpoints.
If you’re using something like Cloudaware, lean on scopes (app/env/team) to aggregate cost overlays, egress hot spots, tag completeness, and anomaly history. Use that to rank refactor candidates.
Then ship small, reversible RFCs: consolidate redundant queues, co-locate compute and data, remove undeclared dependencies, trim unnecessary multi-region fan-out, and standardize runtimes in your golden modules.
Bake checks into IaC PRs, so every simplification is reviewed with SLO guardrails and unit-cost impact.
What metrics to track
Services per product, inter-AZ/region traffic, deploy lead time, change failure rate, on-call pages/week, €/request, and egress €/GB. Add % of infrastructure sourced from golden modules and variance of unit cost before/after refactor.
These roll up neatly into your FinOps cadence and management dashboards.
Possible pitfall to consider
Big-bang rewrites create risk without guaranteed savings. Another trap is deleting “unused” pieces that still have shadow consumers.
- Start with the no-regrets cuts: dead topics, duplicate data flows, and chatty links across regions.
- Map consumers via logs and tags before removal, add a deprecation window with alerts, and keep a rollback plan.
- Aim for iterative simplification that improves one service boundary at a time.
That rhythm compounds — and it’s friendly to change control, SLOs, and steady cloud optimization over quarters, not days.
Read also: Cloud Cost Optimization Metrics: 18 KPIs FinOps Track
Implement these best practices with Cloudaware cloud cost optimization tools
Cloudaware brings your cost, usage, and ownership signals into one place, then wires them into the workflows you already run. It ingests billing and telemetry across AWS, Azure, GCP, Oracle, Alibaba, and Kubernetes, auto-builds CMDB scopes from tags/labels, and enriches every € with app/team/env context.
From there, it’s straightforward to enforce tagging, model unit costs, tune commitments, rightsize by p95 signals, and operationalize anomaly response — using automation instead of manual spreadsheets.
FinOps-relevant feature snapshot
- Multi-cloud FinOps cost visibility across AWS, Azure, GCP, vCenter, Kubernetes; normalized reports for allocation/chargeback.
- CMDB auto-discovery that builds app/team/env context and highlights gaps (unmonitored/unbacked).
- CMDB-centric cost analysis & dashboards for applications/environments.
- Kubernetes cost visibility (namespace/workload perspectives supported via billing/usage).
- Anomaly detection views with CMDB-driven filters (tags, virtual tags, owners, BU).
- Tag management & coverage insights (find missing tags, organize across environments).
- Backup/snapshot policy management (EC2 backup) documented in admin how-tos.
If you’re evaluating the best FinOps software for cloud cost optimization 2025, focus on whether it enriches costs with CMDB context, supports multi-cloud billing, exposes Kubernetes costs, and lets you filter anomalies by owners and environments — all areas Cloudaware documents publicly.