


Someone asked, “What’s our cloud cost optimization framework?” And just like that — silence. No clean answer. Nothing battle-tested enough to survive a CFO review.
Maybe there’s a FinOps cadence in place. A few dashboards. But spend’s still spiky. Tags? Incomplete. Alerts? Ignored. Commitments? Still a bit of a gamble.
What’s missing is structure. A shared playbook that works across AWS, Azure, GCP — maybe even Oracle. One that engineering respects, finance understands, and leadership can review in under five minutes.
That’s what this article delivers. A practical, proven cloud cost optimization framework — grounded in FinOps maturity phases, scoped by teams, apps, and BUs, and built around execution.
- What billing exports should land daily — and in what format?
- What tags do you really need to get allocatable spend above 90%?
- Which dashboards prove you’re ready to optimize?
- How do you detect anomalies and route them to the right owner in minutes?
- What’s the safest way to rightsize prod without blowing up SLOs?
- When should you ladder commitments — and how do you track utilization post-purchase?
- What does a reliable reforecast cadence look like?
But before we dive into the details, let’s endure that we’re on the same page about basics 👇
What does cloud cost optimization framework mean in 2025?
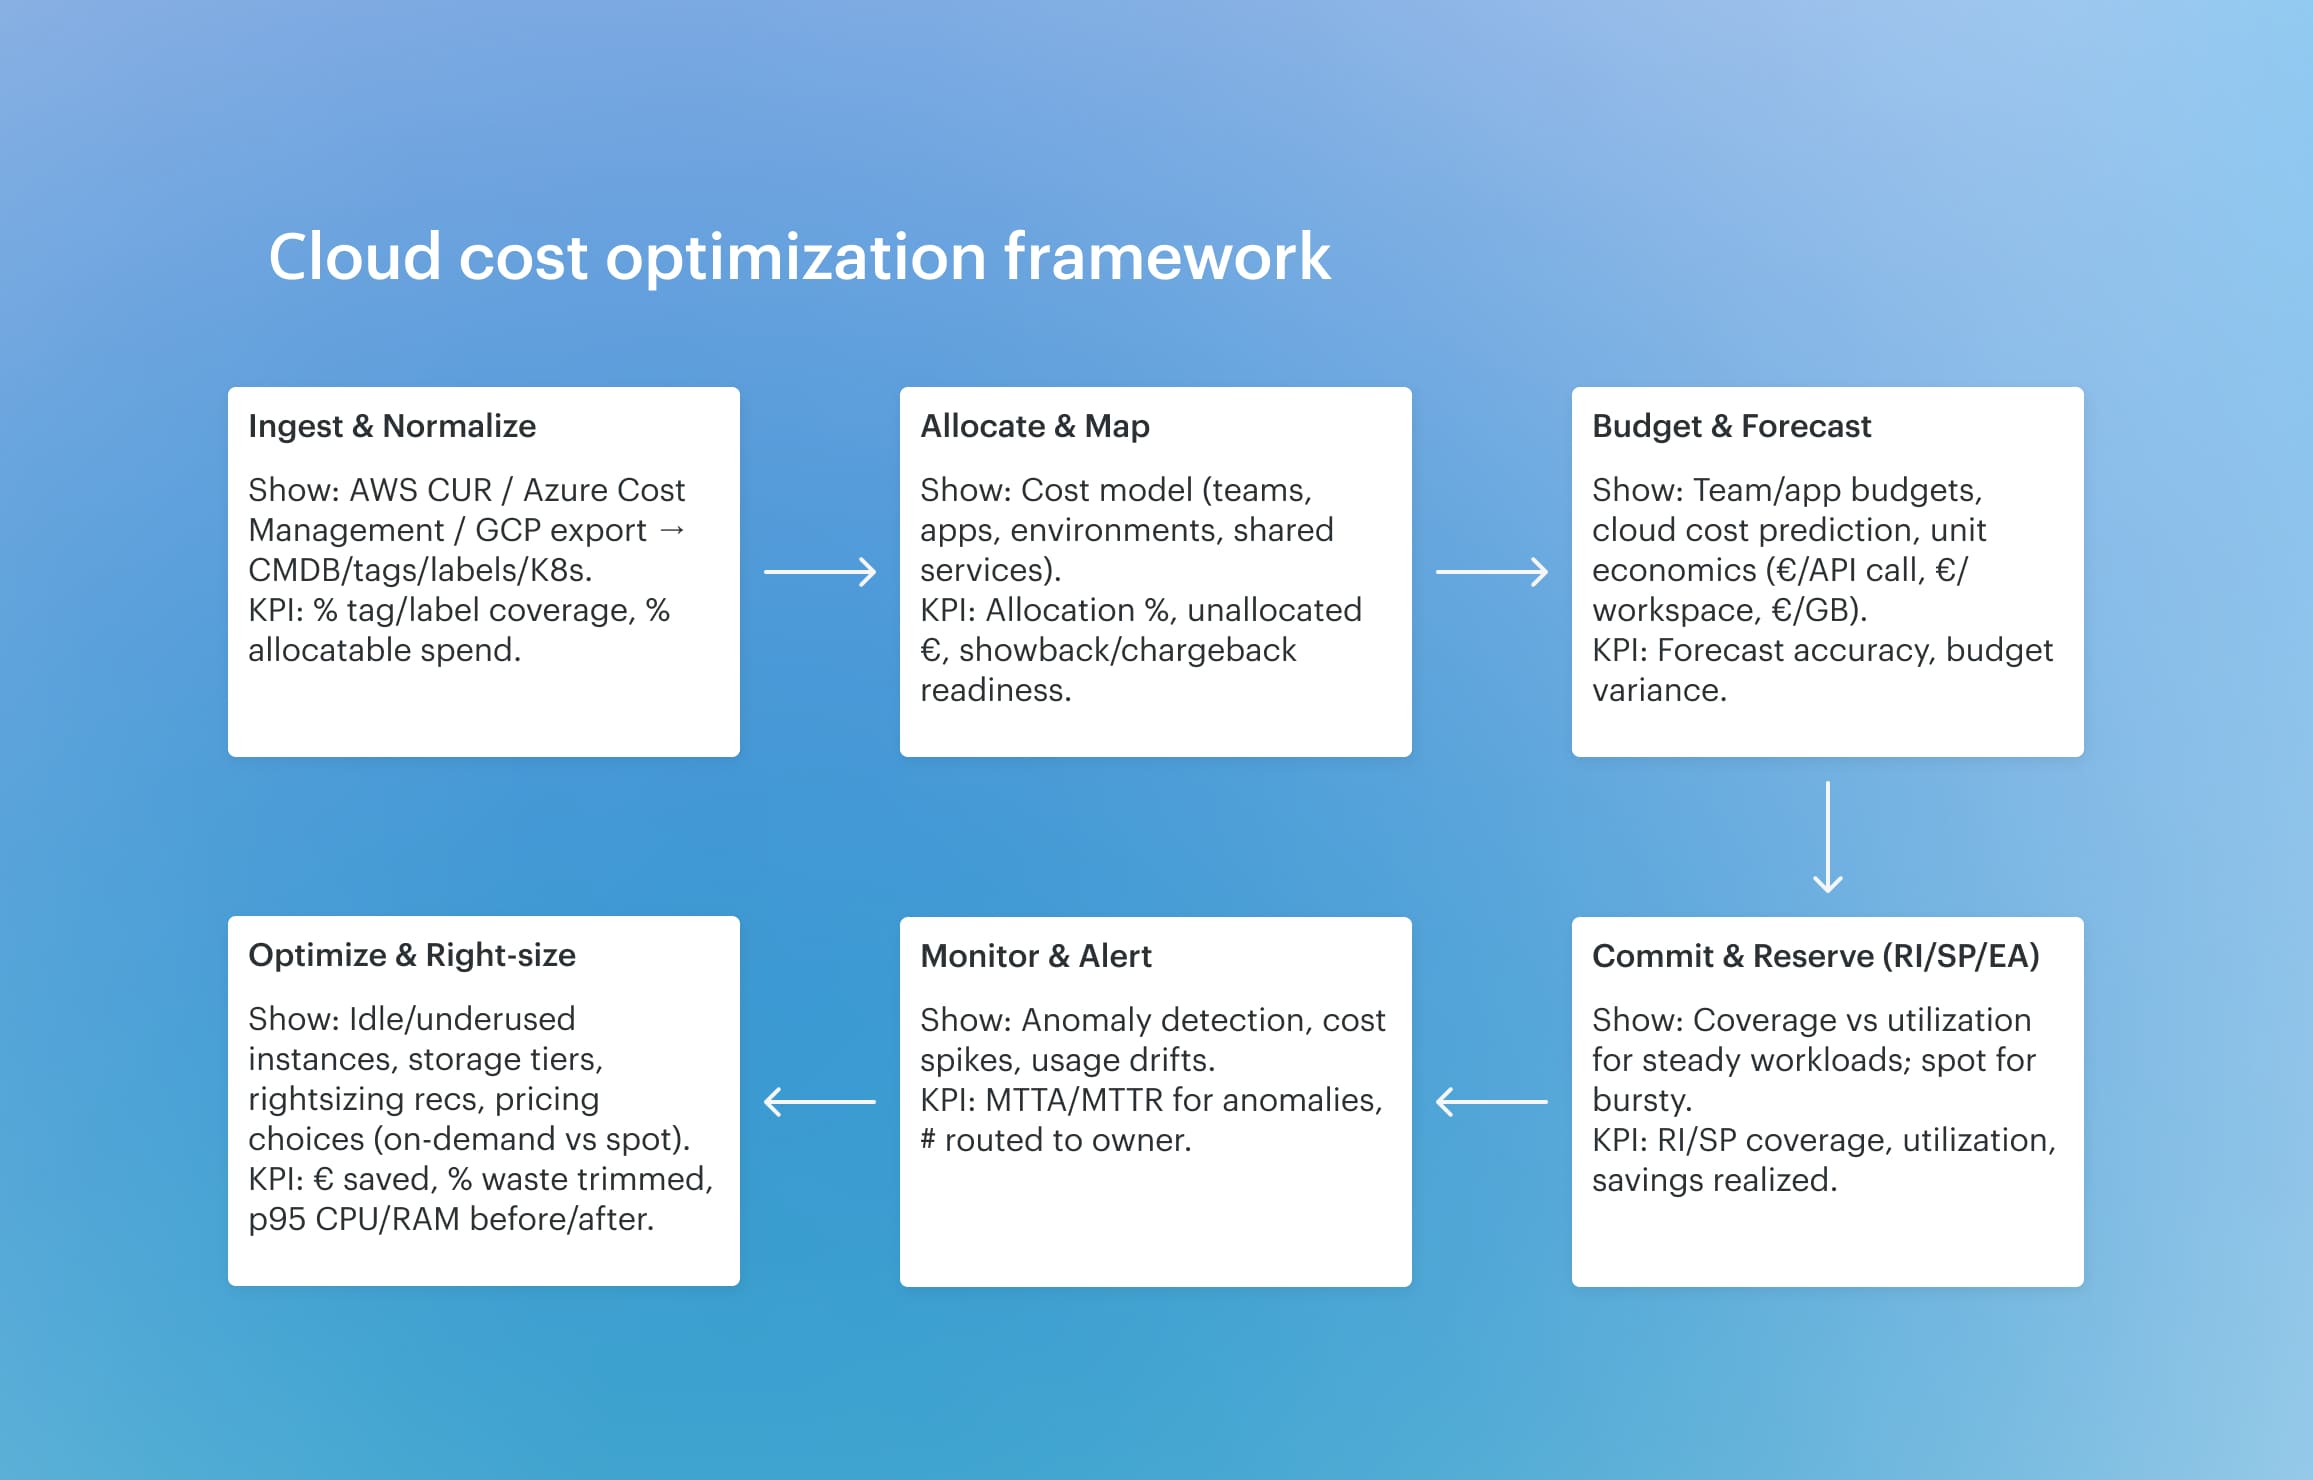
It is the system your org runs to track, control, and improve spend across clouds. Think daily billing ingests, strict tagging policies, alert routes, cloud cost forecasting cadences, and dashboards scoped to how your business actually operates — by team, app, and BU.
The 2025 shift? FinOps added Scopes. So your cloud cost management framework needs to define who owns what cost — and when that cost gets reviewed, optimized, or escalated. Not in spreadsheets. In tools people already use.
For example report on cloud cost allocation in Cloudaware:
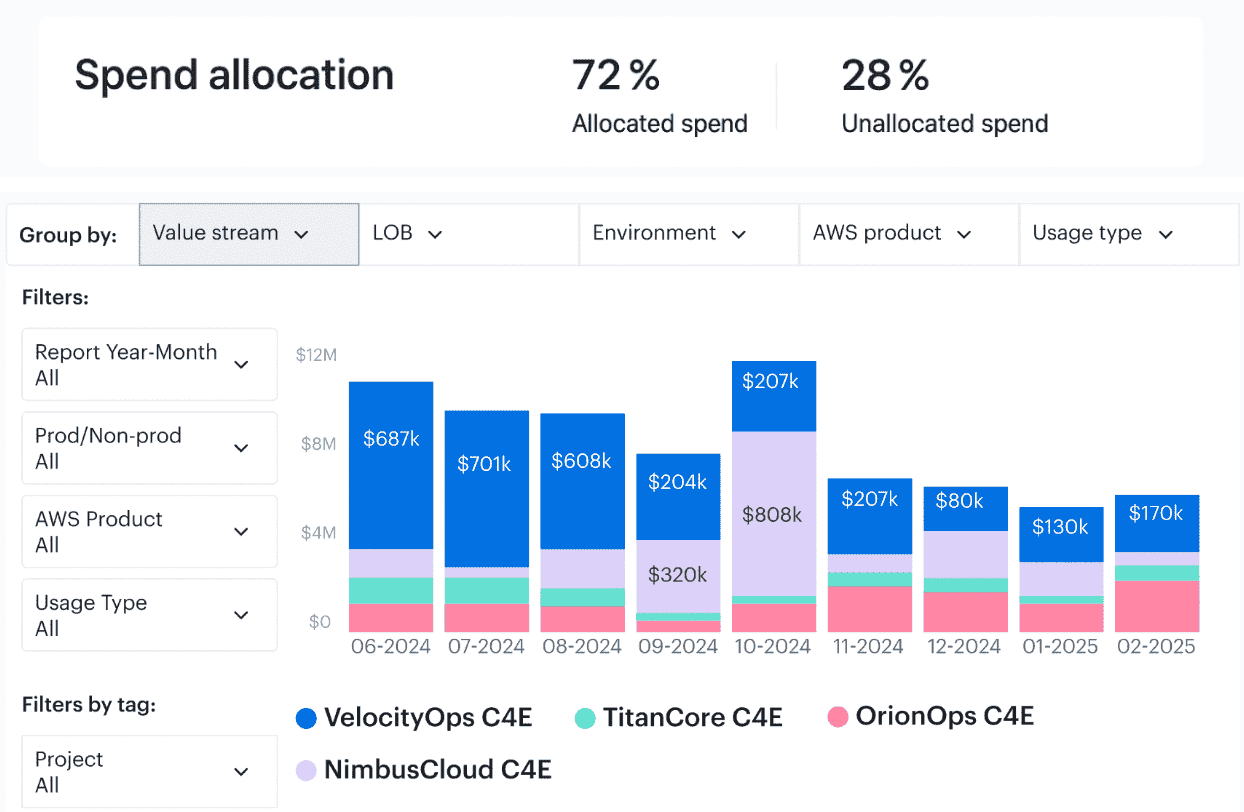
Example of the framework running in Cloudaware
Take Caterpillar. Their framework lives in Cloudaware.
- Billing data ingests daily across AWS CUR (hourly, via csv with amortized + unblended rates), Azure Cost Management export, and GCP BigQuery Billing — normalized and aligned into a single cost model by 6 a.m. CST.
- CMDB enrichment maps each cost record to an app and BU dynamically — not by tagging alone, but via ownership in Service Catalog and infra relationships.
- Tag compliance is enforced on ingest — missing
application__c,env__c, orowner_email__cgets flagged within 24h and routed back to the responsible engineering team. - Weekly FinOps ops review pulls RI/SP coverage (projected vs actual), cost anomalies grouped by owner, and top waste candidates — all pre-triaged and pushed into Jira or Slack based on owner & environment rules.
- Forecasting runs monthly, and Engineering leadership gets live variance reports — auto-adjusted for optimization backlog + active commitments + Kubernetes utilization signals.
Nothing lives in spreadsheets. Workflows trigger inside tooling engineers already use. Cloudaware is the operating layer — not a dashboard on the side.
That’s what “framework” means in real life. Want to build your cloud cost optimization framework? Start here 👇
1. Define scope, owners, and cadence
Every alert, forecast, and rightsizing action starts with this: What’s the scope? Who owns it? When do they act?
Skip this, and everything downstream — anomalies, budgets, cost optimization — stalls out.
Scopes come first. Map resources to Teams, Apps, and Business Units. Use your CMDB if it’s reliable, or tag directly using application__c, env__c, owner_email__c. Avoid multi-owner configs. One scope = one name. That’s what unlocks routing.
In Cloudaware, scopes link to tags and ownership metadata in your identity provider. Want to test it? Inject a dummy alert into ml-platform-prod and see if it lands in the right Slack. If not, trace why — bad tag, wrong role, missing email. Fix that now, not after invoice close.
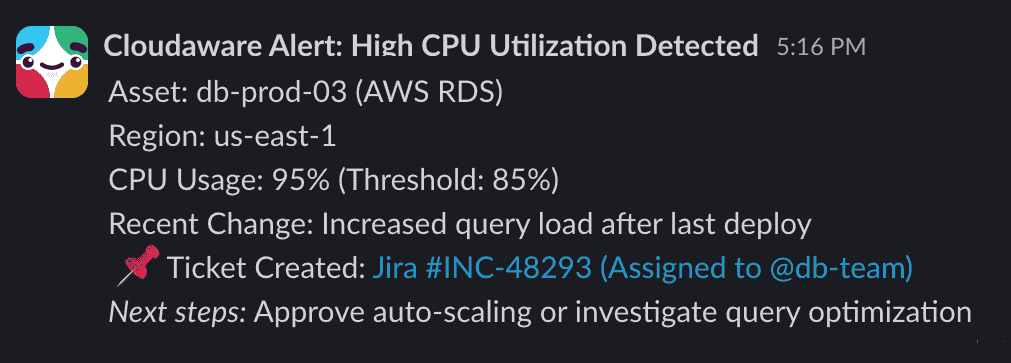
Example of the Slack alert from Cloudaware:
Next, assign review cadence:
- Tag audits → weekly
- Anomaly triage → daily
- Commitment planning → monthly
- Cloud cost forecasts → mid-month + pre-QBR
Cadence should match spend velocity. Spiky workloads? Review more often. Static BUs? Monthly’s fine.
This step wires ownership and accountability into your cloud cost management process — before the data even lands.
And when it does? You’d better have ingestion locked. That’s next.
2. Ingest & normalize AWS/Azure/GCP cost visibility for daily accuracy
No one builds a working cloud cost optimization framework on stale exports.
That’s why Cloudaware connects directly to your AWS, Azure, and GCP billing accounts — and pulls in raw usage automatically, every 24 hours, with zero manual setup.
Any questions on how it works? Ask our experts.
- AWS? CUR with hourly granularity, in Parquet, with amortized, blended/unblended, and SP-effective rates.
- Azure? Cost Management exports scoped to subscription or EA enrollment.
- GCP? Daily partitioned BigQuery Billing exports.
You don’t touch a thing. Cloudaware does the pulling, parsing, joining, and normalizing — across all providers — into a single cost model. Blended and unblended views are ready out of the box. Currency normalized. Line items enriched with service name, tag data, and CMDB relationships.
Want to see what landed? Open the “Billing Health” board. Check:
- Delivery time per provider
- Parsing completeness
- Line-level cost coverage
- Tag presence
- Missing resources flagged
That’s how you get cloud cost data you can trust — fast enough to catch anomalies the same day they spike.
Now that it’s all flowing and unified, it’s time to tag it right 👇
Read also: 6 Ways to (not) Fail AWS Cloud Cost Optimization in 2026
3. Enforce tagging & cost allocation standards
Without solid tagging, your cloud cost data won’t land where it belongs — and your cost optimization efforts won’t stick.
Here's what usually happens: Billing data lands. Tags are incomplete or wrong. Alerts don’t route. Forecasts blow up. And cloud spending piles up in “unallocated.”
That’s the risk. And it’s real.
In Cloudaware, tag validation happens automatically — at ingestion.
Every billing line is scanned daily across AWS, Azure, and GCP. Required tags like application__c, env__c, and owner_email__c are checked against your CMDB, label policies, and ownership fields.
If anything’s missing? It’s flagged. Grouped by scope. Routed to the exact tag owner — via Slack, Jira, or email.
You don’t chase engineers. The system does it for you.
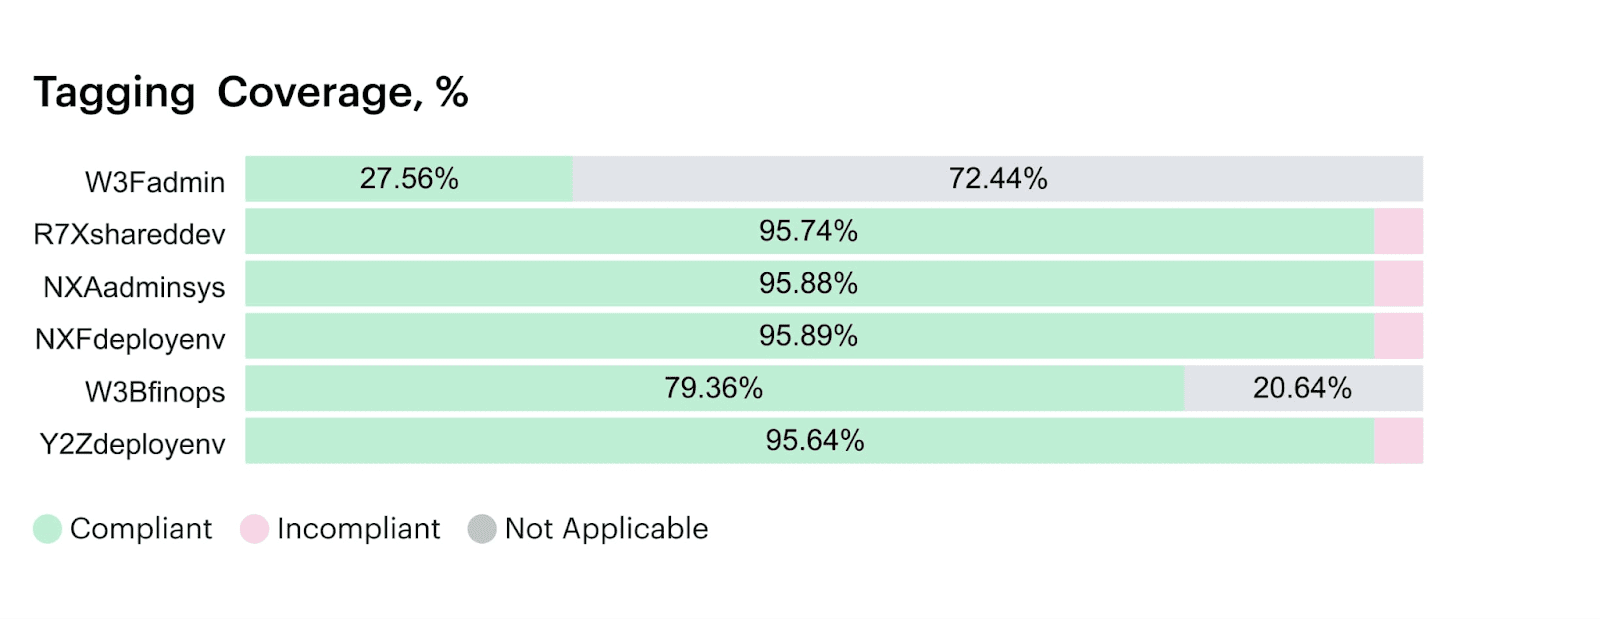
Want to see where you stand? Open the Tag Coverage Report:
- Allocatable spend % by scope.
- Top 10 missing tag types.
- Resource count delta week over week.
- % of cloud cost blocked from allocation.
An element of the tag coverage report in Cloudaware:
Schedule a demo to see it live.
Benchmarks worth aiming for (based on Cloudaware clients experience) :
- 90% allocatable spend by sprint 3.
- <5% of tagged resources missing required fields.
- 100% of untagged spend escalated within 24 hours.
This isn’t about tagging hygiene. It’s about making cost allocation automatic and reviewable — so your costs get routed, not ignored.
Now let’s surface the right dashboards to prove it’s working.
Read also: AWS Cloud Cost Management: A Practical Guide
4. Stand up baseline dashboards & KPIs that matter
Dashboards are where cost management becomes visible, trusted, and reviewable. Not once a quarter — daily.
In Cloudaware, prebuilt dashboards populate automatically the moment your billing data lands. No manual joins. No stale exports. Just clean, normalized views that FinOps, DevOps, and engineering teams can act on.
Start with these five core boards:
The top services by cost dashboard
shows your largest spend drivers across AWS, Azure, and GCP — sorted by service, scoped by team, and filterable by tags like application__c, env__c, and owner_email__c. Engineering leads use this board in sprint review to spot usage creep or changes in cost distribution.
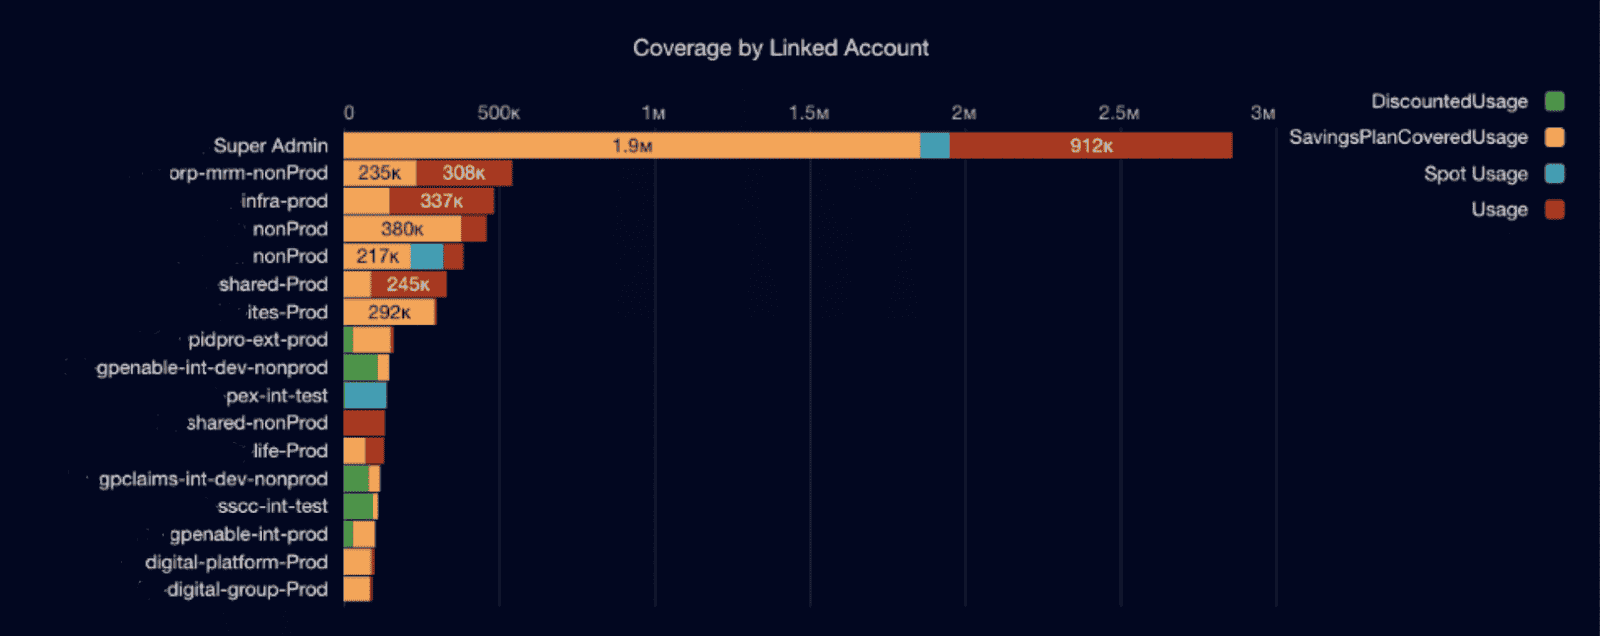
Cloudaware FinOps dashboard element. Schedule a demo to see it live.
Unallocated spend %
Reveals where tagging or ownership breaks. If more than 10–15% of your cloud cost is falling into “unassigned,” expect chargeback and forecast accuracy to take a hit. Cloudaware tracks this daily. According to Pelanor, Walk-level maturity targets ≥90% allocatable spend. Set alerts for anything below that.
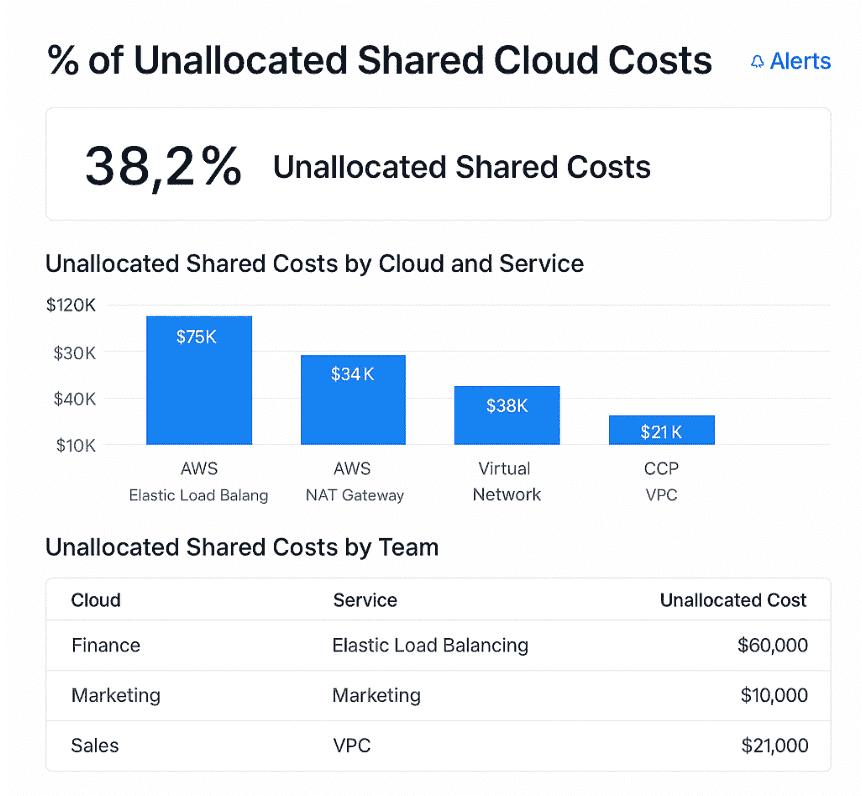
This is an example of a dashboard on unallocated shared costs. Schedule a demo to see it live.
Daily cost deltas
Show percent change by service or app, day over day. Default alert: ±10% variance routes directly to the scope owner via Slack or email. This board surfaces the unknowns — sudden job spikes, Terraform misfires, or scale-ups no one planned. And it catches them within 24 hours, not at month close.
RI/SP coverage and utilization
Splits into two boards. Coverage tracks what % of eligible resources are covered by existing commitments. Utilization monitors how much of what you bought is actually used. FinOps Foundation recommends 60–85% coverage and >90% utilization for steady-state workloads. If you’re under, pull in engineers. If you’re over, check autoscaling policies and commit sizing.
Element of the RI utilization data report in Cloudaware. Schedule a demo to see it live.
Savings coverage
Answers one question: how much of your spend has an actionable optimization attached — rightsizing, deprovisioning, or commitment alignment. This is where FinOps meets prioritization. Use it to triage backlog candidates every sprint.
Everything updates daily. Dashboards can be filtered by team, app, BU, region — any tag or CMDB field. Stakeholders can subscribe to receive reports by email or Slack. And every chart supports drilldown: click a spike → see the asset → open a ticket → assign the owner.
Following a structured framework helps teams consistently achieve meaningful cloud cost savings, even in complex multi-cloud setups.
Next: alerts. Let’s talk about filtering signal from noise — and how to route anomalies to the right owner, fast.
Read also: Cloud Cost Optimization Metrics: 18 KPIs FinOps Track
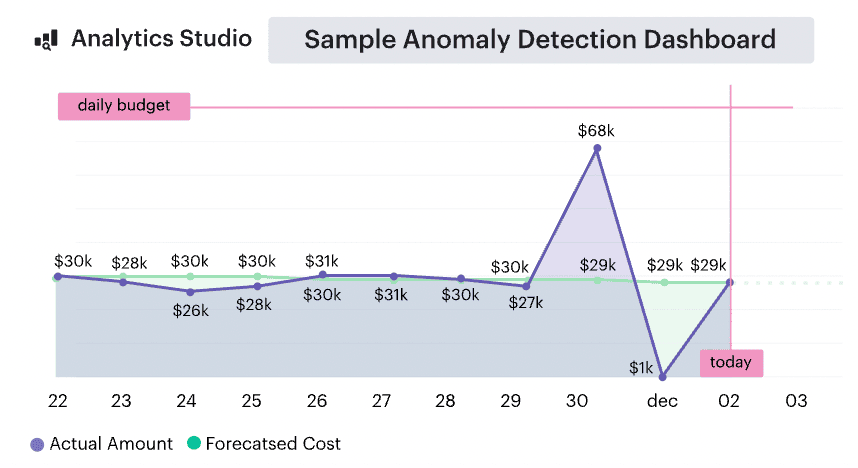
5. Configure anomaly detection & alert hygiene by team/app
When you have all the FinOps data visible. It’s time to make it actionable — by wiring alerts to the right people, with the right context, fast enough to matter.
In Cloudaware, anomaly detection runs automatically during ingest. The platform looks at every new cloud cost delta and checks it against your last 7, 14, or 30 days of baseline data. It doesn’t just scan totals — it tracks changes across service, scope, tag, region, and even specific resources. You don’t configure thresholds manually. You just define the logic: who gets alerted, and how.
Here’s what that looks like in practice.
A 17% spike hits ml-platform-prod overnight. Cloudaware maps it to the application__c and owner_email__c fields. Within 30 minutes, the alert hits Slack — routed directly to the engineering owner. Not the FinOps team. Not a catchall inbox. The actual person running that scope.
Each alert shows:
- Which service spiked
- How much, how fast
- What scope it's linked to
- Whether it’s already covered by an RI/SP
Alerts that don’t meet routing rules get escalated. You can build fallback chains — by tag, BU, or even env=prod.
Example of alet in slack:
Everything lands in the Anomaly Feed dashboard. From there, engineers or FinOps can snooze it, resolve it, or send it to Jira. Every alert has a full audit trail.
By default, Cloudaware monitors:
- 10% day-over-day cost increases (by service, app, or BU)
- Unexpected activity on decommissioned resources
- Net-new spend in unallocated buckets
- Sudden drops in RI/SP utilization mid-cycle
To prevent alert fatigue, dev/test environments are automatically filtered. Batch jobs, known spikes, and deployments tagged with ignore_cost_alerts=true are suppressed by default.
According to the FinOps Foundation, Walk-level maturity means anomalies are routed and reviewed within 24 hours — with fewer than two ignored alerts per week. If that’s your target, this is how you hit it.
And when that anomaly turns out to be a waste pattern? You shouldn’t need a ticket to track it down.
Read also: 12 Multi Cloud Management Platforms: Software Features & Pricing Review
6. Automate waste detection for idle/orphaned resources
Cloud bills stay high even after workloads slow down. That’s usually waste — unused resources left running, unattached storage still billing, or old infra no one deprovisioned.
Cloudaware catches it before the invoice does.
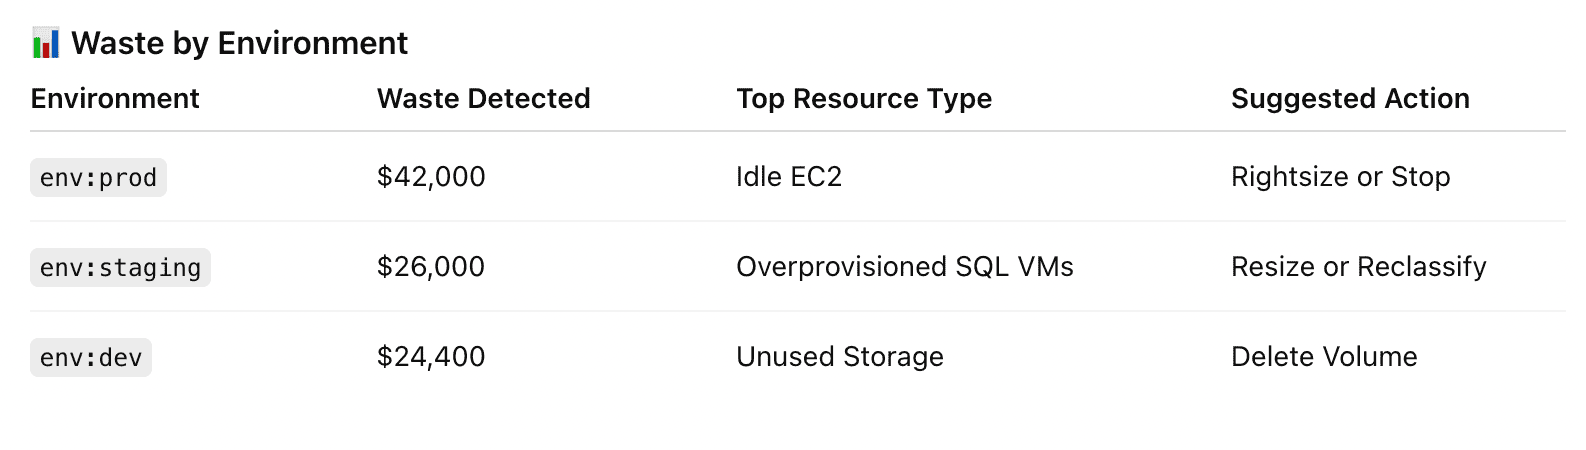
Element of the waste detected report in Cloudaware. Schedule a demo to see it live.
The platform runs over 100 waste detection policies automatically, every day, across AWS, Azure, and GCP. It parses billing data, checks for usage signals, cross-references the CMDB, and flags anything that looks idle, unattached, or orphaned.
We’re talking about EBS volumes no longer mounted, snapshots that survived their parent instance, Azure disks with no VM, EIPs that haven’t had a packet in 30 days, or GCP IPs billing without traffic. All of it shows up.
Each item is scored — confidence %, savings estimate, risk level — and grouped by application, team, or BU using your tagging scopes. From there, Cloudaware pushes review-ready tickets to Jira or Slack with the context already attached: reason code, owner, service, region, estimated reclaim value.
Two views keep you in control:
- Waste Candidates shows what can be removed now.
- Blocked Deletes shows what’s exempt — based on tags like
keep_for_audit=trueor exceptions from compliance policies.
According to Flexera, 32% of cloud spend is still waste. The FinOps Foundation says orgs at Walk maturity typically bring that under 10% — and it stays low because waste detection becomes a repeatable process.
This step clears what shouldn’t be running at all. Next, it’s time to resize what is running — and what’s too big for its workload. Let’s talk rightsizing 👇
Read also: 12 Cloud Cost Management Tools: Software Features & Price
7. Rightsize VMs, DB, and Kubernetes
Overprovisioning isn’t a mistake. It’s a default. When no one has time to monitor usage and the risk of SLO misses is too high, resources stay oversized. This step fixes that — safely.
Cloudaware runs rightsizing continuously, using p95 and p99 CPU, memory, and IOPS metrics across your entire environment. Compute, databases, containers. The platform pulls usage data, overlays it with cloud cost rates and RI/SP coverage, then surfaces recommendations that won’t break workloads or ownership models.
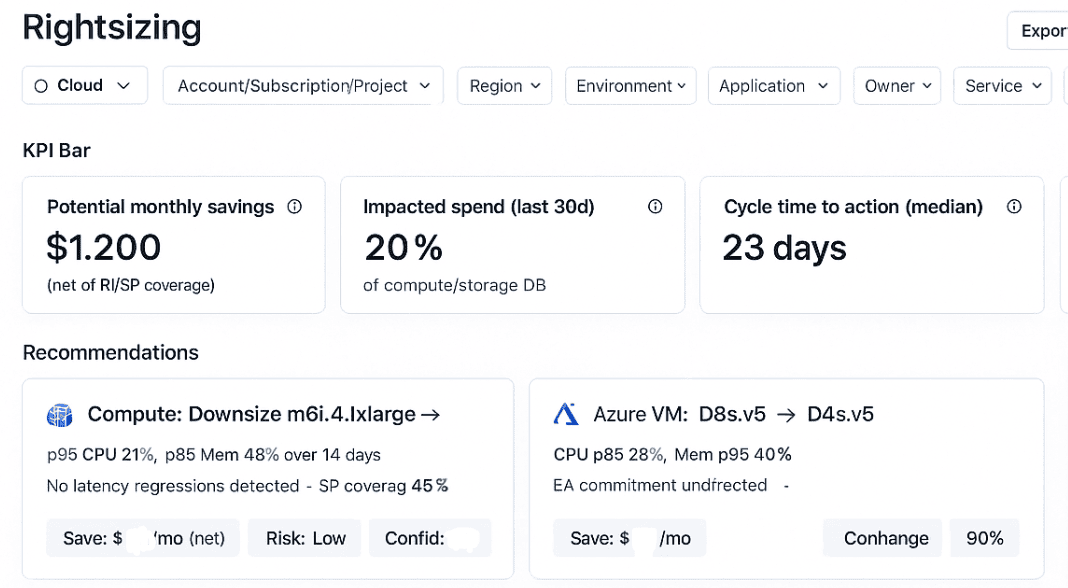
Schedule a demo to see it live.
Let’s say you’ve got a m6i.4xlarge running at 31% CPU and 43% memory for 14 days straight. Cloudaware compares it to your SLO thresholds, flags no performance regressions, and recommends a move to 2xlarge. It includes confidence score, risk level, and post-rightsize savings with or without existing RI/SP coverage. You can export the list or push it straight into Jira.
For RDS, recommendations include burst patterns and backup behaviors. db.r6g.large instances that spike once a week but idle for the rest? They stay. But if p95 hovers below 20% and IOPS is flat, Cloudaware flags it for reduction with a “safe to downgrade” note.
Kubernetes is scoped by namespace. Cloudaware reviews container request/limit ratios, node allocations, and actual usage over time. If your requests are consistently 2–3x above usage, the platform flags it, quantifies potential savings, and estimates the impact on pod density and bin packing.
Every rightsizing candidate includes:
- target instance class or resource config
- daily net savings estimate
- coverage + utilization check
- SLO guardrail confirmation
- confidence level (low/med/high, based on volatility and data range)
You can accept, snooze, or send to backlog. Recommendations can be filtered by app, team, BU, tag, or region. Engineering leads get their filtered views weekly. FinOps can track acceptance rate, time to decision, and total savings realized.
According to Wiz, rightsizing saves 20–30% of compute costs in orgs with strong optimization practices. FinOps Foundation recommends embedding rightsizing into the sprint cadence — reviewed weekly or biweekly.
This is how your cloud cost management framework evolves from audit to action.
Next: let’s lock in what’s steady.
Read also: Cloud Migration Costs for Enterprises: Forecasting, Risks, and Savings Controls
8. Plan RIs/Savings Plans/EA with coverage & utilization targets
Once workloads are right-sized, it's time to commit with confidence. But this is where most FinOps teams stall — either they’re too conservative and miss out on savings, or too aggressive and get stuck with unused capacity. Cloudaware removes the guesswork.
The platform tracks RI, Savings Plan, and EA coverage across AWS, Azure, and GCP — down to the instance type, region, and scope. It analyzes actual usage data, overlays it with existing commitments, and flags where you’re underprotected or overcommitted. Both coverage and utilization are monitored daily.
Let’s say prod-eu-central-1 has 6,000 hours of c6i.2xlarge usage last month. Cloudaware shows 78% of that is covered by RIs, and utilization sits at 92% — solid. But it also catches that in Azure, D8s_v5 workloads tied to the Finance BU are sitting on 42% EA utilization. That’s a 58% waste stream on committed spend — flagged automatically, with owner + impact already assigned.
Each commitment object in Cloudaware includes:
- real-time coverage %
- forecasted and actual utilization
- breakage risk (what’s at risk if you scale down or shift usage class)
- laddering insights (short vs. long term commitment mix)
You can view this by app, team, or business unit. Forecasts are auto-adjusted every time your resources change — new deployments, decommissions, rightsizing, Kubernetes autoscaling — so your planning window stays accurate without manual cleanup.
FinOps Foundation recommends keeping RI/SP coverage between 60–85% and utilization >90% for steady-state workloads. Cloudaware tracks both in real time and lets you route gaps to the right owner before they become losses.
This is where cost optimization gets locked in long-term. And now that your coverage strategy is working, it’s time to make sure spend actually lands where it should 👇
9. Set budgets, showback/chargeback, and route variance automatically
Budgets are where cloud cost visibility becomes enforceable. The problem? By the time finance sees the overspend, it’s already month-end — and engineering teams only find out when someone’s angry. This step fixes that.
In Cloudaware, budgets are live objects scoped by app, team, BU, or environment — mapped using tags, CMDB relationships, and owner metadata. They don’t sit in isolation. Every budget tracks actual cloud cost daily, flags variance in real time, and knows exactly who’s accountable.
Say ml-platform-prod has a monthly budget of $43K. On day 17, Cloudaware detects a spike — daily spend just pushed variance to 12%. It routes the alert to the app owner in Slack with a breakdown by service, region, and top offending resources.
No owner on the tag? The alert escalates to the BU lead via fallback logic. Every alert is tracked and timestamped.
Showback kicks in automatically. Teams get dashboards showing what they’ve spent, what it was used on, and how that tracks against forecast. Finance sees total costs by BU, app, or tag — fully allocatable. Engineering sees spend per cluster, per workload, per scope. This makes optimization strategy decisions faster, because no one’s surprised.
Chargeback is the next layer. Cloudaware supports full, partial, or fixed allocation rules. Want to split GPU cluster spend 40/30/30 across three AI teams based on usage? Done. Want a flat $12K/month for shared data-eng-prod infra? Set it once. Let the system allocate and notify.
All budget thresholds are customizable — 5% variance for prod, 20% for staging, higher for test. Alerts are sent via Slack, email, or Jira, based on environment and tag ownership. No budget reviews buried in spreadsheets. No chasing down who deployed what.
FinOps Foundation recommends showback at Crawl and chargeback at Walk maturity. Cloudaware makes both automatic, reviewable, and audit-ready.
Once budgets and ownership are real, you can forecast with accuracy 👇
10. Build forecasts and a monthly reforecast cadence
Forecasts fail when they lag behind actual usage. New workloads land mid-month. Rightsizing cuts aren’t reflected. Commitments change, but the plan doesn’t. And then someone asks, “Why are we 22% over?”
In Cloudaware, forecasting is automated and continuous. The system ingests real-time billing data, overlays it with optimization signals and commitment coverage, and outputs scope-level projections that update daily. Every forecast adjusts based on what’s changed — not just what was planned.
Example of the Cloudaware cloud cost forecasting report:
Schedule a demo to see it live.
Let’s say analytics-platform-prod was forecasted at $65K this month. You’re tracking closer to $71K. Cloudaware flags the delta on day 18, traces it to increased BigQuery usage and uncommitted GKE nodes added during the second sprint, and shows the impact by service, region, and owner. That insight routes to the product team automatically — no spreadsheet, no email chain.
Forecasts are commitment-aware. RI/SP coverage and EA tiering are factored in. So is waste removal and accepted rightsizing. Anomaly spend can be included or suppressed depending on whether the issue was resolved. And every forecast shows your projected cloud cost, plus the most likely contributors to next month’s variance.
You can view forecasts by team, app, BU, or tag — whatever scope you use for budgets and chargeback. Snapshots can be pushed to dashboards or sent as part of your weekly FinOps review.
FinOps Foundation recommends keeping forecast variance under ±15% and reforecasting at least monthly. Cloudaware helps teams hit that by embedding reforecasting into their live cost workflows — where changes are tracked and variance is visible before it becomes a problem.
11. Operationalize the loop: workflows, SLAs, and governance to run the framework
Forecasts won’t stick, and cost signals won’t matter, if every next step depends on a FinOps analyst manually following up. This is where the cloud cost management framework gets automated — not just visualized.
In Cloudaware, cost events trigger action. Rightsizing recs generate Jira tickets. Budget variances hit Slack. Anomalies, commitment issues, and missing tags are escalated without you needing to send a single DM.
Workflows are scope-aware. If Cloudaware flags 14 oversized m6i.4xlarge resources in ml-prod, it creates a ticket with owner, projected cost savings, risk profile, and next action. If there's no owner_email__c, fallback logic escalates to the BU lead. SLAs apply by environment — e.g., production rightsizing must be reviewed in 3 days, forecast deviations over 10% acknowledged same day. It all runs automatically. You don’t chase anything.
Governance is built into the policy engine. You can define rules for tag presence, naming formats, unauthorized instances, region use, and shadow workloads. Violations trigger alerts, tickets, or blocking actions — depending on how strict your org needs it. Every action — ignored, resolved, or snoozed — is logged in the audit trail.
This closes the loop: signals come in, action routes out, ownership is tracked, outcomes are measured. Forecast accuracy improves. Cost optimization moves faster. Teams are accountable without being babysat.
Once the framework is in place, teams typically translate it into concrete cloud cost optimization strategies that guide day-to-day engineering decisions.
How Cloudaware automates your cloud cost optimization strategy
Cloudaware is the FinOps execution layer for teams managing real complexity — multi-cloud, multi-team, fast-moving. It connects billing, usage, ownership, and optimization data into one operational flow that runs daily, not monthly.
The platform integrates natively with all major cloud providers — AWS, Azure, GCP, Oracle, and Alibaba. It ingests billing exports in real time, without throttling, and normalizes everything into a unified cost model. CURs, Azure Cost Management exports, BigQuery Billing tables — pulled daily, processed instantly. No lag. No batch jobs. Just live cost visibility at scope, service, and owner level.
The core advantage? CMDB-enriched intelligence.
Cloudaware links every resource to real application context using its native CMDB. That means every cloud cost is traceable to the owning team, app, environment, and business unit. Tagging isn’t optional — it’s enforced. The platform detects gaps, routes fixes to the right owner, and tracks % allocatable spend by scope.
FinOps Foundation defines Walk maturity as ≥50% allocatable spend. Cloudaware gives you that — and proves it.
Here’s what’s automated:
- Tag enforcement — Required tags (
application__c,env__c,owner_email__c) are checked at ingest. Missing or malformed tags trigger alerts or routing actions, no manual audits needed. - Real-time dashboards — Cost by service, unallocated %, RI/SP coverage, rightsizing impact, anomaly feed. Updated every 24 hours. Filtered by team, app, or BU.
- Anomaly detection — Spikes >10% flagged automatically. Alerts routed to owners via Slack, Jira, or email. Anomaly context includes top resources, projected overspend, and action deadline.
- Rightsizing — Continuous p95 CPU/Memory scans for EC2, RDS, Azure VMs, and Kubernetes containers. Recommendations include savings estimate, confidence %, SLO impact. Push-to-Jira enabled.
- Commitment tracking — RI/SP/EA coverage vs. utilization monitored daily. Forecasts auto-adjust when workloads scale or change. Breakage risk flagged early.
- Budgets + variance routing — Budgets scoped by tag or CMDB app. Variance alerts hit owners automatically, with delta context and Slack escalation if ignored.
- Chargeback/showback — Allocations by usage or fixed rule. Reports sent weekly. Finance, product, and engineering all get the same cost truth.
- Forecasting — Updated daily. Reflects rightsizing actions, new workloads, and commit plans. Forecast accuracy tracked against real spend.
- Audit + SLA tracking — Every alert, optimization, or ticket has a lifecycle. Actioned or ignored. Who saw it, when, and what they did next.