


Your AWS blended rates are improving, Azure RI coverage is holding at 78%, and GCP anomaly detection is catching spikes before they balloon. But… is that good? Or are you still stuck in Crawl when you thought you were running?
The FinOps maturity model answers that by turning “we think we’re doing fine” into proof, benchmarks, and a plan for what’s next.
It’s knowing if your forecast variance is tightening quarter over quarter. It’s having anomaly alerts that fire before a spend spike hits finance’s radar. It’s hitting 90%+ commitment utilization without leaving shadow resources untagged.
In this guide, we’ll answer the questions you actually care about:
- How to tell, with data, which maturity stage you’re in now.
- The benchmarks and KPIs that define each stage.
- The capabilities you need to unlock the next level.
- Common roadblocks — and how to sidestep them without disrupting cost control workflows.
But first, let’s check if we’re on the same page about definition👇
What exactly is the FinOps maturity model?
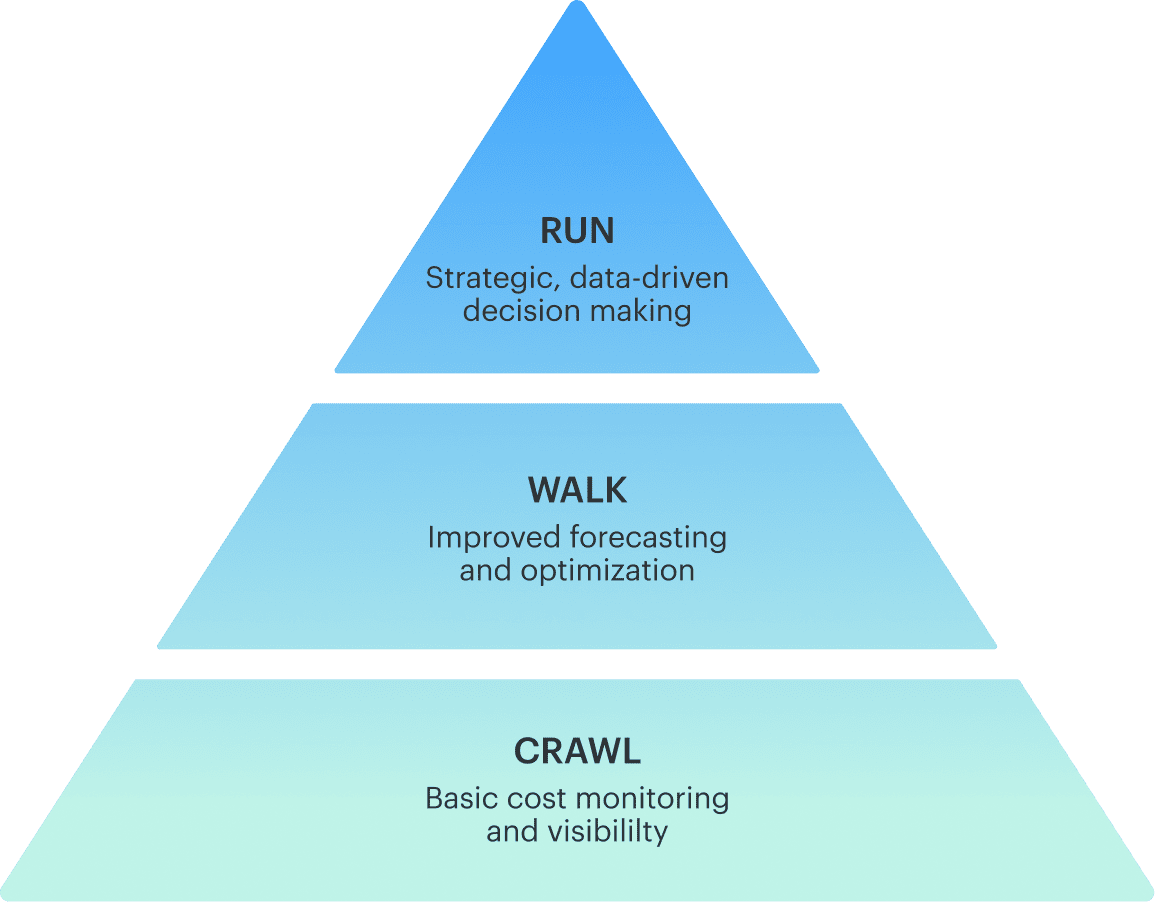
Think of the FinOps maturity model as the part of the FinOps framework that tells you, in no uncertain terms, where your practice stands — and what it will take to grow it. At its simplest, it’s a progression through three stages — Crawl, Walk, and Run — each one defining the capabilities, metrics, and decision-making maturity you’ve achieved.
It’s a structured approach to moving from reactive “why did our bill spike?” moments to a state where cloud cost decisions are intentional, forecasted, and tied to business value. This model breaks your FinOps practice into clear levels, each with its own measurable capabilities.
Without knowing your maturity stage, it’s almost impossible to set the right expectations or invest in the right improvements. You could be over-engineering processes you’re not ready for, or under-investing in capabilities that would transform your results.
Let’s take a practical example. Say your cloud commitment planning happens once a year, based on last quarter’s usage. That’s functional, but limited.
Using the maturity model, you’d assess this process, recognize it sits at an early stage, and see the path forward:
- integrate commitment tracking into monthly or daily reports,
- automate utilization checks,
- and link purchase approvals directly to deployment pipelines.
Suddenly, commitment planning isn’t an isolated task — it’s part of a connected, measurable FinOps process that continually adds value.
The model itself is built on three core elements:
- Processes — from Tagging Governance and Cost Allocation to Anomaly Management, Forecasting, Commitment Planning, Automated Optimization, and Chargeback/Showback.
- Benchmarks — measurable indicators that confirm you’ve truly mastered each capability.
- Progression stages — structured steps that help these processes mature together rather than in isolation.
Understanding the model at a high level is one thing. But the real value comes from knowing exactly what each stage demands — and that’s where we move next: breaking down Crawl, Walk, and Run into the specific skills, benchmarks, and outcomes you should be aiming for.
Decoding the Three Levels of FinOps Maturity: Crawl, Walk, Run
In the FinOps maturity model, Crawl, Walk, and Run are real, measurable maturity levels that shape how your FinOps processes handle visibility, forecasting, and optimization in the cloud. Think of them as the checkpoints that tell you exactly how each part of your cost practice is performing — with data to back it up.
Most teams move through these stages in order, but let’s be honest, it’s rarely all in sync. You might have tagging governance cruising along at Run while anomaly management is still figuring itself out in Crawl. That’s fine. The win is knowing where each process stands so you can put your energy into the ones holding you back.
Let’s break down Crawl, Walk, and Run, look at what each stage actually feels like in practice, and spot the signs that you’re ready to level up.
Crawl
It’s 8:42 a.m., you’re halfway through your coffee, and the anomaly alert you set up last month is pinging… after the spike already hit the invoice.
Welcome to Crawl — the maturity level where visibility is the goal, but speed is still out of reach. In this stage, every FinOps process is about pulling data together, cleaning it up, and making sense of it before the next “where did that cost come from?” call lands.
Day-to-day FinOps processes here looks like:
- Running tagging audits and chasing missing keys across accounts.
- Pulling cloud usage data from multiple billing exports and stitching it together manually.
- Producing monthly cost reports in spreadsheets or basic BI dashboards.
- Spotting anomalies only after they’ve hit finance’s desk.
- Breaking down spend by project, team, or environment to defend numbers in budget reviews.
- Fielding last-minute questions without the full story at hand.
The cost of staying here? Spikes turn into Monday fire drills. Commitments sit unused for weeks. Small gaps in coverage snowball into real money lost.
Take commitment planning. You bought $120K in Reserved Instances last spring. Three months later, workloads shifted regions, coverage dropped to 58%, and the gap was quietly filled with on-demand rates. No automated tracking, no daily utilization checks — the issue only surfaces at quarter close, when finance spots the jump. At Crawl, you can report the problem, but you can’t stop it in motion.
Micro-win to start moving forward: standardize a core tag set across every account and run compliance checks weekly. Even that small habit starts tightening your view — and makes the next maturity jump easier.
Walk
When you’re in Walk, the numbers start working for you. Forecast variance is tightening to ±15%. RI/SP coverage is in the 60–85% sweet spot. Tagging compliance is holding above 90%. And that’s not just vanity data — it means your FinOps processes are feeding decisions before cloud cost problems get expensive.
At this maturity level, the shift is real. You’ve moved from explaining last month’s bill to actively shaping next month’s. We see it all the time with clients and in our own ops — once forecasts are trusted, the entire conversation changes.
Finance uses them for reforecast cycles, engineering plans around them in sprint reviews, and product teams stop guessing at their cost impact.
A normal week here? It’s a mix of high-value reviews and quick interventions:
- Checking forecast accuracy against seasonal patterns, then updating the model so variance stays inside target.
- Sitting down with engineering before a deployment to model the delta in commitments and on-demand usage.
- Running monthly optimization reviews that aren’t just EC2 rightsizing — we’re talking storage class moves, cross-region traffic cost tuning, and decommissioning zombie workloads.
- Tracking RI/SP coverage continuously, not in quarterly bursts, and adjusting before renewal dates lock you in.
- Routing anomaly alerts straight into Slack or Jira, with CMDB context — owner, environment, business service — so the person getting pinged already knows what they’re looking at.
And the magic here is in the interlocks. Commitment planning pulls utilization from your cost reports and syncs it with CI/CD schedules. Anomaly detection isn’t an isolated script — it’s tied to change management, so you’re seeing spend shifts in context.
Anna, ITAM expert at Cloudaware:
If you’re aiming for Run, start here: automate RI/SP coverage tracking and add purchase guardrails. We rolled that out internally and saw coverage stability improve by 12% in one cycle. No more babysitting spreadsheets, no more end-of-month surprises.”
Run
Run is where your FinOps maturity is fully operational — and the difference from Walk is unmistakable. Forecast variance tightens from ±15% to a consistent ±5–10%. RI/SP coverage jumps from tracked-but-manual to automated, holding above 90% quarter after quarter.
Tagging compliance moves from disciplined to near-automatic, locked at 95%+ across every account, with drift corrected before it hits a report.
At this maturity level, FinOps processes are no longer calendar-based tasks — they’re embedded into the way the cloud runs.
- Allocation happens in real time.
- Predictive forecasting is continuous, running weekly scenarios against live usage data and feeding directly into budget and product planning.
- Commitments are purchased or adjusted automatically inside guardrails you define, backed by full audit trails for governance and compliance.
And chargeback/showback? It sits in the same dashboard as performance and reliability metrics, so teams see their spend in context — cost per transaction, per API call, per user session — tied directly to business KPIs.
A normal week at Run:
- Reviewing predictive forecasts that model multiple usage paths before a product launch.
- Monitoring automated anomaly alerts that arrive with remediation playbooks and linked owners.
- Running automated commitment planning — the system flags expirations, models replacements, proposes purchases, and routes them for two-click approvals.
- Expanding optimization workflows across AWS, Azure, and GCP with a unified set of guardrails, ensuring policies apply everywhere without duplication.
- Evaluating workload placement trade-offs between providers based on both performance needs and contractual cost commitments.
- Producing monthly executive reports that are as much about cost strategy as they are about spend — used in quarterly business reviews to shape roadmaps.
The interlocks are seamless: forecasting is tied into CI/CD guardrails, cost thresholds block high-impact changes until reviewed, anomaly detection is part of incident response, and commitment management talks directly to both budget owners and engineering leads for instant alignment.
The move from Walk to Run isn’t about doing more — it’s about doing less manually.
Automation and integration remove repetitive tasks, free up your team to focus on strategy, and give you the confidence to scale without fearing runaway cloud cost.
Key FinOps capabilities and benchmarks at each maturity level
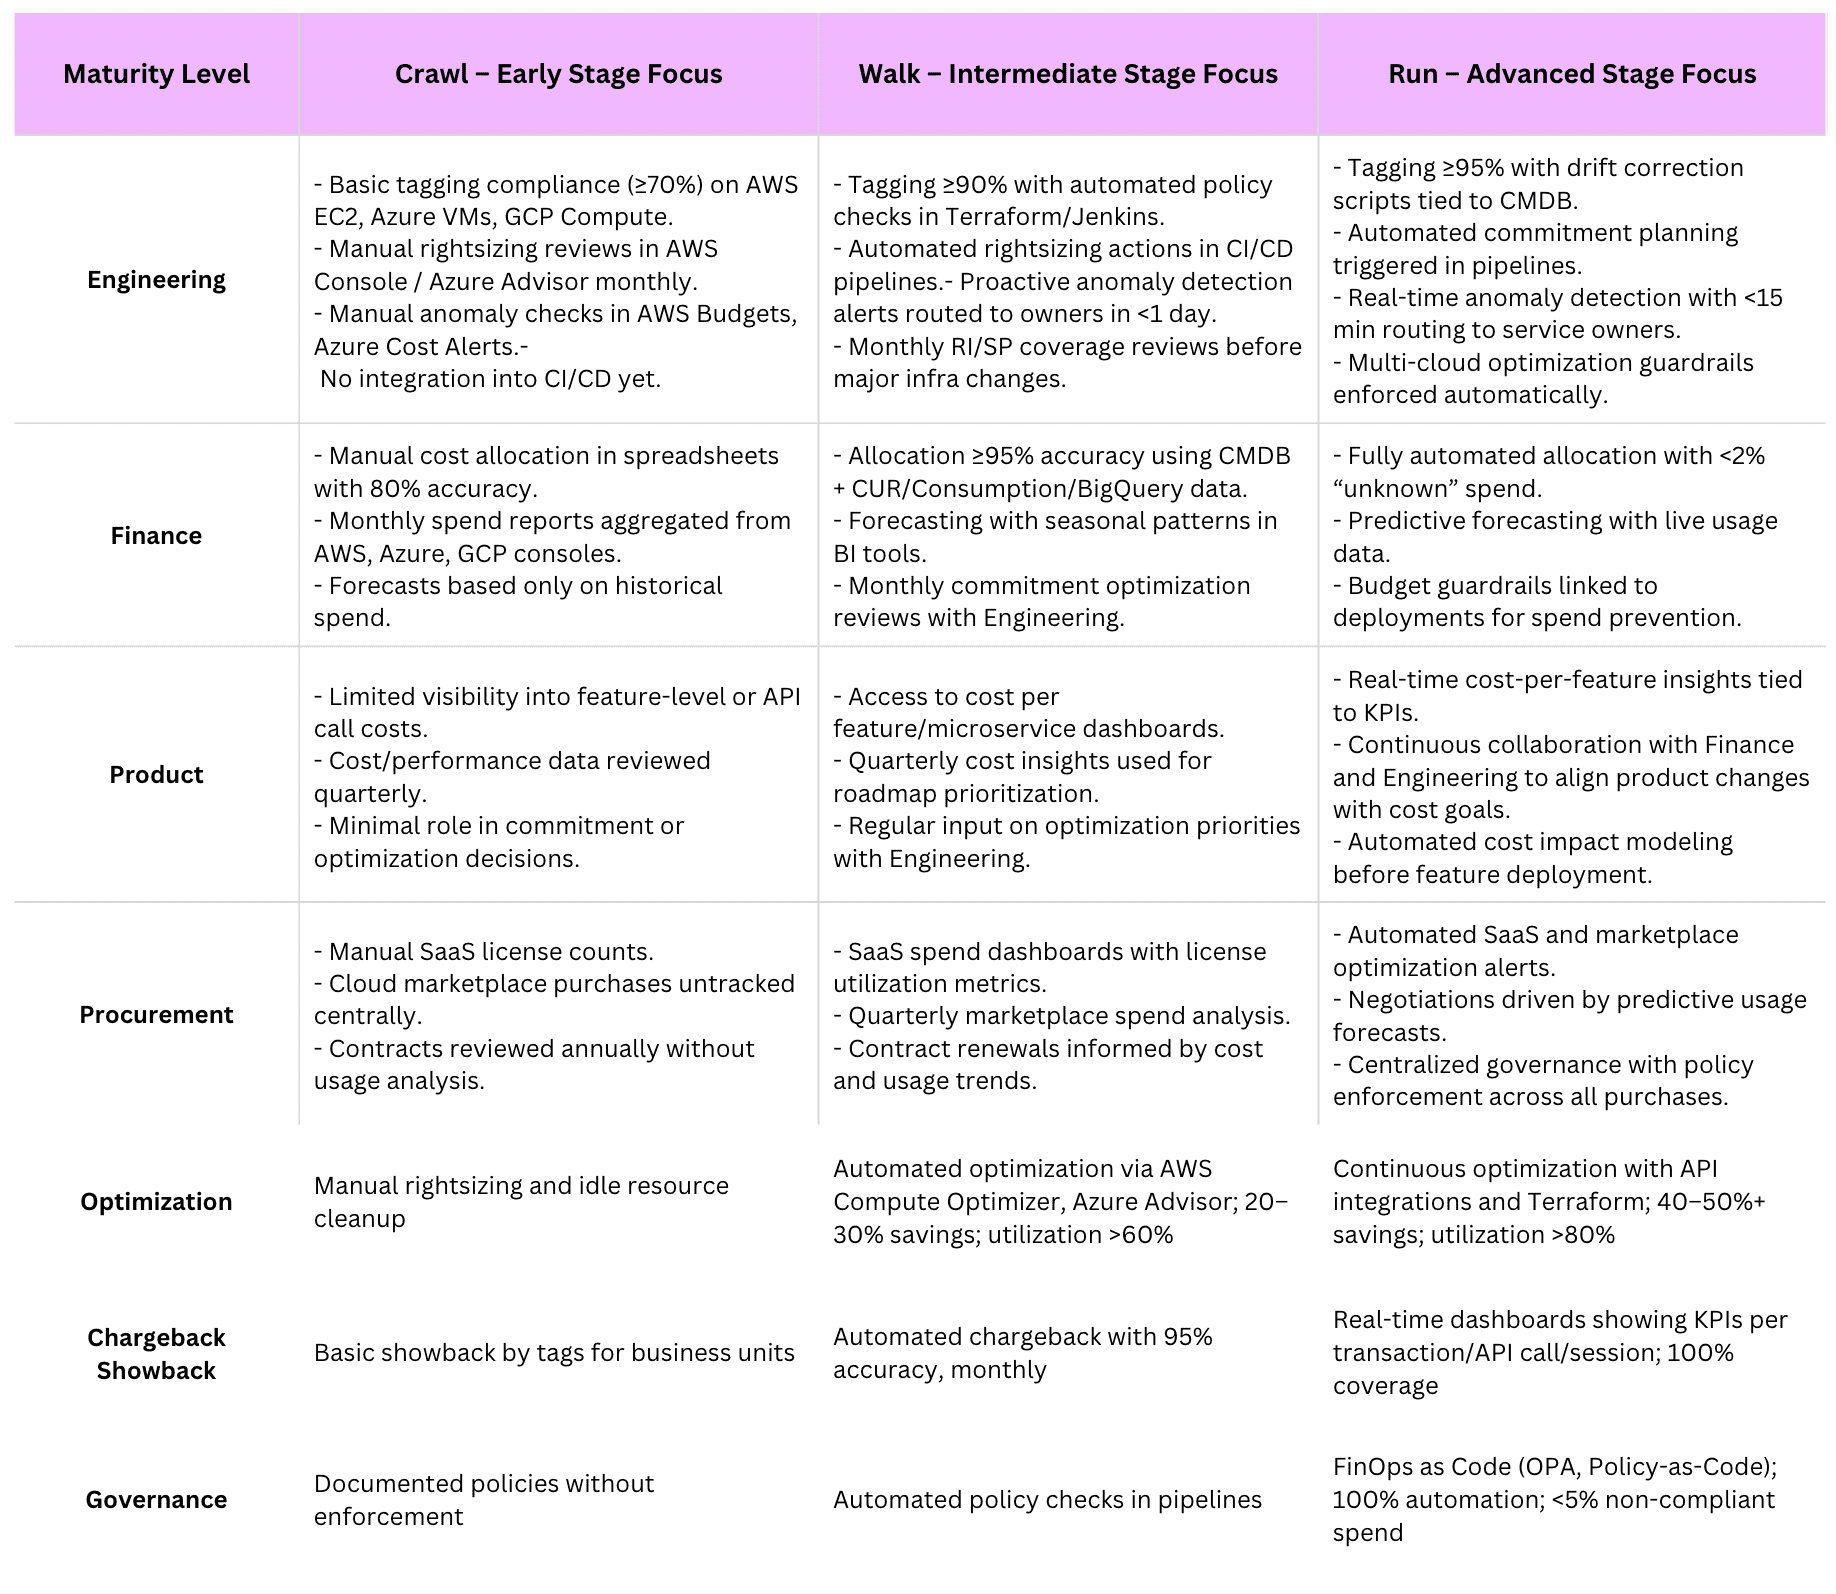
Over the years talking to Cloudaware users, I’ve seen the full spectrum — from teams just getting their arms around AWS, Azure, and GCP spend, to those running fully automated, multi-cloud cost governance at scale. I’ve sat with finance leads chasing down untagged workloads, FinOps team managers wiring anomaly alerts into Slack, and cloud architects who treat cost data like a first-class signal in Terraform and Jenkins pipelines.
Let’s walk through what those journeys actually look like, capability by capability, from Crawl to Run level — with the real FinOps maturity benchmarks I see in the field baked right in.
Crawl capabilities
This is where cloud teams start seeing the map for the first time. The goal is simple: visibility you can trust. That means pulling billing data from AWS Cost Explorer, Azure Cost Management, and GCP Billing into one place so you can tell, with about 95% accuracy, where the money’s going each month.
At this FinOps maturity model stage, tagging governance starts small. You’ll see application__c, environment__c, and owner_email__c applied to maybe 70% of EC2, Azure VM, and GCP Compute resources. That’s enough to run showback reports and split spend by business unit — usually in Cloudaware, native consoles, or even CloudHealth — without resorting to guesswork.
Anomaly detection management is still human-powered: someone skims AWS Budgets alerts or GCP Billing emails for sudden jumps, like S3 storage spiking 20%. The win here? Catching it within 48 hours instead of after the invoice drops, and trimming 10–15% off those one-off overages.
Forecasting is primitive but useful. Most teams run historical compute usage through Excel or a lightweight BI tool, hitting ±20% accuracy for next month’s spend. It’s enough to stop walking blind into quarterly budget reviews.
Walk capabilities
This is where teams stop reacting and start anticipating. Billing data now flows automatically from AWS CUR, Azure Consumption APIs, and GCP BigQuery exports into a central tool like Tableau, Power BI, or Cloudaware dashboards. Daily refresh keeps data 90% current so cost spikes are caught before they burn the budget.
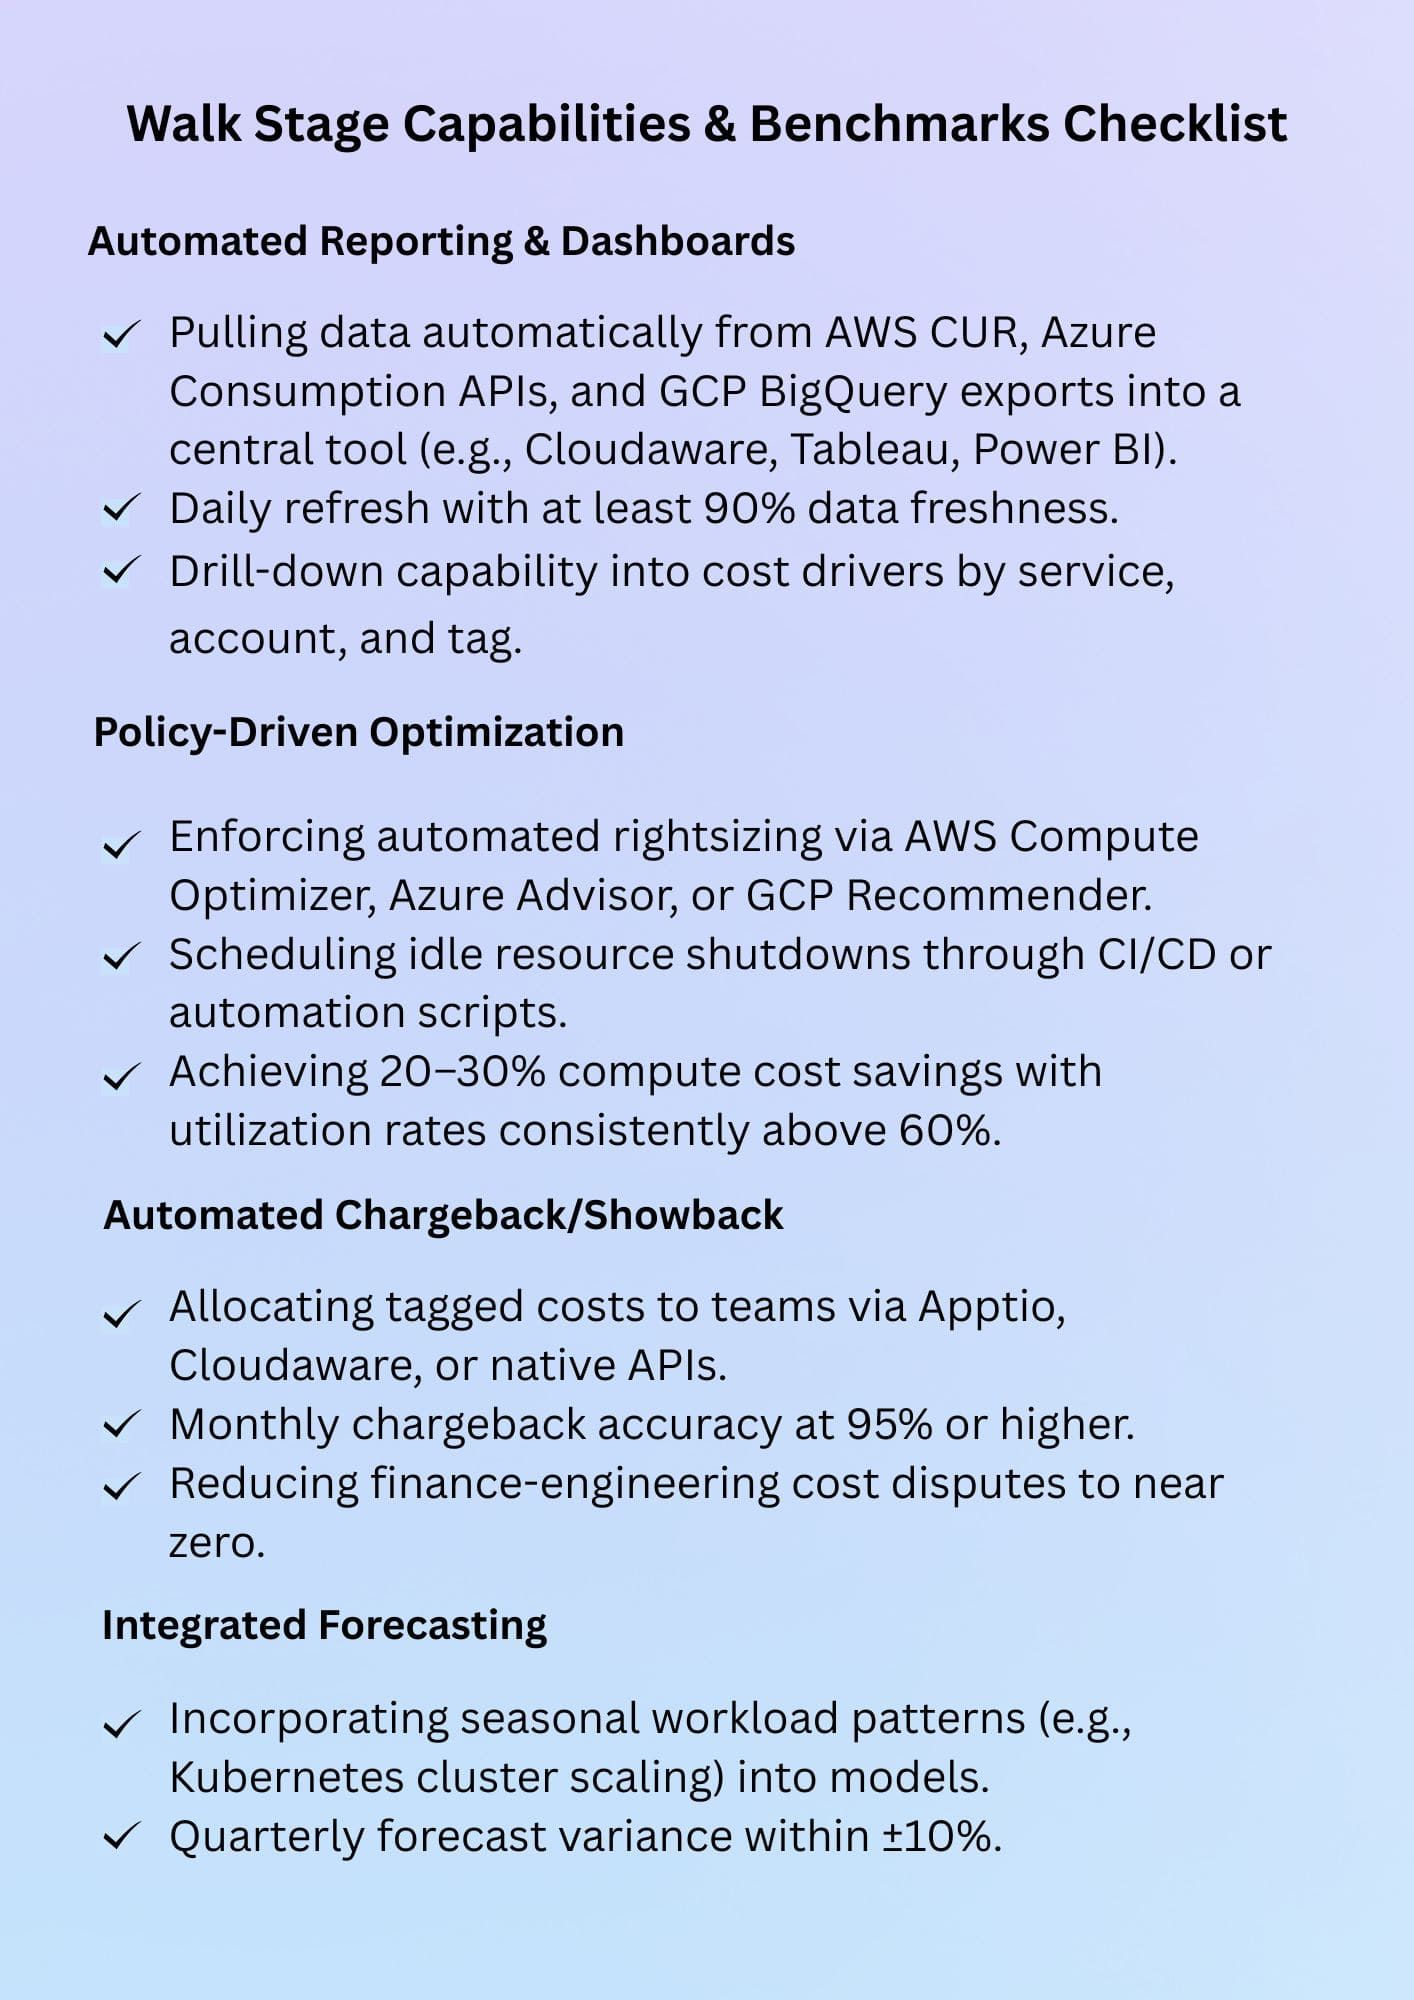
- Tagging compliance climbs past 90%. Enforcement scripts in CI pipelines block untagged deploys, which means cost allocation reports now land in finance’s inbox without missing chunks.
- Optimization starts to move on its own. AWS Compute Optimizer or Azure Advisor rightsizing recs get pushed straight into Terraform modules; idle resource shutdowns happen on schedule. The result? 20–30% savings on compute with utilization rates holding steady above 60%.
- Chargeback becomes a regular rhythm. Tagged data feeds Apptio or native APIs, allocating costs automatically to teams with 95% accuracy — and reducing the monthly finance vs. engineering debates to near zero.
- Forecasting gets smarter. Azure Forecast or Python scripts with Prophet model seasonal spikes in Kubernetes clusters, pulling forecast error down to ±10% on a quarterly horizon.
Run capabilities
Here, cost governance is just part of how the cloud runs.
- Anomaly detection from AWS Cost Anomaly Detection, Azure Monitor, and GCP Monitoring is wired into CI/CD. A spike in API Gateway traffic triggers an alert with the resource, owner, and environment — plus a remediation plan. Teams act in under an hour, cutting waste by 40% or more.
- Rightsizing, reservation purchases, and committed use discounts are handled by automation. APIs in AWS Savings Plans, Azure Reservations, and GCP CUDs run in sync with Terraform to keep coverage above 90%, with utilization over 80% across all clouds.
- Governance is code. Policies in OPA check every pull request, blocking non-compliant deploys and keeping non-policy spend under 5%. Every change is logged, auditable, and linked to a change request.
- Forecasting isn’t a quarterly task — it’s continuous. BigQuery ML or AWS Forecast runs “what-if” simulations before major deployments, with ±5% accuracy. Teams can decide to move a workload from Azure to GCP for $42K annual savings before it ever goes live.
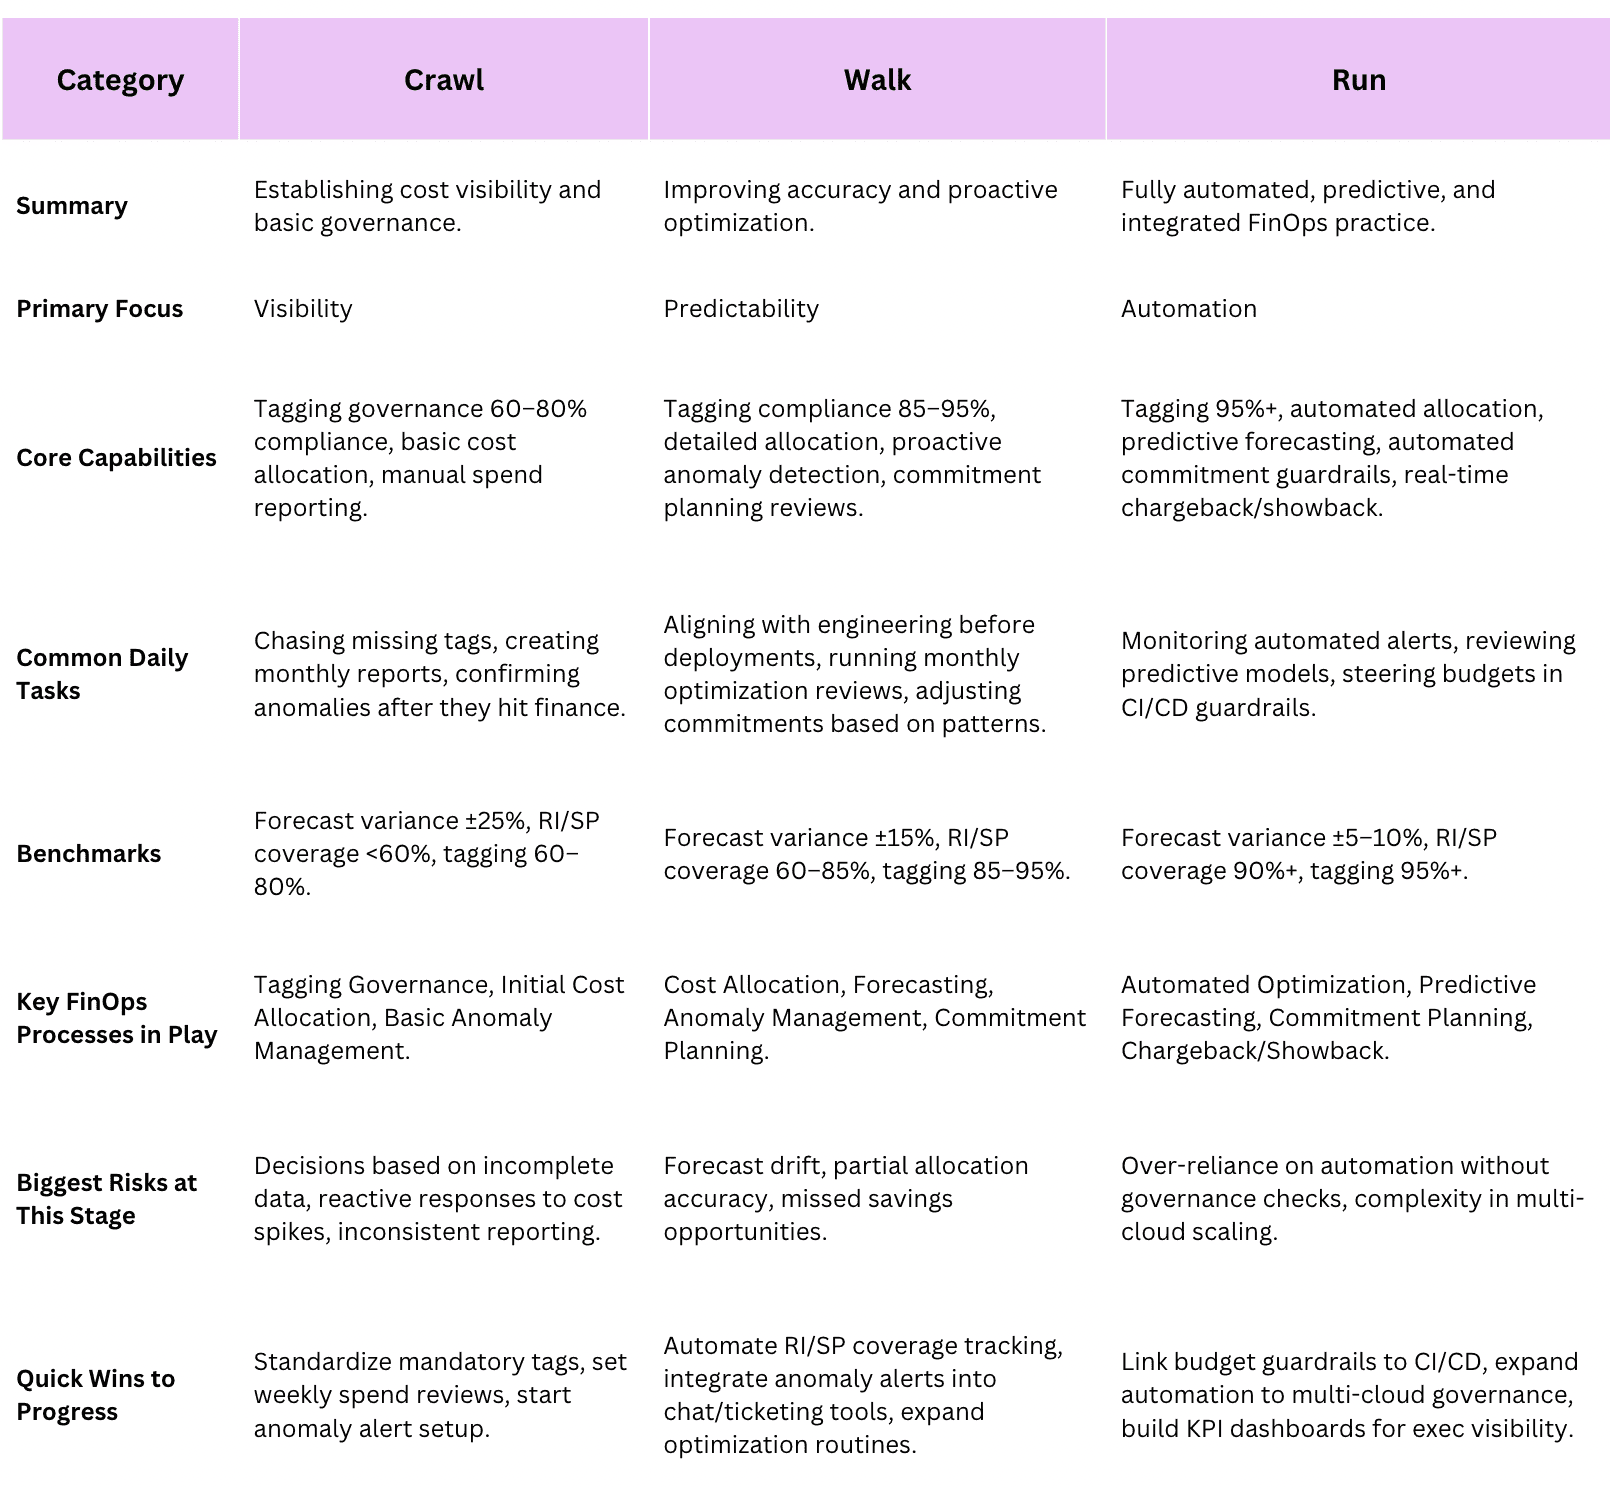
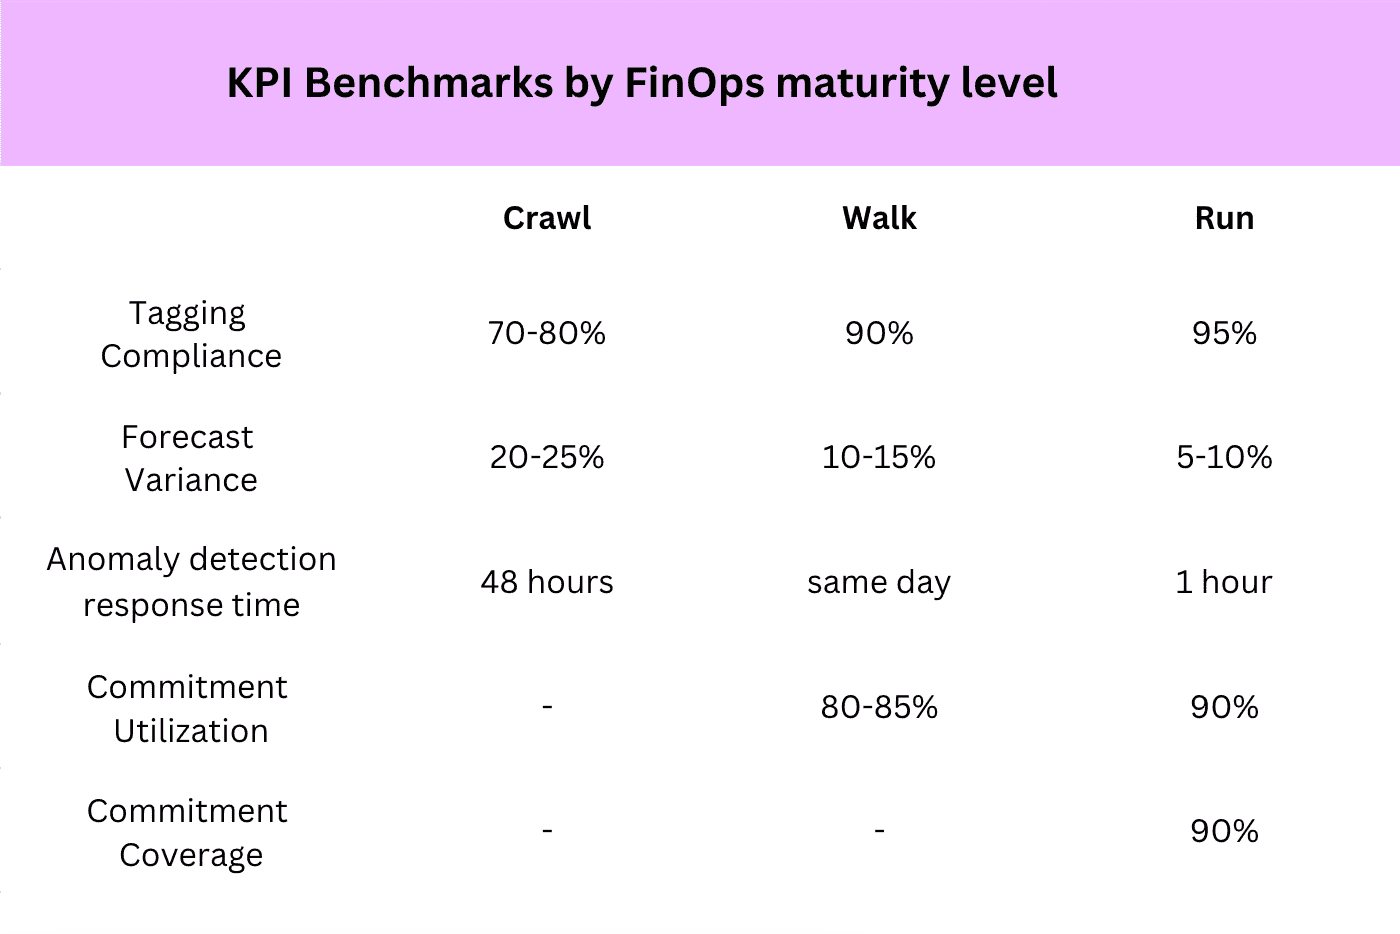
Now let’s visually summarize benchmark evolution across FinOps maturity levels:

When you look at it end-to-end, each level doesn’t just add maturity model capabilities — it tightens the benchmarks that prove you’ve actually matured. The difference between catching a spike in 48 hours and under an hour isn’t just speed — it’s tens of thousands saved, trust earned with finance, and engineering freed from cleanup duty.
Read also: Augmented FinOps: How the Best Teams Scale with Automation
How to assess your current FinOps maturity (with a scorecard)
Before you greenlight the next big automation project or commit to another round of cloud savings plans, you need to know exactly where your FinOps maturity sits today. Skip this step, and you risk over-engineering processes you’re not ready for — or worse, bleeding money on gaps you didn’t see coming.
In the FinOps framework, this is your checkpoint — a reality check before deciding your next move.
Here’s how I walk clients through a maturity assessment when we’re in Cloudaware looking at their AWS CUR, Azure EA, and GCP Billing data all in one view. Think of it as a live diagnostic, not a theory exercise:
- Tagging coverage. Under 80% across EC2, Azure VMs, and GCP Compute? That’s Crawl. Hit 90% with automated CI/CD checks before deploy? You’re in Walk. Lock 95%+ with auto-correction for drift? That’s Run.
→ Impact: Without clean tags, your allocation is noise, and finance won’t trust the numbers. - Forecast variance. ±20% swings month-over-month? Crawl. ±10%? Walk. Hold steady at ±5%? Run.
→ Impact: High variance erodes budget predictability and delays approvals for scaling projects. - Commitment coverage & utilization. Coverage under 70% or utilization below 80%? Crawl. 80–90%? Walk. Sustained 90%+ with utilization over 85%? Run.
→ Impact: Low coverage = missed savings. Low utilization = paying for commitments you’re not using. - Anomaly response time. Days between alert and fix? Crawl. Hours with automated routing to the right owner? Walk. Under an hour with remediation steps auto-suggested? Run.
→ Impact: The slower you act, the more the spike costs you — and the longer your FinOps team spends in cleanup mode.
Once you’ve run through each metric, map them to your FinOps processes — Tagging Governance, Cost Allocation, Anomaly Management, Forecasting, Commitment Planning, Optimization, and Chargeback/Showback. Look for where the processes are lagging in your maturity profile.
A Run-level forecasting model won’t deliver if cost allocation is still manual.
From there, pick one level to move up in the next quarter. Tighten tag compliance before you tackle automated commitment purchasing. Cut anomaly response time before you try predictive spend modeling.
Technical Account Manager Iurii Khokhriakov:
Making the Leap: Moving from Crawl to Walk (and Beyond!)
The shift from Crawl to Walk in the FinOps maturity model starts with one principle: you can’t automate chaos. The foundation you’ve built in Crawl — visibility, baseline tagging, manual anomaly checks — now needs to support faster, repeatable, and more accurate FinOps practices.
And the best way to get there is by upgrading each capability in sequence, with clear thresholds to prove progress in your maturity model.
1️⃣ We start with tightening tag governance.
At Crawl, you may have hit 70% coverage with application__c, environment__c, and owner_email__c tags across AWS EC2, Azure VMs, and GCP Compute.
The Walk goal is 90%+ coverage within 60 days, enforced directly in CI/CD. Set up pipeline rules to block non-compliant resources from deploying.
In Cloudaware, we see teams link these checks to their CMDB so every resource inherits the right metadata from day one.
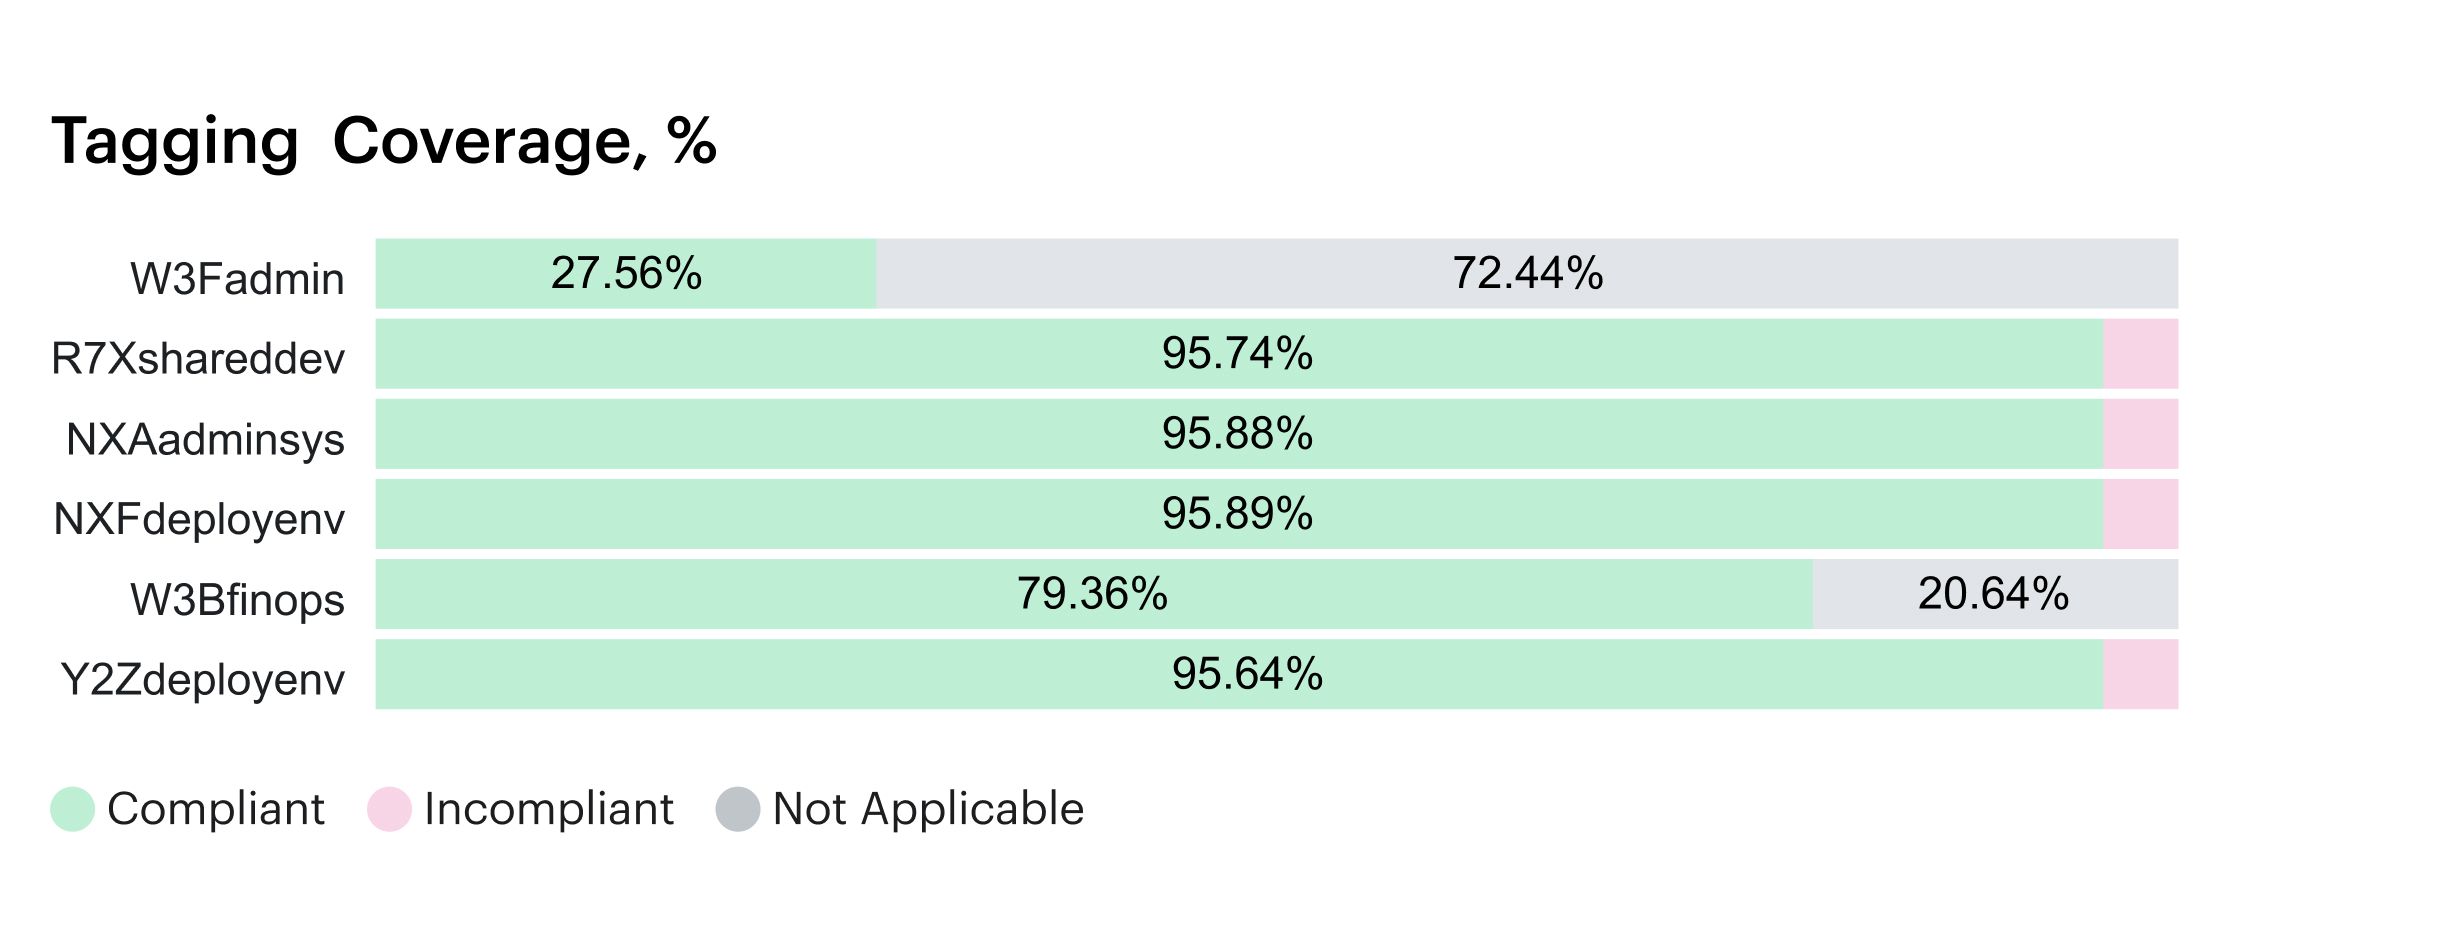
Tagging coverage report in Cloudaware. Schedule a demo to see it live
2️⃣ Once tags are clean and consistent, cost allocation becomes more precise
Move from broad showback by business unit to detailed allocation across applications, environments, and teams.
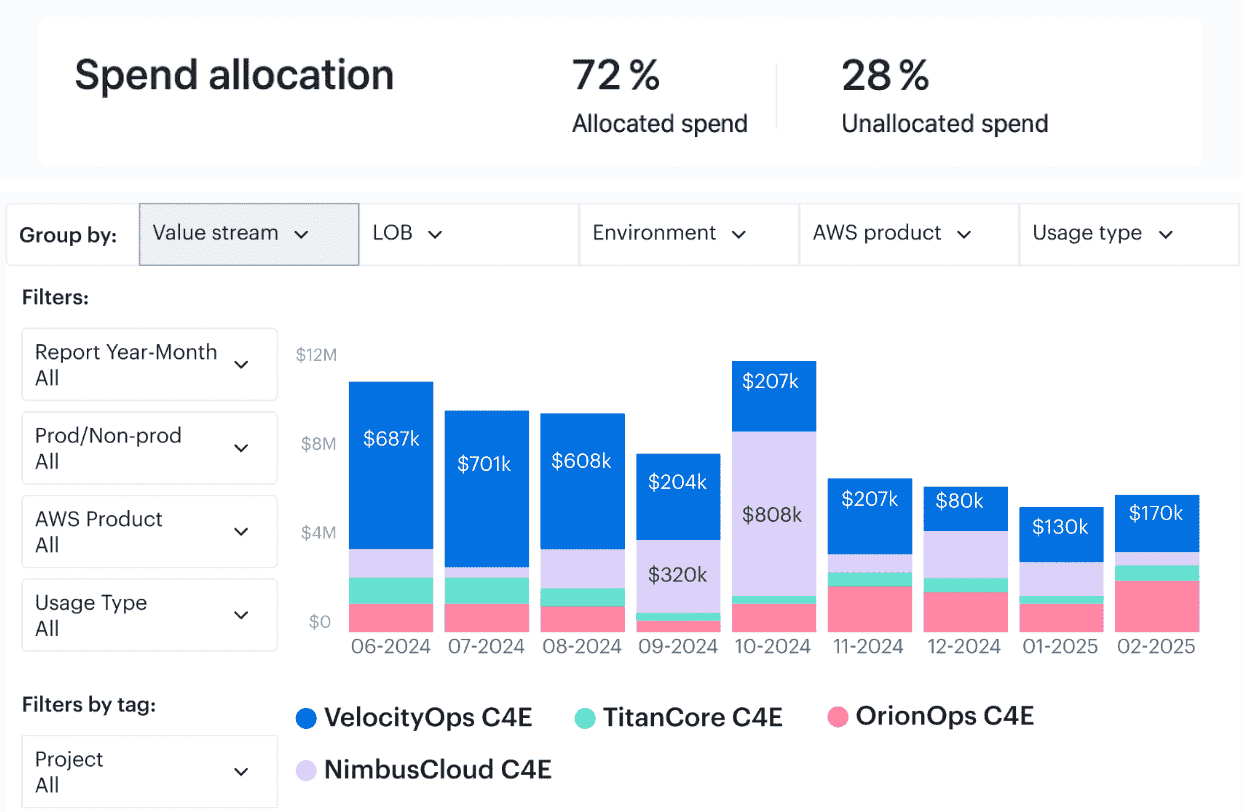
Element of the Cloudaware report of spent allocation history. Schedule a demo to see it live
Your benchmark here: reach 95% allocation accuracy for tagged resources, and integrate allocation reports directly into finance workflows so they land automatically in your finance lead’s hands every month.
Without this, your forecast will always inherit noise from upstream data, making the next maturity level harder to reach.
3️⃣ With allocation solid, it’s time to refine forecasting
At Crawl, you relied on historical averages; in Walk, you blend those with known upcoming changes. Pull in AWS CUR data, Azure Consumption exports, and GCP BigQuery billing feeds, then cross-reference with upcoming projects from Jira or your deployment calendar.
Your target: forecasts with ±10% variance, consistently.
This step builds the foundation for confident commitment planning and drives better optimization.
4️⃣ From here, automate anomaly detection
At Crawl, you might have reviewed AWS Budgets or GCP Billing Budgets every few days. Walk-level means sub–2-hour detection, with cost spike alerts routed directly to the responsible owner via Slack or Teams. Tie these alerts to owner_email__c tags for accuracy.
One of our enterprise clients cut anomaly response from three days to two hours and caught a misconfigured Azure Data Factory job before it burned $18K in cost.
5️⃣ Next is commitment planning
Instead of annual purchases, review RI/SP utilization monthly. Set automated coverage tracking so underutilized commitments are flagged for reallocation before they expire.
Your Walk benchmark: coverage at 80–90% and utilization over 85%. This ensures your processes for commitments are both proactive and sustainable.
Anna, ITAM expert at Cloudaware:
Once these Walk-level processes are reliable and automated, you’re ready to lean into Run territory — where optimization is embedded into infrastructure workflows, commitment purchases are triggered by CI/CD approvals, and chargeback dashboards update in real time for every team in the cloud.
The leap beyond Walk isn’t about doing everything at once; it’s about sequencing upgrades so each capability supports the next. One process, one benchmark, one quarter at a time — and your FinOps maturity will climb without the chaos.
3 real-world stories on how companies leveled up their FinOps maturity
These aren’t just headlines — they’re real stories from Cloudaware clients, showing exactly how teams applied the FinOps maturity model step-by-step, and what changed when they leveled up.
Each one is here to inspire you with the processes, benchmarks, and decisions that drove measurable results.
Coca-Cola — From Late Crawl to Early Walk in Forecasting & Allocation
When Coca-Cola first stepped into Cloudaware, they had visibility locked in billing data were all feeding into monthly reports.
But those forecasts? Spreadsheet-bound, built in isolation by finance, and almost always out of sync with what engineering was about to ship.
They started by enforcing tagging governance — application__c, environment__c, and owner_email__c — across AWS EC2, Azure VMs, and GCP Compute at create time. An AWS Config rule flagged non-compliance, and a Lambda script auto-corrected tags based on CMDB metadata.
That single control pushed tagging compliance to 92%, which meant their allocation model could finally break the 95% accuracy mark. With clean allocation data, they pulled in AWS CUR, Azure Consumption exports, and GCP BigQuery billing feeds, cross-referencing them with Jira deployment schedules to factor in planned workload changes.
Within two quarters, forecast variance dropped from ±20% to ±8%. With accuracy in hand, they shifted commitment planning from annual bulk buys to monthly RI/SP reviews — raising utilization from 75% to 88% without overbuying.
Caterpillar — Walk to Run in Anomaly Detection & Commitment Planning
Caterpillar had Walk-level strength in allocation and forecasting but still treated anomaly detection like a manual audit. A misconfigured Azure Data Factory job once burned three days and nearly $20K before anyone caught it.
The move to Run began with automating anomaly routing. Azure Event Grid now sends cost alerts from Cost Management straight to the right owner_email__c in Teams, mapped from CMDB data. The same integration pulls from AWS Cost Anomaly Detection and GCP Billing Budgets for cross-cloud coverage.
With that in place, detection time dropped to under five minutes, and response time to same-day fixes. Commitment planning also moved up a notch: monthly RI/SP coverage checks now run in the pipeline.
If a planned EC2 instance family change impacts coverage, the system models the cost impact and routes it for approval before deployment.
Coverage stabilized above 90%, utilization climbed past 87%, and overcommitment dropped to near zero.
ServiceChannel — Crawl to Walk in Tag Governance & Allocation
ServiceChannel’s bottleneck was tagging. AWS EC2, Azure App Services, and GCP Compute all had partial coverage, but no enforcement. Tag compliance hovered around 65%, which meant allocation reports had too many “unknown” lines to trust in forecasting or chargeback.
They tackled it in sequence:
- Added pre-deploy checks in Azure DevOps and Jenkins to block non-compliant builds.
- Synced CMDB metadata so new resources inherited application__c, environment__c, and owner_email__c automatically.
- Built a daily Cloudaware compliance dashboard by BusinessUnit to track drift and gap owners.
In one quarter, tag compliance jumped to 94%. That accuracy flowed directly into their allocation capabilities, enabling showback down to microservices. With teams now seeing their spend broken out accurately, they began making their own optimization calls — shutting down idle dev environments and rightsizing without waiting for monthly reviews.
Forecast variance followed, dropping to ±9%, and commitment planning finally had the data foundation to run monthly without disputes.
5 must-track KPIs and metrics to track at each level
We’ve talked about stages, capabilities, and real-world wins — but at some point, you have to decide how you’ll prove you’re moving forward. That’s where the right KPIs come in. Not the vanity numbers, but the ones that actually shift business value and tell your team whether you’re getting a return on the time and tools you’ve invested.
At Crawl, the focus is on the foundation.
- Tagging Compliance % – Without reliable metadata, you can’t trust any allocation. Pull it from AWS Config, Azure Policy compliance data, and GCP Resource Manager. At this maturity stage, 70–80% compliance is realistic.
- Forecast Variance – The gap between projected and actual spend. Use AWS Budgets, Azure Cost Management forecasts, or GCP Billing export to BigQuery. ±20–25% is common early on.
- Anomaly Detection Response Time – How fast you act on unexpected cloud spend spikes. Even a 48-hour turnaround can prevent thousands in waste when you’re still building automation.
By Walk, you’ve got cleaner data and tighter routines, so your KPIs shift toward efficiency.
- Allocation Accuracy – Spend mapped to the right business unit, service, or product. Pull this from your allocation model in Cloudaware, fueled by tagging >90% and CMDB alignment. Aim for 95%+ here.
- Commitment Utilization – Actual usage of your RIs or Savings Plans versus what you’ve committed to. AWS Cost Explorer, Azure Reservation reports, and GCP Committed Use analysis are your go-to tools. You want 80–85% as the sweet spot.
- Anomaly Detection Response Time – Drops to same-day or faster because alerts are routed to the right owner_email__c automatically.
At Run, the KPIs are about optimization and scaling without losing control.
- Forecast Variance – Holding at ±5–10%, factoring in CI/CD-driven deployment changes and seasonal workload shifts.
- Commitment Coverage – Staying above 90% across AWS, Azure, and GCP without overcommitting.
- Automation Effectiveness – Measuring the % of cost-saving actions executed automatically — rightsizing, idle shutdowns, RI/SP adjustments — without manual intervention.
- Cost per Transaction / API Call / User Session – The metric that ties FinOps spend directly to business KPIs. Pulled from your Cloudaware allocation data joined with product analytics.
When you’re deciding what to track, the KPI list shouldn’t live in a spreadsheet someone updates once a quarter,” one of our enterprise leads in FinOps maturity model projects told me. “It has to be wired into your dashboards, so the management sees progress — or drift — in real time.
FinOps Scopes and Personas: Tailoring Maturity Goals
By the time you start looking at FinOps maturity through the lens of scopes and personas, you’ve already got a baseline. But here’s where the real nuance kicks in — maturity isn’t a single number stamped across your entire program.
In AWS, you might be running automated RI/SP guardrails, anomaly alerts in under five minutes, and 95%+ tagging compliance on EC2, RDS, and Lambda. Over in SaaS, the same FinOps teams might still be manually chasing license counts in spreadsheets once a month.
That’s not a failure — it’s a reflection of different lifecycle stages for different scopes.
We see it all the time. A client running Kubernetes clusters on GCP Compute Engine had capabilities for rightsizing pods down to the CPU request level, but their AI workloads in Vertex AI were still billed on broad monthly consumption without predictive forecasting.
The takeaway? Your maturity level for one scope doesn’t automatically pull the rest with it.
Personas layer onto this.
- Finance may already have cost allocation model locked at 95% accuracy because they’re pulling from CMDB and tagged AWS CUR, Azure Consumption exports, and GCP BigQuery billing feeds.
- Engineering might still be at Walk in commitment planning — reviewing EC2 family coverage monthly but not yet integrating those checks into Terraform or Jenkins pipelines.
- Product might only get cost per API call surfaced quarterly, meaning their optimization decisions lag behind.
- Procurement may have Run-level governance on SaaS contracts but Crawl-level visibility on cloud marketplace purchases.
When you map FinOps per persona and per scope, patterns emerge:
- Engineering in AWS could be Run for automation but Walk for anomaly routing in Azure.
- Finance might lead in allocation and forecasting across all clouds, but not yet factor in AI training costs.
- Product teams could be Walk for cost-per-feature metrics, but Crawl for incorporating those into roadmap prioritization.
The goal isn’t to force every scope and persona to the same finish line at the same time. It’s to set targets based on value and risk. If AWS EC2 costs are 70% of your bill, getting that scope to Run in anomaly detection, forecasting, and commitment coverage will have a bigger management impact than pushing a low-spend SaaS app to the same maturity.
How Cloudaware helps you level up in the FinOps maturity model
If you’re serious about moving up your FinOps maturity level, you need tooling that doesn’t just track spend, but actively shapes how your FinOps processes run in your environment. That’s where Cloudaware comes in.
Cloudaware integrates directly with all five major cloud providers — AWS, Azure, GCP, OCI, Alibaba and VMware — pulling in rich cost and configuration data without installing a single agent. The setup is real time and agentless, so you can start seeing your maturity gaps the same day you connect.
It’s built for the realities of multi-cloud cost management: multiple accounts, hundreds of services, and stakeholders who need accurate allocation, not just total bills.
Features:
- Tagging Governance Dashboards – Track and improve tag compliance (application__c, environment__c, owner_email__c) across AWS, Azure, and GCP.
- Cross-Cloud Cost Allocation – Allocate spend by business unit, product, or environment with scope-level accuracy scoring.
- RI/SP Utilization Tracking – Monitor Reserved Instances and Savings Plans coverage and utilization across AWS, Azure Reservations, and GCP CUDs.
- Automated Anomaly Detection – Detect and route spend anomalies daily using CMDB ownership mapping.
- Blended vs. Unblended Spend Reporting – Analyze cost by pricing model to optimize purchasing strategies.
- Forecasting with Live Deployment Context – Factor in Jira-linked deployment schedules for more accurate predictions.
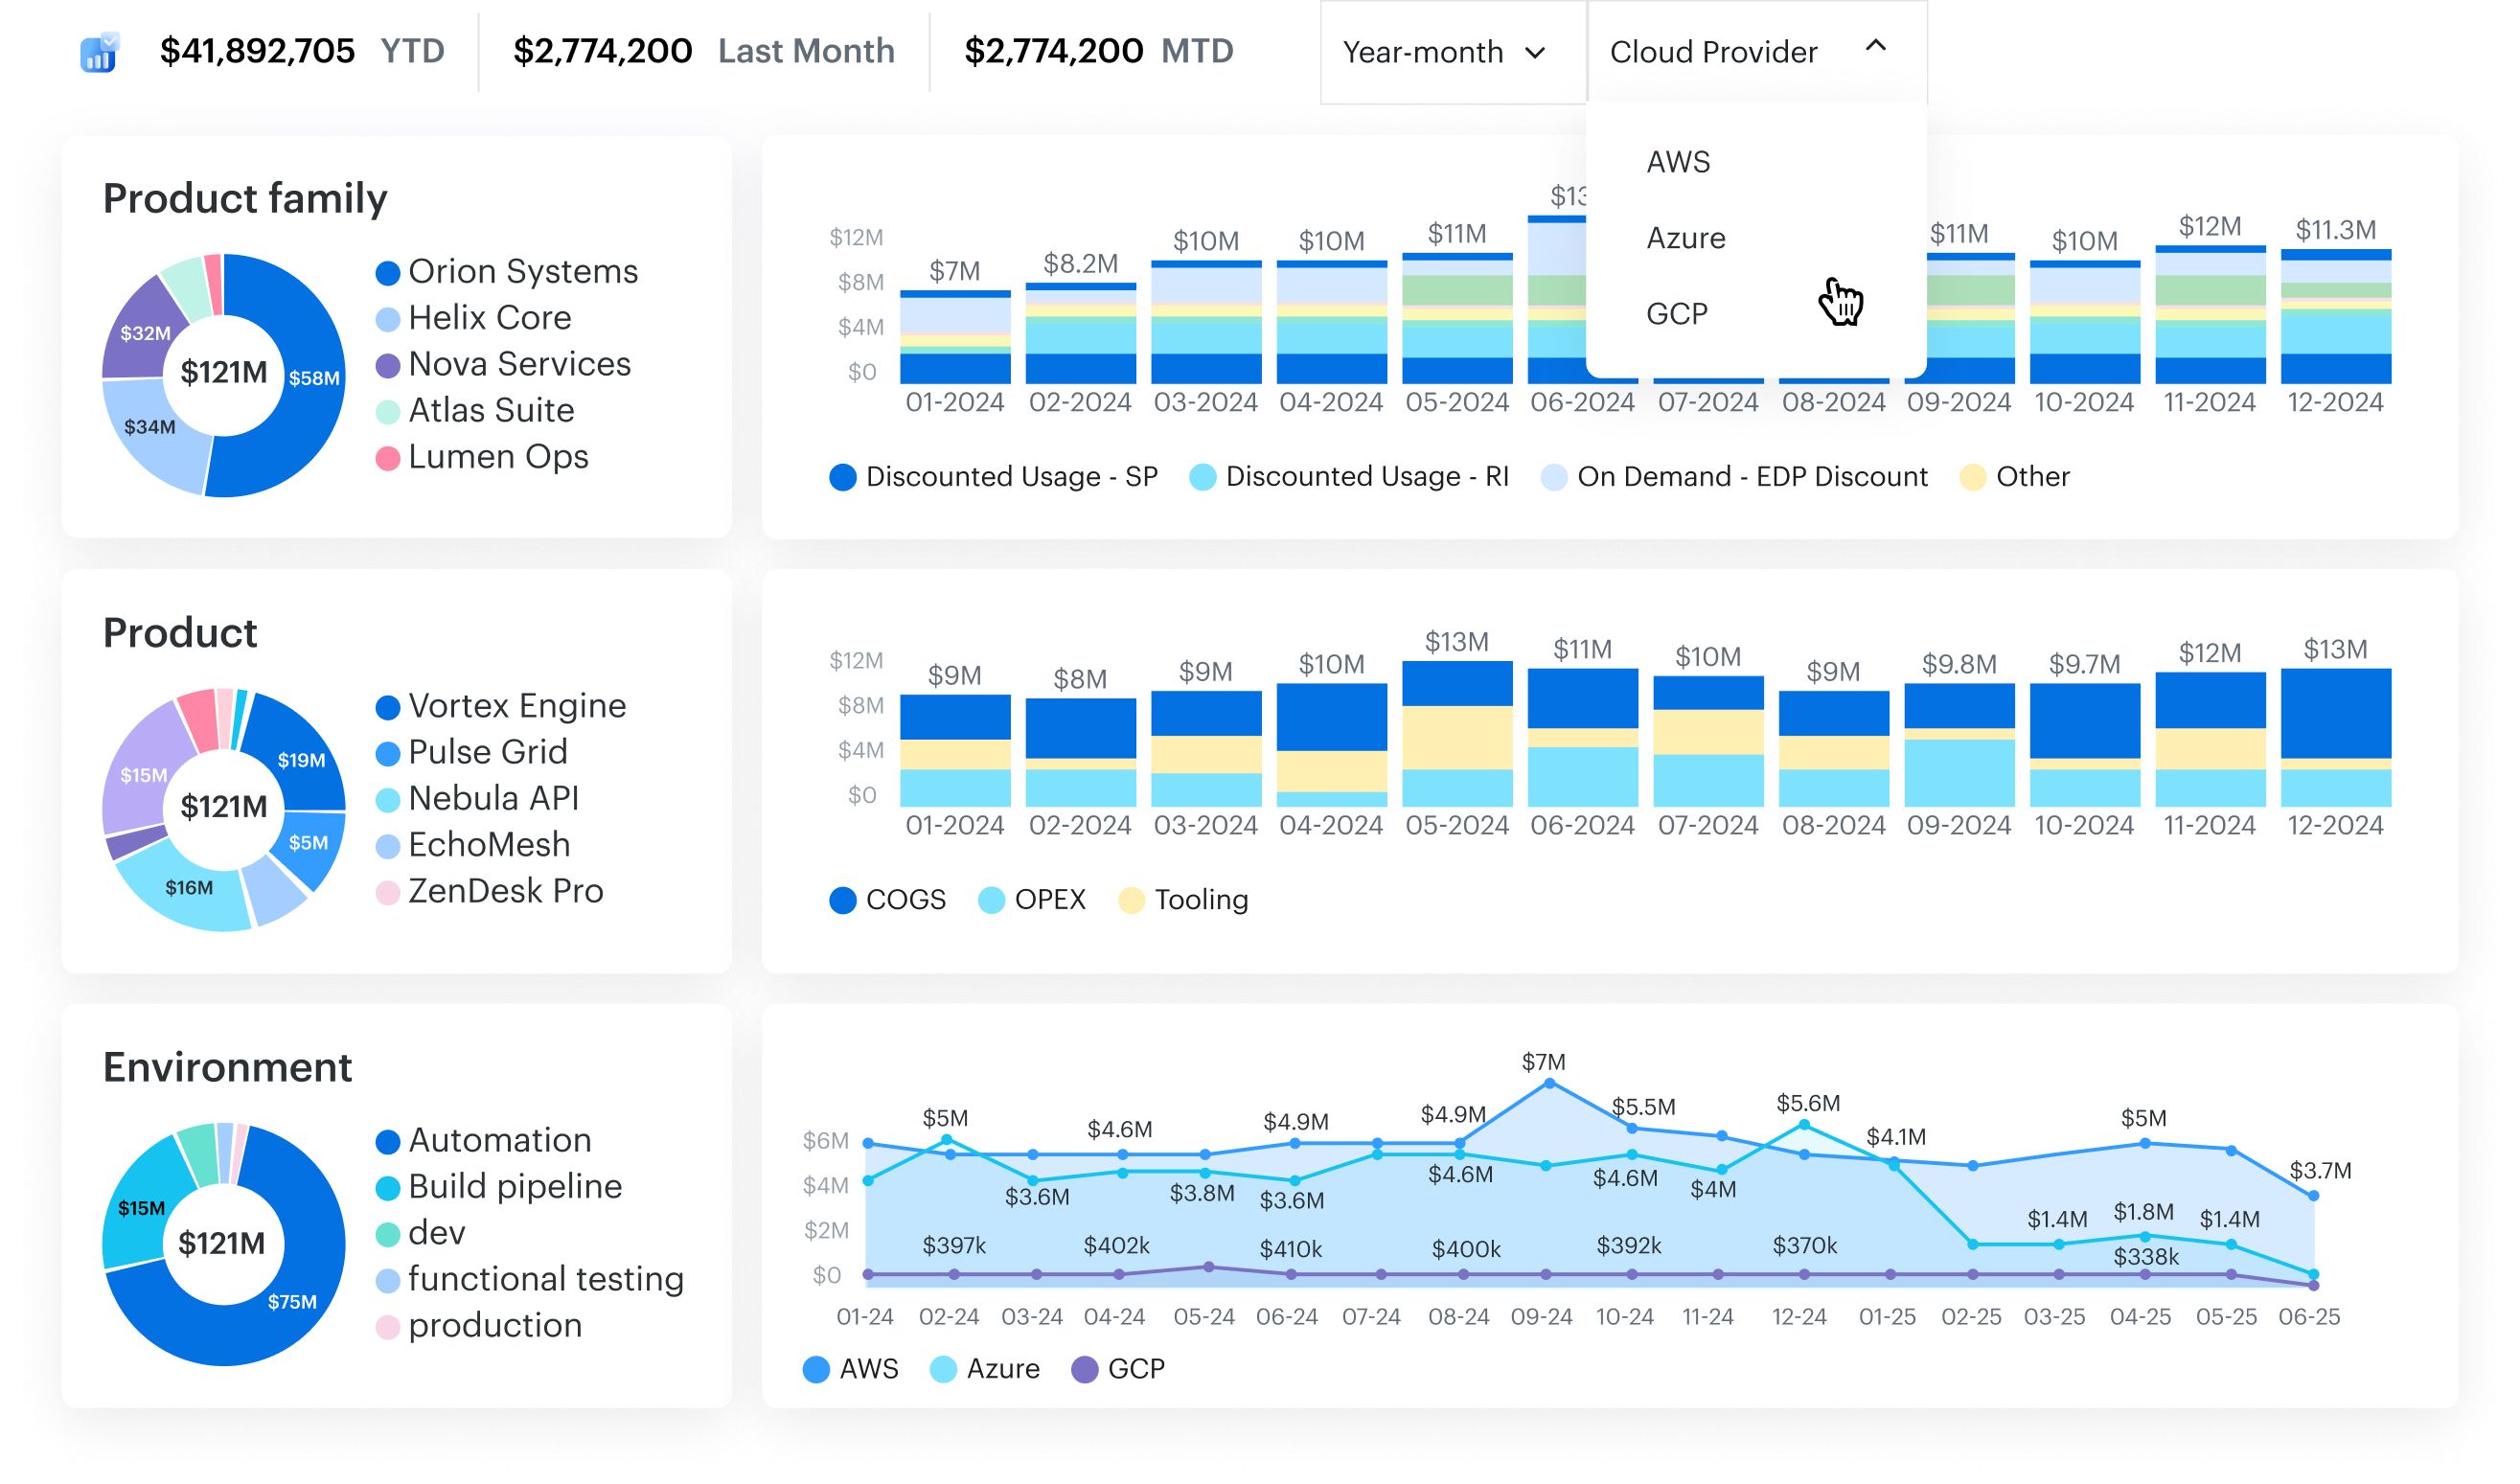
- Scope-Level KPI Dashboards – See forecast variance, allocation accuracy, and coverage benchmarks for each cloud scope in one view.
Cloudaware doesn’t just show you where you are — it accelerates the climb to your next maturity stage. Whether you’re still building visibility or fine-tuning automation, every capability in the platform ties directly to a measurable maturity outcome.