
FinOps transformation case study
How Cloudaware helped a global logistics software provider save $131K monthly and reduce cloud cost anomaly detection from 20 days to 24 hours
1. About The Company
The Company is a global provider of logistics and supply chain software solutions, delivering mission-critical technology that powers complex delivery networks and global trade. Managing a high-velocity and rapidly scaling cloud infrastructure, the Company faced the challenge of maintaining granular financial control while supporting fast-paced engineering innovation.
As their cloud footprint expanded to meet the demands of modern supply chain management, it became essential to bridge the gap between technical operations and financial objectives. To achieve this, the Company decided to mature its FinOps practice, focusing on precise cost allocation, real-time anomaly detection, and budget predictability. The goal was to implement a robust FinOps framework that aligns cloud consumption with business value, ensuring that every infrastructure investment directly supports the efficiency and reliability of their logistics solutions.
2. Challenges
Despite having basic cloud visibility, the Company faced significant hurdles in maximizing the business value of its cloud investment. As technical scaling accelerated, the following operational gaps became critical:
Low Effective Savings Rate (ESR) & Manual Commitment Management
The Company heavily relied on "On-Demand" pricing, resulting in a low Effective Savings Rate. There was no automated system to track the coverage and utilization of Reserved Instances (RI) or Savings Plans (SP). Procurement teams feared over-committing to long-term contracts due to the high volatility of engineering workloads, leading to missed savings opportunities.
Reactive Anomaly Detection
Cost management was purely retrospective. Engineering and Finance teams often discovered significant cost spikes—caused by misconfigured services or inefficient code—only when the monthly bill arrived. This lack of real-time detection led to "billing shocks" and unrecoverable budget leaks.
Fragmented and Inaccurate Forecasting
The absence of integrated historical data and business growth drivers made it impossible to produce reliable forecasts. Budget variance remained high, as teams struggled to account for seasonal traffic peaks or the cost impact of new product launches, leading to friction during quarterly financial reviews.
No Adequate Shared Cost Distribution
The Company struggled to fairly allocate "Shared Costs," such as Enterprise Support fees and shared Kubernetes clusters. These expenses were typically dumped into a "General IT" bucket, distorting the true profitability of individual business units and preventing accurate product-level unit economics.
3. Solutions & Implementation
Optimizing Commitment Strategy through Data-Driven Analytics
To address the low Effective Savings Rate (ESR), CloudAware deployed its Commitment Recommendation Dashboards, which automatically analyzed the Company’s historical consumption patterns to distinguish stable "baseline" usage from volatile peaks. By providing real-time visibility into Coverage and Utilization metrics across all cloud accounts, the platform eliminated the manual effort of tracking RIs and Savings Plans in spreadsheets. These visual insights effectively mitigated the fear of over-commitment by clearly highlighting low-risk purchase opportunities and identifying where current commitments were underperforming. This shift to transparent, data-backed visibility gave the team the confidence to move away from expensive On-Demand pricing, ensuring maximum savings while maintaining the operational flexibility needed for the Company's dynamic engineering workloads.
Accelerating Incident Response with Automated Outlier Detection
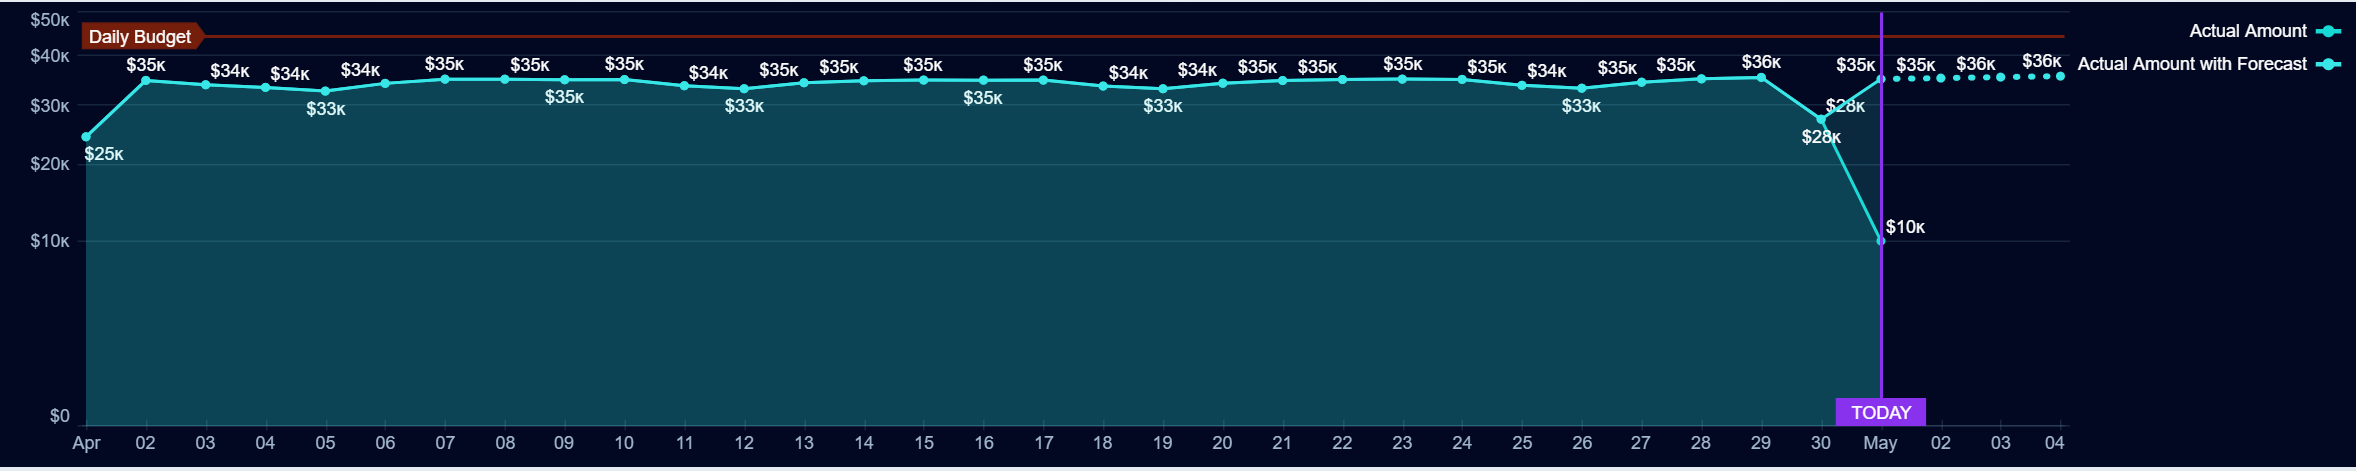
To address the issue of late-stage cost discovery, CloudAware introduced an automated Anomaly Detection Dashboard that fundamentally changes how the Company identifies irregular spending patterns. By shifting from a 30-day retrospective billing cycle to daily granular visibility, the platform significantly reduces the time-to-discovery for financial deviations. The engine automatically analyzes consumption patterns and flags statistical outliers, allowing teams to distinguish between legitimate business scaling and waste. Instead of discovering a misconfiguration weeks later, engineers are now alerted to budget drifts within 24 hours. This transformation enables the Company to investigate and mitigate root causes, such as runaway processes or inefficient deployments almost immediately, ensuring that minor technical errors are resolved before they lead to significant budget overruns.
Improving Forecasting with Data-Driven Projections
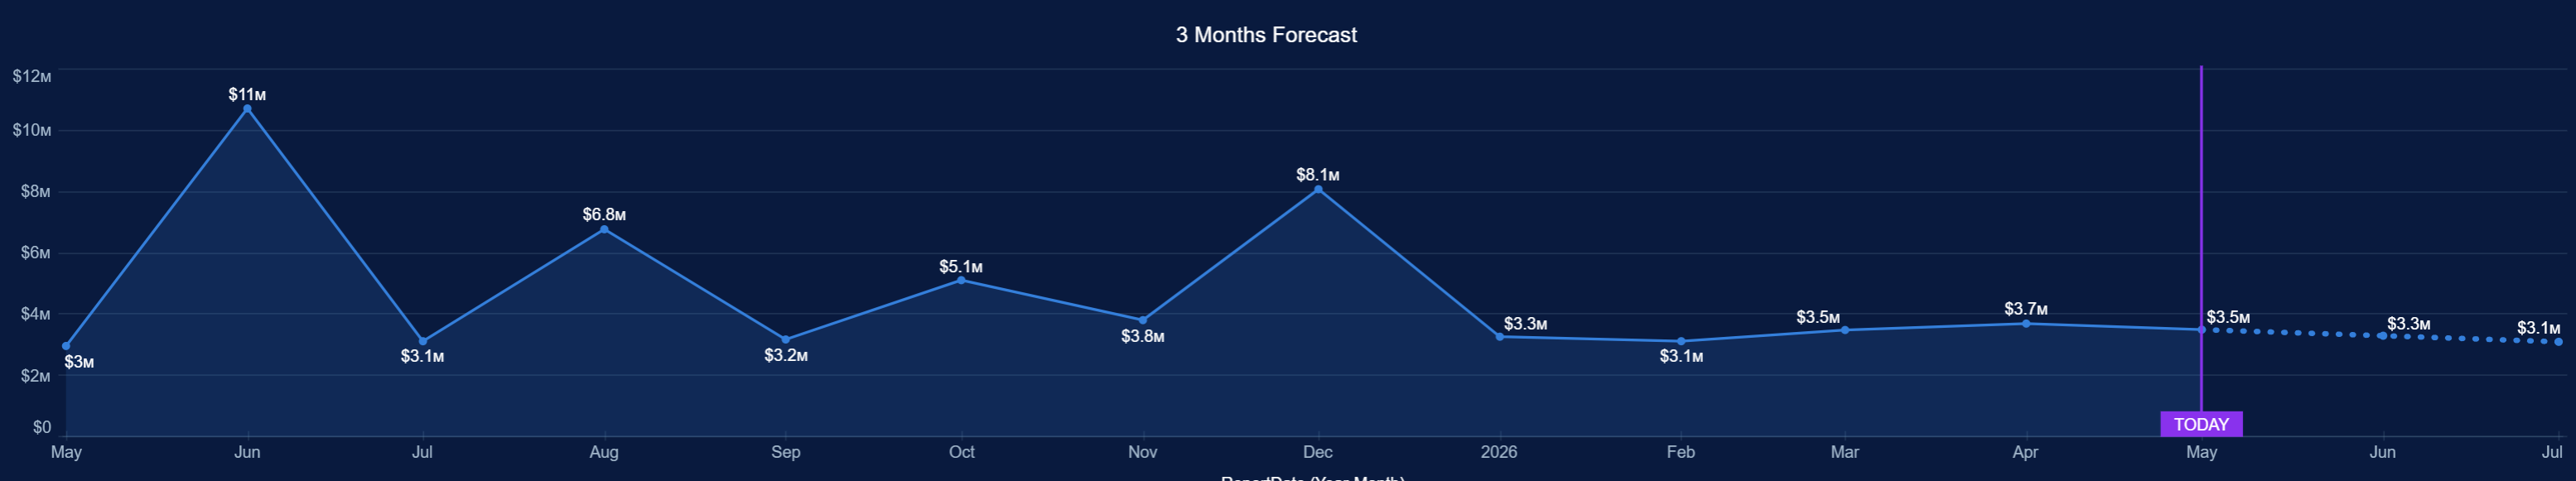
To eliminate inaccurate estimations, CloudAware leverages historical spend data and automated trend analysis to provide reliable Financial Forecasting. By centralizing multi-cloud expenditure and breaking it down at the product and department level, the platform enables the Company to move beyond manual spreadsheets and "best-guess" projections. This granular visibility allows stakeholders to account for seasonal variations and planned technical expansions with much higher precision. As a result, the Company has successfully reduced the gap between planned budgets and actual spend, ensuring that cloud investments remain synchronized with business objectives.
Establishing Fair and Transparent Cost Allocation & Showbacks
To achieve full financial transparency, CloudAware implemented a two-tier allocation strategy. First, direct expenditures were accurately assigned using billing tags mapped to specific projects and departments. Second, for expenses that cannot be tagged directly, such as Enterprise Support fees and shared platform services, CloudAware enabled a dynamic, rules-based method that automatically redistributes these costs proportionally based on each business unit’s actual infrastructure footprint.
By moving away from estimated or static percentage-based splits in favor of data-driven, consumption-based distribution, the platform provides a "true" total cost of ownership for every project and department. This level of granularity ensures that shared expenses are no longer a financial mystery, instead, they are transparently accounted for, allowing department heads to take full responsibility for their entire operational footprint and enabling the Company to calculate accurate product margins for the first time.
Furthermore, this structured data has simplified the generation of Showback reports, making them a seamless part of the monthly operational cycle. The ability to present clear, defensible cost data to stakeholders has significantly increased accountability and awareness across the organization. By providing a "single source of truth," CloudAware has effectively bridged the gap between Finance and Engineering, fostering a collaborative environment where both teams share a common language regarding cloud value and architectural efficiency.
5. Results
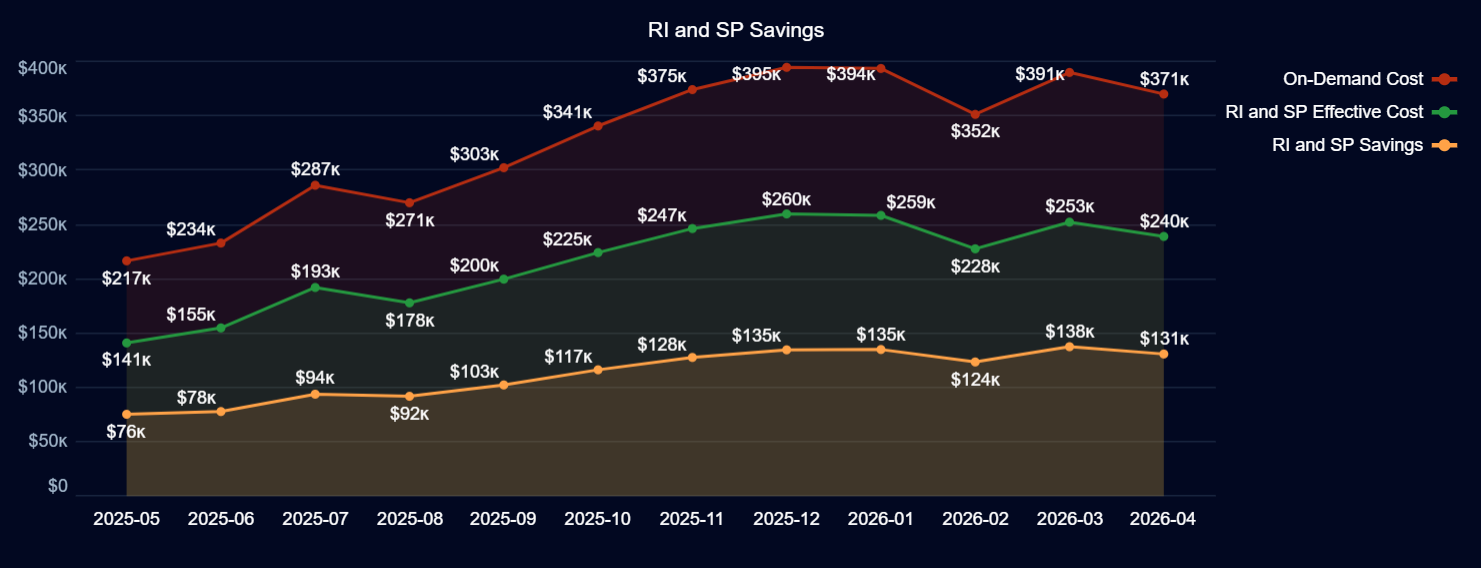
The commitment strategy implemented via CloudAware proved its effectiveness even as the Company’s cloud footprint expanded. In May 2025, while the equivalent On-Demand cost stood at $217K, the Effective Cost was reduced to $141K through optimized commitments. By April 2026, as the infrastructure scaled, the On-Demand equivalent rose to $371K, yet the actual Effective Cost was maintained at $240K. This demonstrates that the rate optimization engine successfully scaled alongside business growth, delivering $131K in monthly savings by the end of the reporting period and ensuring that the increased cloud usage did not translate into proportional cost increases.
By transitioning from a 30-day retrospective billing cycle to automated daily monitoring, the Company significantly accelerated its response to irregular spending. The time to detect and investigate cost outliers was reduced from an average of 20 days to 1-2 days. This proactive posture allowed Engineering teams to immediately rectify misconfigured services or runaway processes, preventing minor technical errors from evolving into unrecoverable financial losses and ensuring budget stability throughout the month.
The shift to data-driven forecasting enabled the Company to achieve a significant reduction in budget variance through the leverage of historical trend analysis and granular application-level visibility provided by CloudAware. This improved accuracy has fundamentally streamlined the quarterly review process, making financial reconciliations significantly faster and more intuitive for both Finance and Engineering teams. By reducing the time and effort previously spent on manual data verification and addressing discrepancies, the organization has gained the financial predictability required for long-term strategic planning and more aggressive business scaling.
The implementation of a consumption-based allocation method for shared expenses has resulted in 100% of the cloud budget—including previously unassigned Enterprise Support fees—being accurately distributed across business units. By eliminating the "general IT bucket," the organization achieved a true total cost of ownership for every product, fostering a culture of complete financial accountability. With clear showback reports now integrated into the monthly operational cycle, department heads have a transparent view of their full operational footprint, ensuring that shared costs are no longer a financial mystery and allowing every dollar spent to be directly linked to specific business value.
6. Conclusion
Closing this first FinOps loop was a transformative milestone for the Company. It wasn't just a one-time cost-cutting exercise, but a fundamental shift in how Engineering and Finance work together. By moving from the partial transparency of the Inform phase to the disciplined Optimization of their $371K monthly spend, and finally to a proactive Operate model with daily anomaly checks, the team has successfully completed its first full lap of the FinOps lifecycle.
This journey has evolved the Company’s maturity from a manual 'Crawl' stage into a confident, data-driven 'Walk.' The proof of this success isn't just in the significant annual savings or the vastly improved Effective Savings Rate; it’s in the fact that department heads now take full ownership of their 'Showback' reports and finally understand the true cost of their shared services.
However, in FinOps, the work is never "finished." This first successful cycle has simply provided the clean data and internal trust needed to start the next, more ambitious loop. As the Company continues to scale, the focus will shift toward the Run stage, where the "heartbeat" of optimization is fully automated, and the conversation moves from "how much are we spending?" to "how much value is every cloud dollar generating for our growth?"
Ready to control your multi-cloud budget with the same level of clarity? Schedule a demo to identify savings opportunities across AWS, Azure, and GCP.
Any questions? Contact sales