


You came here for one job: make cloud cost forecasting trustworthy. Finance stops pinging you. Engineering plans sprints without surprise overages.
The road gets bumpy. Late CUR files. Azure Cost Management exports miss tags. GCP BigQuery Billing lags. SP/RI purchases shift unit prices. Kubernetes requests/limits hide real costs.
This playbook comes from our Cloudaware FinOps teammates with 10+ years in the trenches, client lessons, and industry voices like Jeff Bloom (AWS Optics) and John Meyer from resent podcasts on YouTube.
Here’s where we’re going:
- How do you turn a noisy cloud spend curve into a debuggable cloud forecast your business can trust?
- Which drivers matter most (product launches, region adds, RI/SP changes) — and how do you encode them?
- What’s the weekly variance + anomaly review that actually prevents reforecasts?
- How do budgets by tag/label/CMDB scope route ownership to the right team in minutes?
- Where does optimization (rightsizing, storage class moves, instance family shifts) land in the forecast model?
But before diving into expert depth, let’s check if we’re on the same page about basics 👇
What is a cloud forecast?
Cloud forecast is a prediction of cloud spend by scope that your business uses to plan releases, headcount, and commitments. Built from historical data, known drivers, and optimization plans, then steered in a FinOps cadence, so costs stay predictable.
To make that prediction actionable for AWS/Azure/GCP teams, the model needs a few essentials — each with a clear job:
- Scope. App/team/env (CMDB scope via tags/labels) so ownership and actions are local.
- Horizon. Weekly/monthly/quarterly windows, so decisions land on time.
- Baseline data. Daily AWS CUR, Azure Cost Management, GCP Billing to keep numbers fresh.
- Drivers. Launches, region adds, decommissions, K8s requests/limits changes; the “why” behind movement.
- Commitments & pricing. RIs/Savings Plans/EA terms so unit rates reflect real contracts.
- Allocations. Shared services (egress, security, platform) spread consistently, revealing true costs.
- Budgets & alerts. Forecast-aware budgets with forecasted-to-breach signals into Slack/Jira before month-end.
- Variance & confidence. MAPE/WAPE and bands; triggers for reforecast when the data drifts.
Ensure you don’t mix it up with relevant terms 👇
What is cloud cost forecasting vs. estimation vs. budgeting?
In FinOps, these three terms show up in every planning meeting. Each plays a different role in how teams align cloud costs with roadmap, delivery, and accountability.
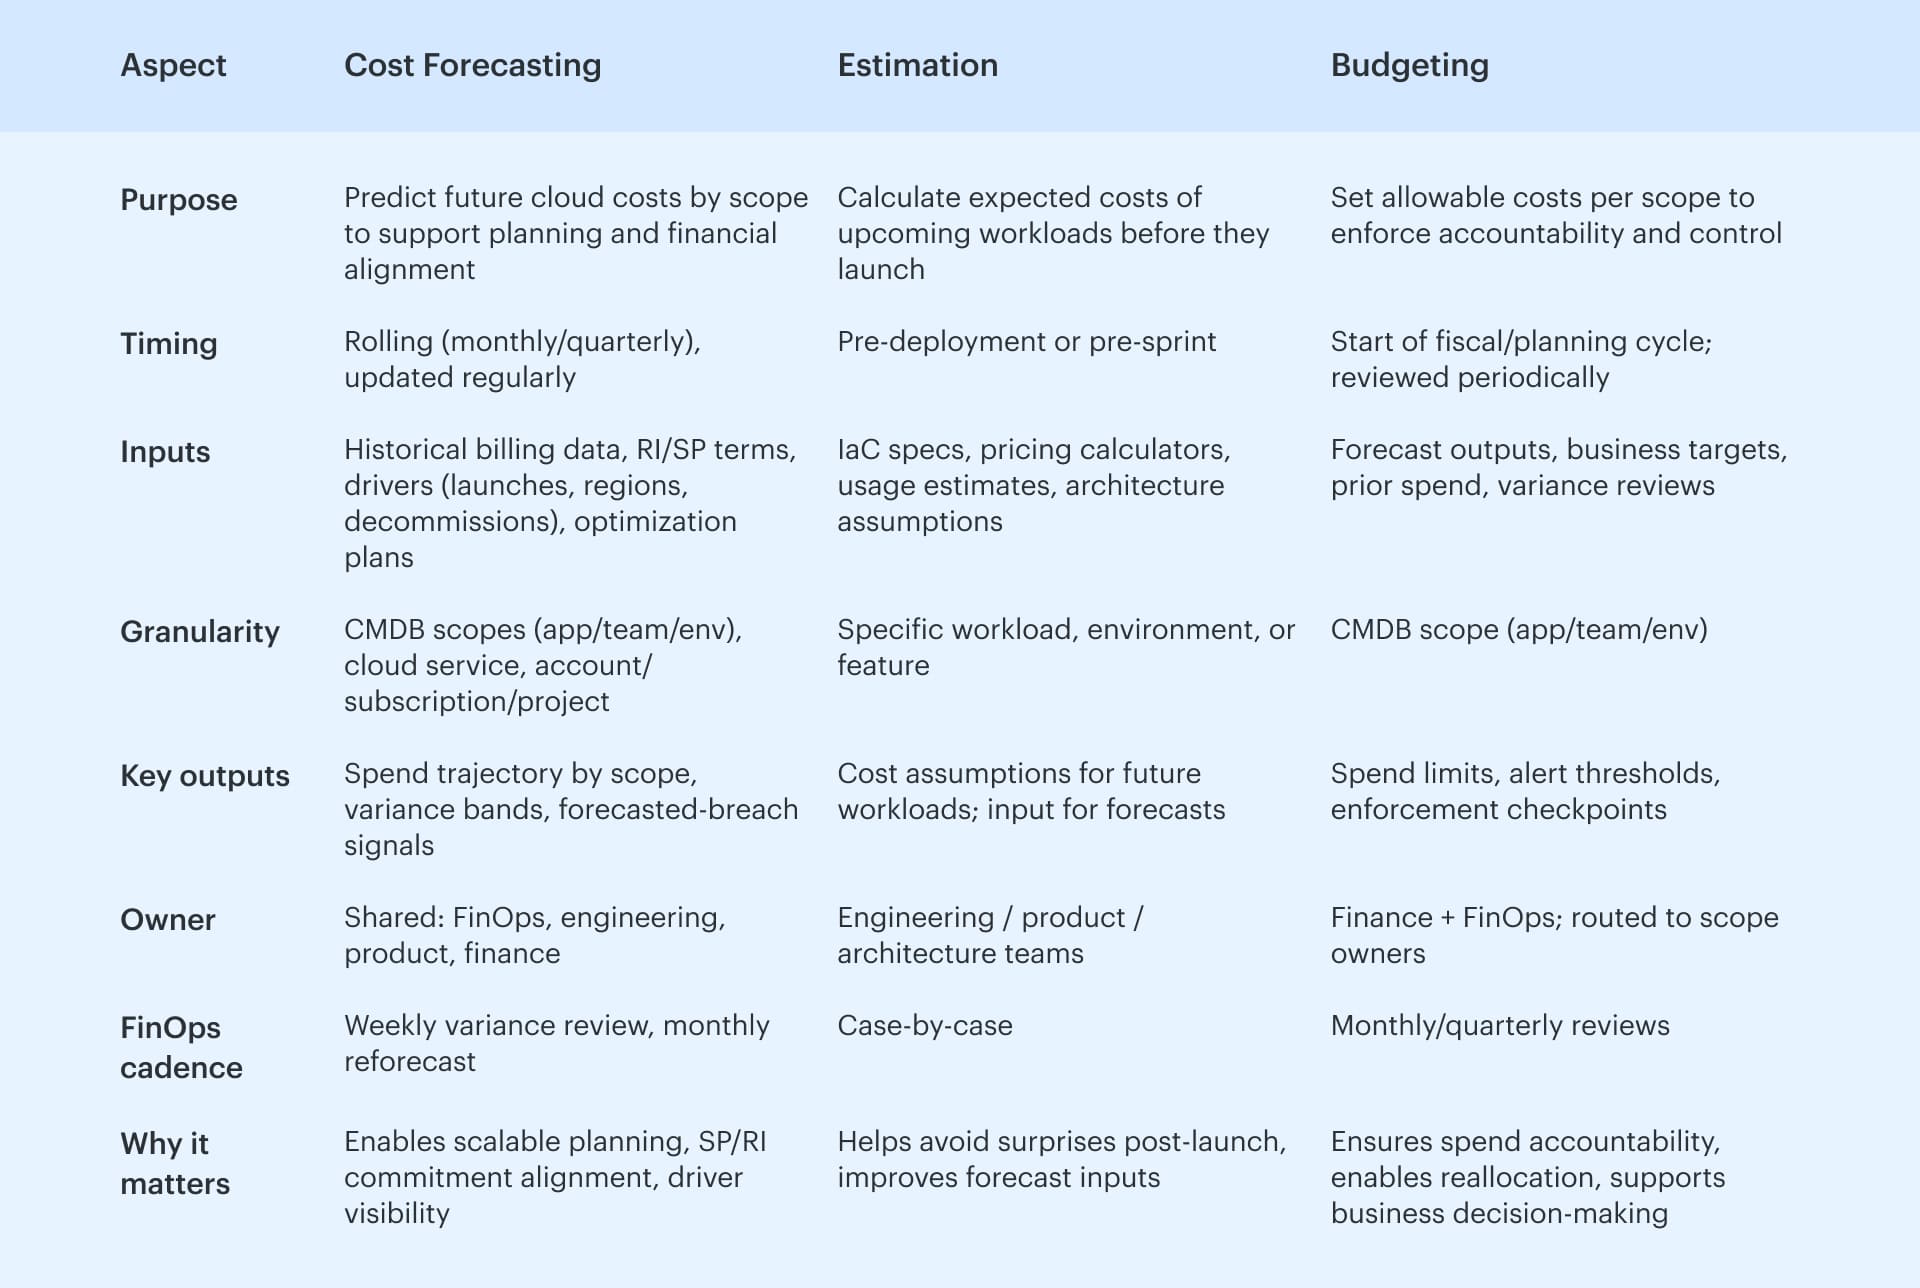
- Cloud cost forecasting is a forward-looking model built from real data — think AWS CUR with amortized costs, Azure Cost Management exports, GCP BigQuery Billing. It rolls up by CMDB scope and accounts for everything that affects spend: past usage, RI/SP terms, optimization ramps, launch timelines, even K8s requests and limits. The goal is accuracy over time, with variance bands and forecasted-breach alerts that the business can act on.
- Estimation happens earlier. Teams model expected costs for upcoming workloads — using IaC inputs, pricing calculators, throughput assumptions. These estimates feed into the forecast as drivers with dates and scope.
- Budgeting is where control kicks in. Budgets are spend boundaries set per scope, aligned to ownership. They trigger alerts, route variance, and give finance the checkpoints it needs to reallocate or escalate.
How does cloud cost forecasting actually works?
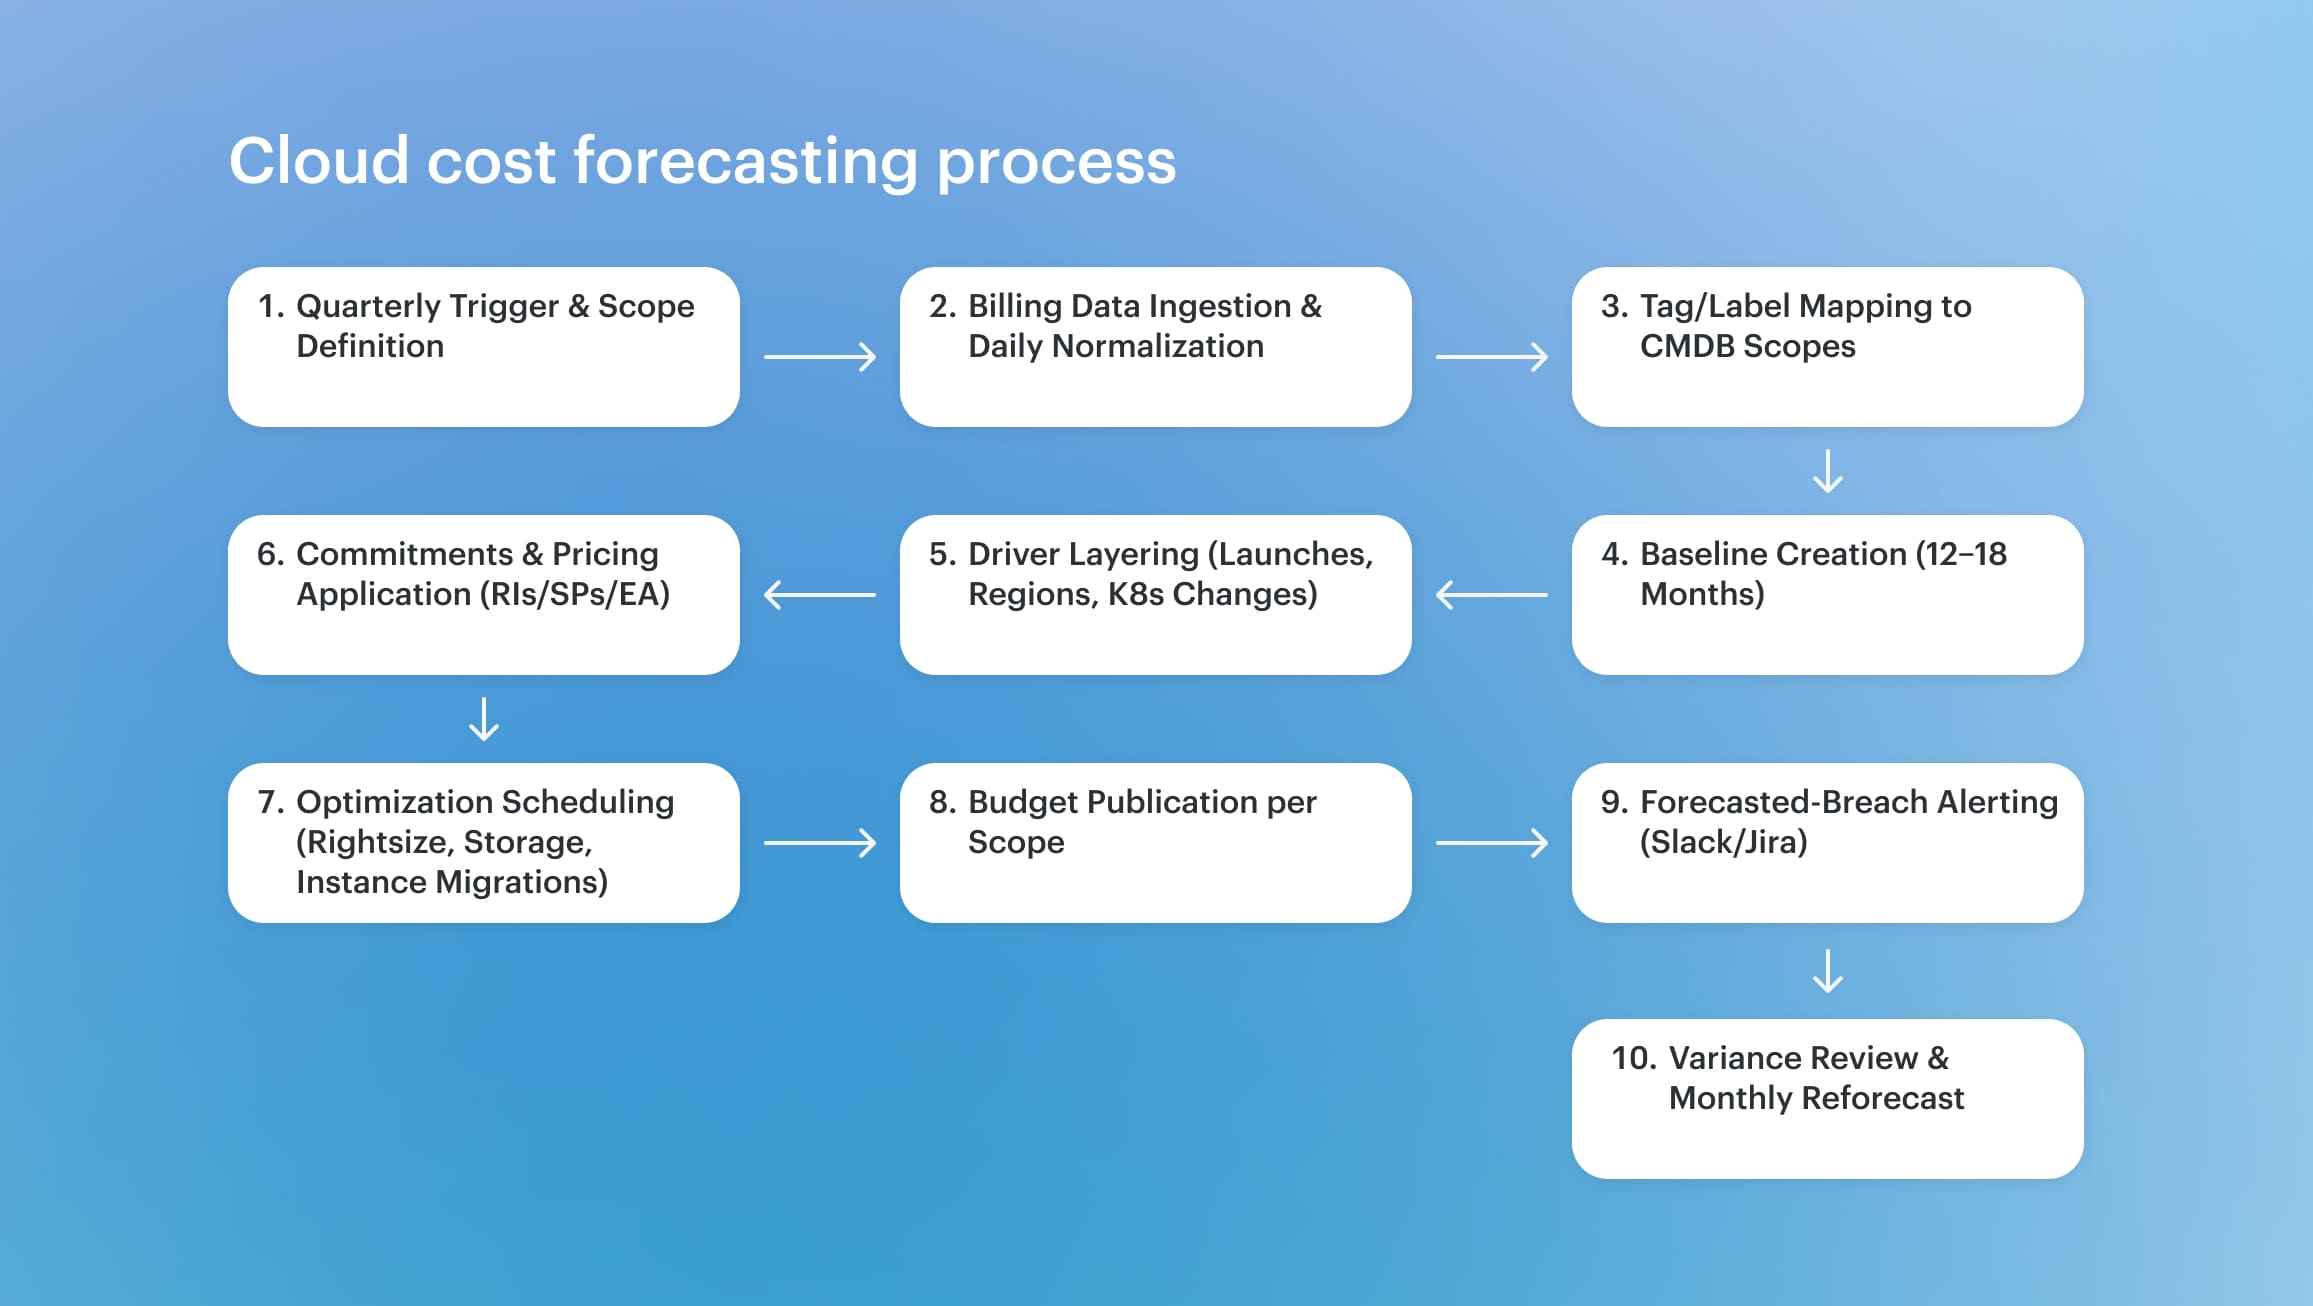
The cloud cost forecast begins the moment there's a need to plan — whether it's roadmap approvals, FY budgeting, or a large-scale deployment on the horizon. At Boeing, that moment comes early. With hundreds of engineering scopes running across AWS and Azure, their teams need forecasted cloud costs that reflect real usage — not just finance targets.
It starts with data. Daily ingestion of AWS CUR and Azure Cost Management exports feeds a normalized billing layer. Tags and labels map directly to CMDB scopes — structured around apps, environments, and teams. Forecasts are generated per scope, using 12–18 months of historical data as a baseline.
Then the drivers come in — upcoming workloads, decommissions, region adds, changes to K8s requests and limits. Each driver is tied to a start date, an owner, and a measurable impact. Commitments are layered next: RI and SP coverage, EA discounts, pricing agreements.
Budgets aren’t static. They’re generated from the forecast, with thresholds that trigger alerts before a breach. Weekly FinOps reviews track variance across scopes. When a spike or drop shows up, assumptions get tuned. Optimization work — rightsizing, instance shifts, storage tiering — is built in with dated deltas.
Once the mechanics are in place — billing data wired in, scopes defined, drivers tracked — the question becomes: how do teams actually model the cloud forecast?
Read also 👉12 FinOps use cases + solutions for multi-cloud spend
2 forecasting methods that actually work
Once the mechanics are in place — billing data wired in, scopes defined, drivers tracked — the question becomes: how do teams actually model the cloud forecast? The answer: use two methods in tandem. One reflects the past. The other accounts for what’s coming.
Trend-based forecasting pulls from 12 to 18 months of normalized usage and cloud costs — AWS CUR, Azure Cost Management, GCP BigQuery Billing. It projects the future by extending patterns forward. It works well when:
- Workloads are stable or growing linearly.
- RI/SP coverage has been consistent.
- Seasonality drives spend (e.g., Q4 retail traffic or end-of-quarter compute spikes.)
It’s fast to generate and solid for short-term cost forecasting. But on its own, it won’t catch what hasn’t happened yet.
Driver-based forecasting layers in what’s about to shift. Teams model dated events that will move cloud spend — not guesses, but scoped, named drivers. These usually fall into four buckets:
- Internal — new features, product launches, region adds, changes to K8s requests and limits.
- External — vendor price changes, platform deprecations, regulatory changes.
- Strategic — upcoming RI/SP purchases, instance family migrations, storage tiering.
- Reverse — decommissions, workload sunsets, platform consolidations.
Each driver includes an expected delta, a start date, and an owner. This is what gives a cloud cost forecasting model context the business can act on — and where engineering starts to trust the numbers.
Best practice?
As shared by AWS Optics team lead Erik Peterson on the FinOps podcast, and echoed in Cloudaware’s enterprise forecasting workshops:
“Start with a trend-based baseline to capture what’s already in motion. Then layer in driver-based assumptions as they become known — ideally before they hit production.”
That sequencing matters. Trend data gives finance confidence. Drivers give engineering a path to own the forecast. And together, they make the model resilient to change.
This is aligned with the FinOps Foundation’s guidance on Accurate Forecasting, which defines the practice as a cross-functional effort.
- Finance provides historical targets and growth constraints.
- Product and engineering contribute workload timing, regional expansions, and optimization impacts.
- FinOps owns the cadence — weekly variance reviews, monthly reforecasts, and logging key assumption changes.
At walk maturity, teams forecast 3–6 months ahead. At run, they version every scope’s model with baselines, drivers, risk bands, and owner accountability. Forecasts inform cloud budgets, drive SP/RI purchase timing, and let the business reallocate with confidence.
Read also 👉 How to use FinOps framework. Top 10 mistakes & their fix
Cloud budget that engineers can own
Once cloud cost forecasting is in place, the next step is operationalizing it as a cloud budget that lives where work happens: CMDB scopes for apps, teams, and environments. Tags and labels roll straight into those scopes, so ownership is explicit and the data stays live.
Typical budget objects include
- App/Service budget —
payments-prod,checkout-api - Team budget —
team-ml,team-observability - Environment budget —
prod,staging,dev - Account/Subscription/Project budget — AWS account / Azure subscription / GCP project.
- Service-class budget — EC2, S3, RDS; AKS; BigQuery.
- Kubernetes budget — cluster or namespace via labels.
- Portfolio/Program budget — grouped services for one roadmap.
This structure lets engineering see the slice they control, finance see alignment to the plan, and FinOps keep a clean audit trail.
How it runs
Cost forecasts and budgets both run on the same engine. There are a lot of inputs: the anticipated trajectory, the actuals, the RI/SP/EA terms, and the dated drivers for future workloads.
Tagging or labeling something makes it clear who owns it, what the CMDB scope is, and who is responsible for it (including Slack or Jira handles).
Fire early in guardrails. Thresholds at 50%, 80%, 100%, and "forecasted-to-breach" catch drift before it gets out of hand. Alerts come with all the information and top reasons, so the inquiry starts with proof instead of a scavenger hunt.
Showback and chargeback link cloud costs to manageable areas, making it easy for the company to move money around and set priorities.
Then cadence makes it real: a weekly review of changes to tune assumptions, a monthly tune to refresh scenarios, and decisions noted for traceability.
As a result, cloud budgets that are still useful, cloud spending that is still predictable, and a FinOps cycle that keeps flowing at delivery speed.
Read also: Cloud Cost Optimization Framework: 11 Steps to reducing spend in 2026
How to build a driver-based cloud forecast
Once the baseline is clear and scopes are tagged, the next step is turning strategy into numbers. That’s where driver-based cloud cost forecasting comes in. Unlike trend-based models that look back, driver-based forecasting maps business plans — like new features, regional rollouts, and RI/SP changes — onto future cloud spend.
It gives finance forward visibility and gives engineering space to own their slice.
At Cloudaware, driver modeling is scoped to the CMDB. Forecasts live at the same level as budgets: app, team, environment, Kubernetes namespace, or project.
Every driver links to a scope, owner, timeline, and expected delta. Daily billing data feeds keep models live, and updates trigger alerts before surprises hit the bill.
Here’s how enterprise teams make it work:
1️⃣ Define forecasting scopes
Forecasting starts where ownership lives. Each forecast is tied to a CMDB scope: app (payments-prod), team (team-ml), environment (prod, dev), cloud account, or Kubernetes namespace. These scopes sync with cloud budget objects, which means forecasts are directly actionable.
Scopes are not just technical groupings — they're FinOps control planes. They match how engineering works and how finance allocates. At Cloudaware, scope metadata includes tags, owners, thresholds, and linked budget alerts.
Read also: 6 Ways to (not) Fail AWS Cloud Cost Optimization in 2026
2️⃣ Build the baseline
Use 12–18 months of normalized billing data — AWS CUR (with amortized/unblended rates), Azure EA exports, GCP BigQuery Billing. Include RI/SP coverage and pricing agreements. Map costs by scope and service class (e.g., EC2, S3, Databases, BigQuery).
This is your "nothing changes" scenario. Cloudaware updates this daily, with full cross-cloud alignment.
Read also: 10 Cloud Cost Optimization Strategies From FinOps Experts
3️⃣ Gather and classify forecast drivers
Pull upcoming drivers from roadmap planning, deployment calendars, and cloud infrastructure changes. Every driver should be:
- Scoped (app/team/env)
- Dated (start/end or one-off)
- Quantified (expected $ delta)
- Owned (tagged to a team or person)
Use the 4-driver bucket model shared by AWS and FinOps leaders:
- Internal — new features, region adds, scaling events, changes to K8s Requests/Limits.
- External — vendor pricing changes, license renewals, compliance deadlines.
- Strategic — RI/SP purchases, instance migrations, storage tier shifts.
- Reverse — decommissions, workload retirements, platform consolidations.
In mature orgs, driver lists are maintained in backlog tools or as part of the FinOps quarterly planning cycle. Boeing, for example, reviews driver deltas weekly and updates scope-level forecasts monthly based on execution risk.
Read also 👉 Compare 12 Best FinOps Tools: Features, Price, Pros & Cons
4️⃣ Encode drivers into the forecast
Each driver becomes a scheduled delta in the forecast model. Apply the impact over time with configurable ramp logic. For example:
“Migrate 80% of EC2 m6i.4xlarge to c7g.large between Nov 1–30. Expected savings: –$9,200/month when complete.”
Cloudaware supports ramp scheduling per driver, and links them to scope-level cost objects. That means forecast changes show up in the same place as budget alerts — no duplication.
Forecasting logic is transparent: finance can trace each change, and engineers can update assumptions directly.
Read also: Cloud Migration Costs for Enterprises: Forecasting, Risks, and Savings Controls
5️⃣ Version the model
Each forecast version becomes a shared artifact across finance, engineering, and FinOps. Versioning tracks what changed, when, and why — so teams can explain variances without finger-pointing.
Best practice (as echoed in the podcast with AWS Optics): “Start with a trend-based baseline, then layer driver deltas as they become known. Track versions so assumptions don’t get lost.”
Cloudaware supports scope-level model versioning, letting teams compare prior versions, highlight driver changes, and surface new risks as projects evolve.
Read also: AWS Cloud Cost Management: A Practical Guide
6️⃣ Monitor with live data
Forecasts don’t stand still. That’s why teams using Cloudaware sync forecasts daily with live billing files. When actual cloud spend drifts from modeled expectations, alerts route via Slack, Jira, or dashboards — with CMDB scope and top driver details included.
Weekly variance reviews use this data to close the loop. Forecast accuracy is tracked via WAPE/MAPE. Assumptions are updated monthly. Optimization plans (e.g., rightsizing, SP coverage) are re-evaluated quarterly.
Read also: 12 Cloud Cost Management Tools: Software Features & Price
What this unlocks
Driver-based cloud forecasting creates a single source of truth for both engineering and finance. It gives the business visibility, lets FinOps run a steady cadence, and ensures that cloud costs follow what was planned — not just what was deployed.
And when forecasts are wired into budgets and alerts? That’s when they actually drive action. More on that in the next section. 👇
Wire forecasts to budgets, alerts, and weekly variance reviews
A cloud forecast only works when it’s wired to action. That means linking it directly to cloud budgets, real-time alerts, and a steady review cadence. This is where cloud cost forecasting moves from spreadsheet to strategy.
In Cloudaware, forecasts and budgets are scoped the same way engineers think — by app, team, environment, Kubernetes namespace, or cloud account. Each scope has a budget object attached, built from the forecast, updated daily with live data from AWS, Azure, and GCP.
These cloud budgets don’t wait for overspend — they trigger alerts when forecasted to breach. That early warning creates time to respond, reroute, or optimize. It mirrors how AWS Budgets behave — but scoped through CMDB logic, not flat account limits.
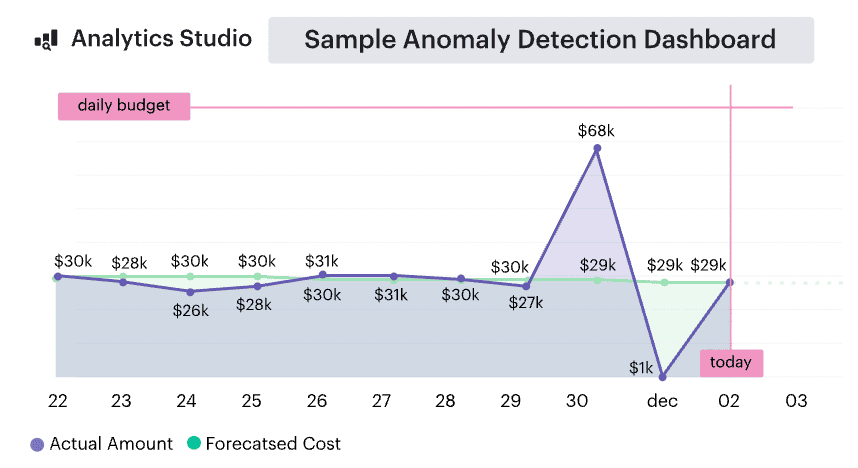
But that’s just one signal. Anomaly detection runs alongside, scanning for spend spikes that don’t breach thresholds but still matter — like a misconfigured deployment or sandbox workload that suddenly scales 5×. As Erik Peterson from AWS Optics shared on the FinOps podcast:
“Run Budgets and Anomaly Detection together. One shows the trend. The other flags the surprise.”
Cloudaware routes both signals to the right people fast — Slack, Jira, or email — with full scope context, driver visibility, and ownership baked in. No manual mapping. No alert fatigue.
Then comes the cadence. Mature FinOps teams review variance weekly. App owners, platform leads, and finance sit down. They pull up scope-level forecasts, compare actuals, and ask: Was this planned? Is it legit? Does the forecast need to adjust — or do we need to act?
This practice ties directly into the FinOps Foundation’s guidance on Accurate Forecasting and Variance Analysis. Cross-functional accountability. Driver-backed decisions. Forecasts that evolve with the business.
That’s the loop. Forecast → Budget → Signal → Review. With Cloudaware, it all runs on top of the CMDB. And when it does, cloud spend gets predictable — even at scale.
Next up: what happens when optimization enters the picture — and how to plan for its impact on your forecast.👇
Optimization changes the cloud forecast — plan for it
Optimization isn’t just a cost-saving play — it’s a forecasting event. Every rightsizing decision, RI/SP commitment, or storage class migration shifts both the unit rate and the cloud forecast timeline. Ignore that, and the model drifts. Bake it in, and your forecast becomes something the business can plan on without surprises.
In practice, cloud cost forecasting teams treat optimizations as dated deltas. Each action has a scope, a start date, and a ramp. The spend curve changes over time — not instantly. At Cloudaware, these optimization drivers are tied to CMDB scopes and versioned inside the same reporting engine that powers budgets and variance reviews.
Let’s say a team plans to move 60% of compute from m6i.4xlarge to Graviton2 over eight weeks. That forecast line should look like:
“Start Dec 1, migrate 10% per week to c7g.large. Target completion: Jan 26. Forecasted delta: –$12,000/month at full execution.”
The same goes for:
- Buying SPs/RIs: Date the purchase, model the blended rate shift across services.
- Rightsizing: Include P95 metrics, confidence score, and expected timing by scope.
- Storage class changes: Reflect lifecycle transitions (e.g., S3 Standard to Glacier), not just cost drops.
- Graviton/AMD shifts: Tie to AMI rollout or container replatforming schedule.
This is where forecast versioning really pays off. In Cloudaware, when a driver changes — delays, accelerates, gets partially implemented — you log the new version. Teams can compare expected vs. actual deltas and trace the root of variance.
The FinOps Foundation calls this out clearly:
“Optimization efforts must be included in forecasts to maintain trust in the model. Otherwise, variance will show up as unexplained.”
When optimization is treated as a first-class input — not a side effect — cloud spend stays aligned with intent. The organization can model savings before they land. Finance sees return on commitment. Engineering sees it reflected in their scopes.
That’s how a cloud computing forecast becomes a feedback loop, not just a report.
Next: what great cloud forecasting software should make easy — and what to look for before committing your team to another dashboard.👇
What good cloud forecasting software should do
By now, the architecture of a solid cloud cost forecast is clear — baseline from usage, layer in drivers, connect to budgets, track variance. But doing this manually across AWS, Azure, and GCP?
That’s where most teams burn out. What makes it sustainable is the software layer underneath. And not just any dashboard — something built for FinOps, scope ownership, and actual decision-making at scale.
Here’s what good cloud forecasting software should actually deliver — and why it matters to your team, your forecast, and your organization.
This is what makes a forecast operational. Not just visible — but versioned, alert-driven, scope-aware, and tied to the actual levers teams pull.
Next: what accuracy benchmarks and maturity targets look like when this foundation is in place — and how to level up without guessing.👇
Cloud cost forecast benchmarks to consider
Once the model is running, the question becomes: how close is close enough? Forecasting isn’t just about projecting cloud costs — it’s about being able to explain variance, tune accuracy, and earn trust across the organization. That’s where benchmarks come in. Not for perfection, but for signaling when your cloud cost forecasting practice is ready to level up.
The FinOps Foundation provides maturity-aligned targets for forecast accuracy. These aren’t guesswork — they reflect what real teams operating across AWS, Azure, and GCP are actually tracking:
- At Crawl, variance may land around ±20–25%. Forecasts are directional. Cadence is monthly. Budgets and actuals may be reviewed after-the-fact.
- At Walk, target variance tightens to ±15%. Forecasts are updated monthly, variance is reviewed weekly, and forecasted-to-breach alerts are in place.
- At Run, mature teams hold variance to within ±10–12%. Forecasts are versioned per scope, updated with new drivers, and validated against optimization timelines.
Accuracy is usually measured using WAPE (Weighted Absolute Percentage Error) or MAPE (Mean Absolute Percentage Error), scoped by application, business unit, or team. These indicators surface early drift — before it shows up in the invoice.
It’s also important to benchmark cloud cost forecasting process health — not just output accuracy. Some examples pulled from FinOps Foundation guidance and enterprise implementations:
- % of cloud spend under forecast-aware budgets
- % of variance with a documented driver
- Time-to-owner on forecasted breach alert
- Cadence and participation in variance reviews
Benchmarks give the business confidence to act on the forecast — and help FinOps teams prioritize what to fix when things start drifting.
Speaking of which… let’s get into the most common failure modes, and how to prevent them before they derail your next cloud computing forecast.👇
5 Common cost forecasting failure modes and their fixes
Even the sharpest cloud cost forecasting strategy can go sideways when the basics break. These aren’t edge cases — they’re recurring blockers in mid-to-enterprise environments. Each issue below reflects real-world failures observed by Cloudaware consultants or discussed by FinOps experts like Erik Peterson (AWS), Tony Safoian (SADA), and Joe Daly (FinOps Foundation).
Here’s how teams get tripped up — and how they tune their process back into alignment.
Billing feeds arrive late or incomplete
🗣 Erik Peterson, AWS Optics
“If billing data is off by even a few days, the model goes stale. Finance keeps planning. Engineering gets surprised. That time gap erodes trust.”
In Cloudaware, teams configure ingestion checks for AWS CUR (hourly, Parquet, S3), Azure EA exports, and GCP BigQuery billing tables. These are monitored daily — if columns break or files go missing, teams get Slack or Jira alerts. Forecasts stay current. Models stay trustworthy.
No owner assigned to forecast variance
🗣 Kristina, Seniour ITAM expert at Cloudaware:
“When forecasts breach and no one owns the scope, alerts fall flat. You lose time assigning accountability instead of acting.”
Cloudaware ties every forecast and budget to a CMDB-defined scope — app, team, or namespace — with mapped owners. When alerts hit Slack or tickets trigger, the owner is already there. Teams can act on cloud cost drift without rerouting.
RI/SP commitments ignored in cost modeling
“Forecasting without amortized pricing is like budgeting on list price. You're miles off and don’t know why.”
Forecasts must reflect commitment coverage. Cloudaware models RI/SP effects using amortized rates pulled from CUR and Azure exports. Forecasted unit costs align with real blended spend, not on-demand estimates. SP start dates and service scopes are encoded as deltas inside the model.
Kubernetes spend undercounted
🗣 Tony Safoian, CEO at SADA (Google Cloud MSP):
“Most teams miss K8s cost completely — especially shared nodes, orphaned PVCs, and system pods. That’s real spend with no attribution.”
Cloudaware scopes Kubernetes usage by label — namespace, team, app — and maps it into the CMDB. Clusters are tracked per scope with Requests/Limits, idle node heatmaps, and showback reports. Forecasts include that cost trajectory just like any VM or database.
Shared costs go unmapped
🗣 Anna, ITAM expert at Cloudaware:
“Shared services like logging, networking, monitoring can crush your variance report — if they aren’t allocated upfront.”
Cloudaware supports shared cloud cost allocation logic. Teams can define % splits per CMDB scope or apply formulas based on usage signals. These are versioned and tied into both budgets and forecast models, so shared spend doesn’t float unassigned.
These failure modes aren’t rare — they’re patterns. Fixing them means operationalizing forecasting as a cross-team FinOps discipline. That means healthy billing data, defined scope ownership, real commitment modeling, and a clear allocation strategy across the organization.
Read also: How to use FinOps framework. Top 10 mistakes & their fix
How Cloudaware makes this operational
All the forecasting strategy in the world falls apart without the right execution layer. Cloudaware is cloud forecasting software built for FinOps teams managing real complexity — multi-cloud, multi-team, high-stakes. CMDB-enriched cost data ties every euro to real business context (owner, app, environment, tags/labels, lifecycle state), so forecasts map to how your org actually runs.
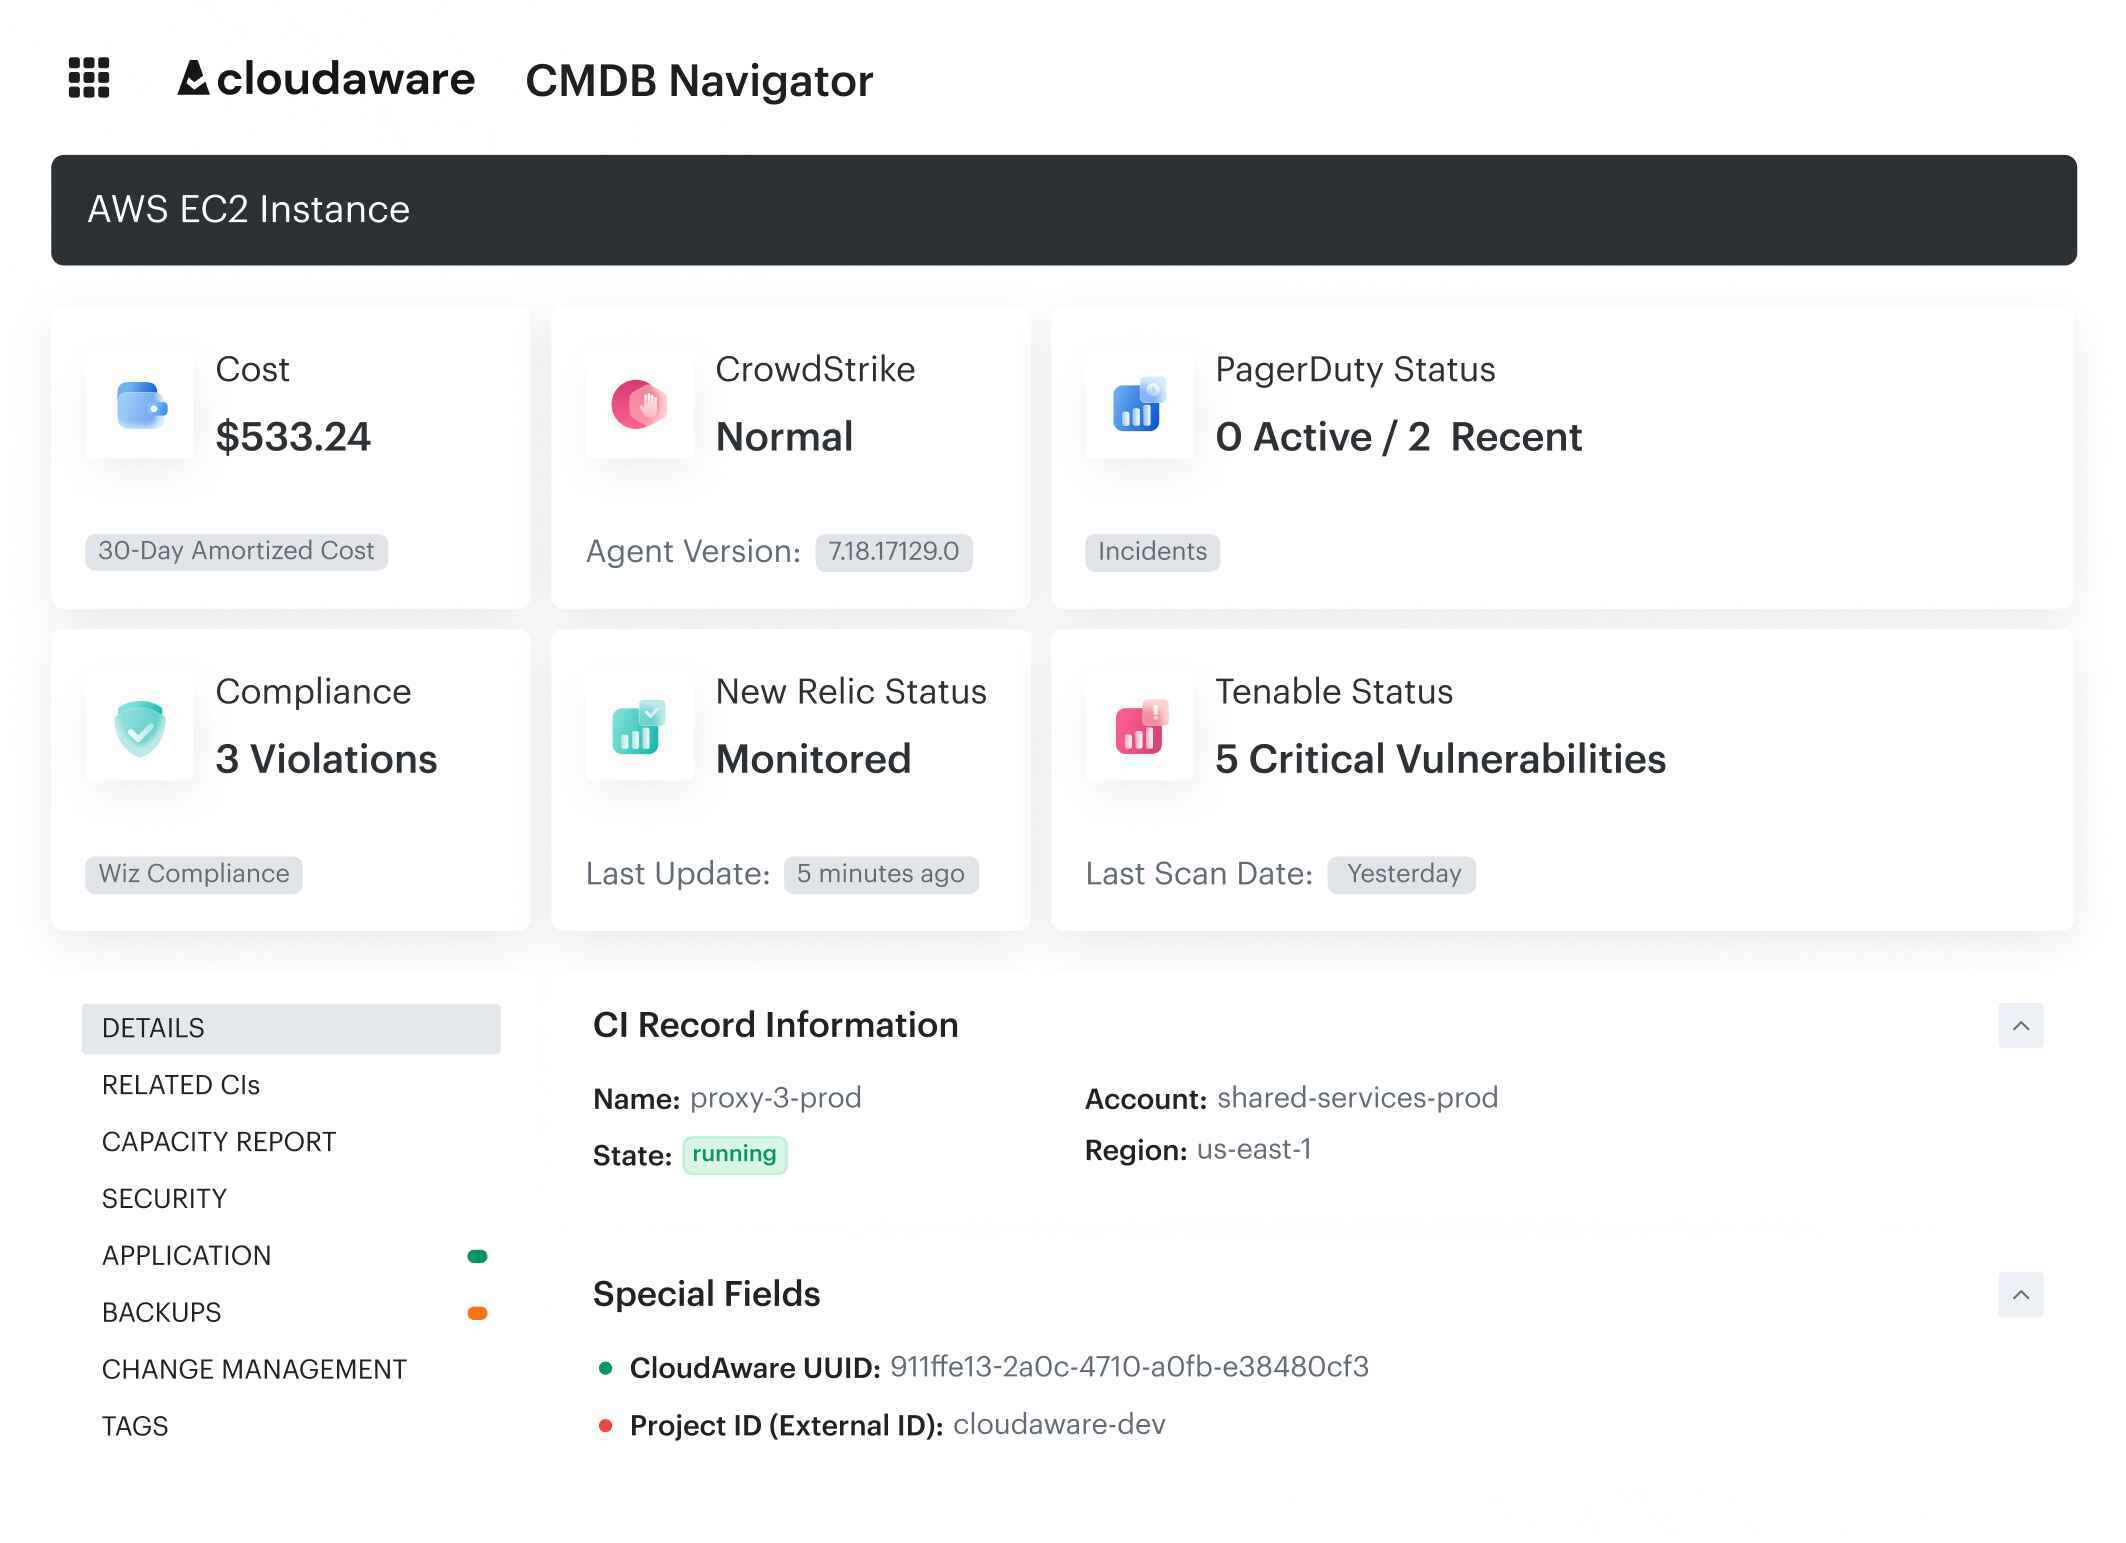
No throttling. No stale exports. Cloudaware ingests AWS CUR (hourly, Parquet), Azure Cost Management exports, GCP BigQuery Billing, Oracle Cloud billing exports, and Alibaba Cloud CSV reports — normalized daily for multi-cloud visibility and forecast accuracy.
Whether you’re tracking RI/SP impact, forecasting Kubernetes resources, or running chargeback at the BU level, Cloudaware makes the process live, visible, and reviewable — enabling scalable, cross-functional cost forecasting the business can trust and engineering can act on.
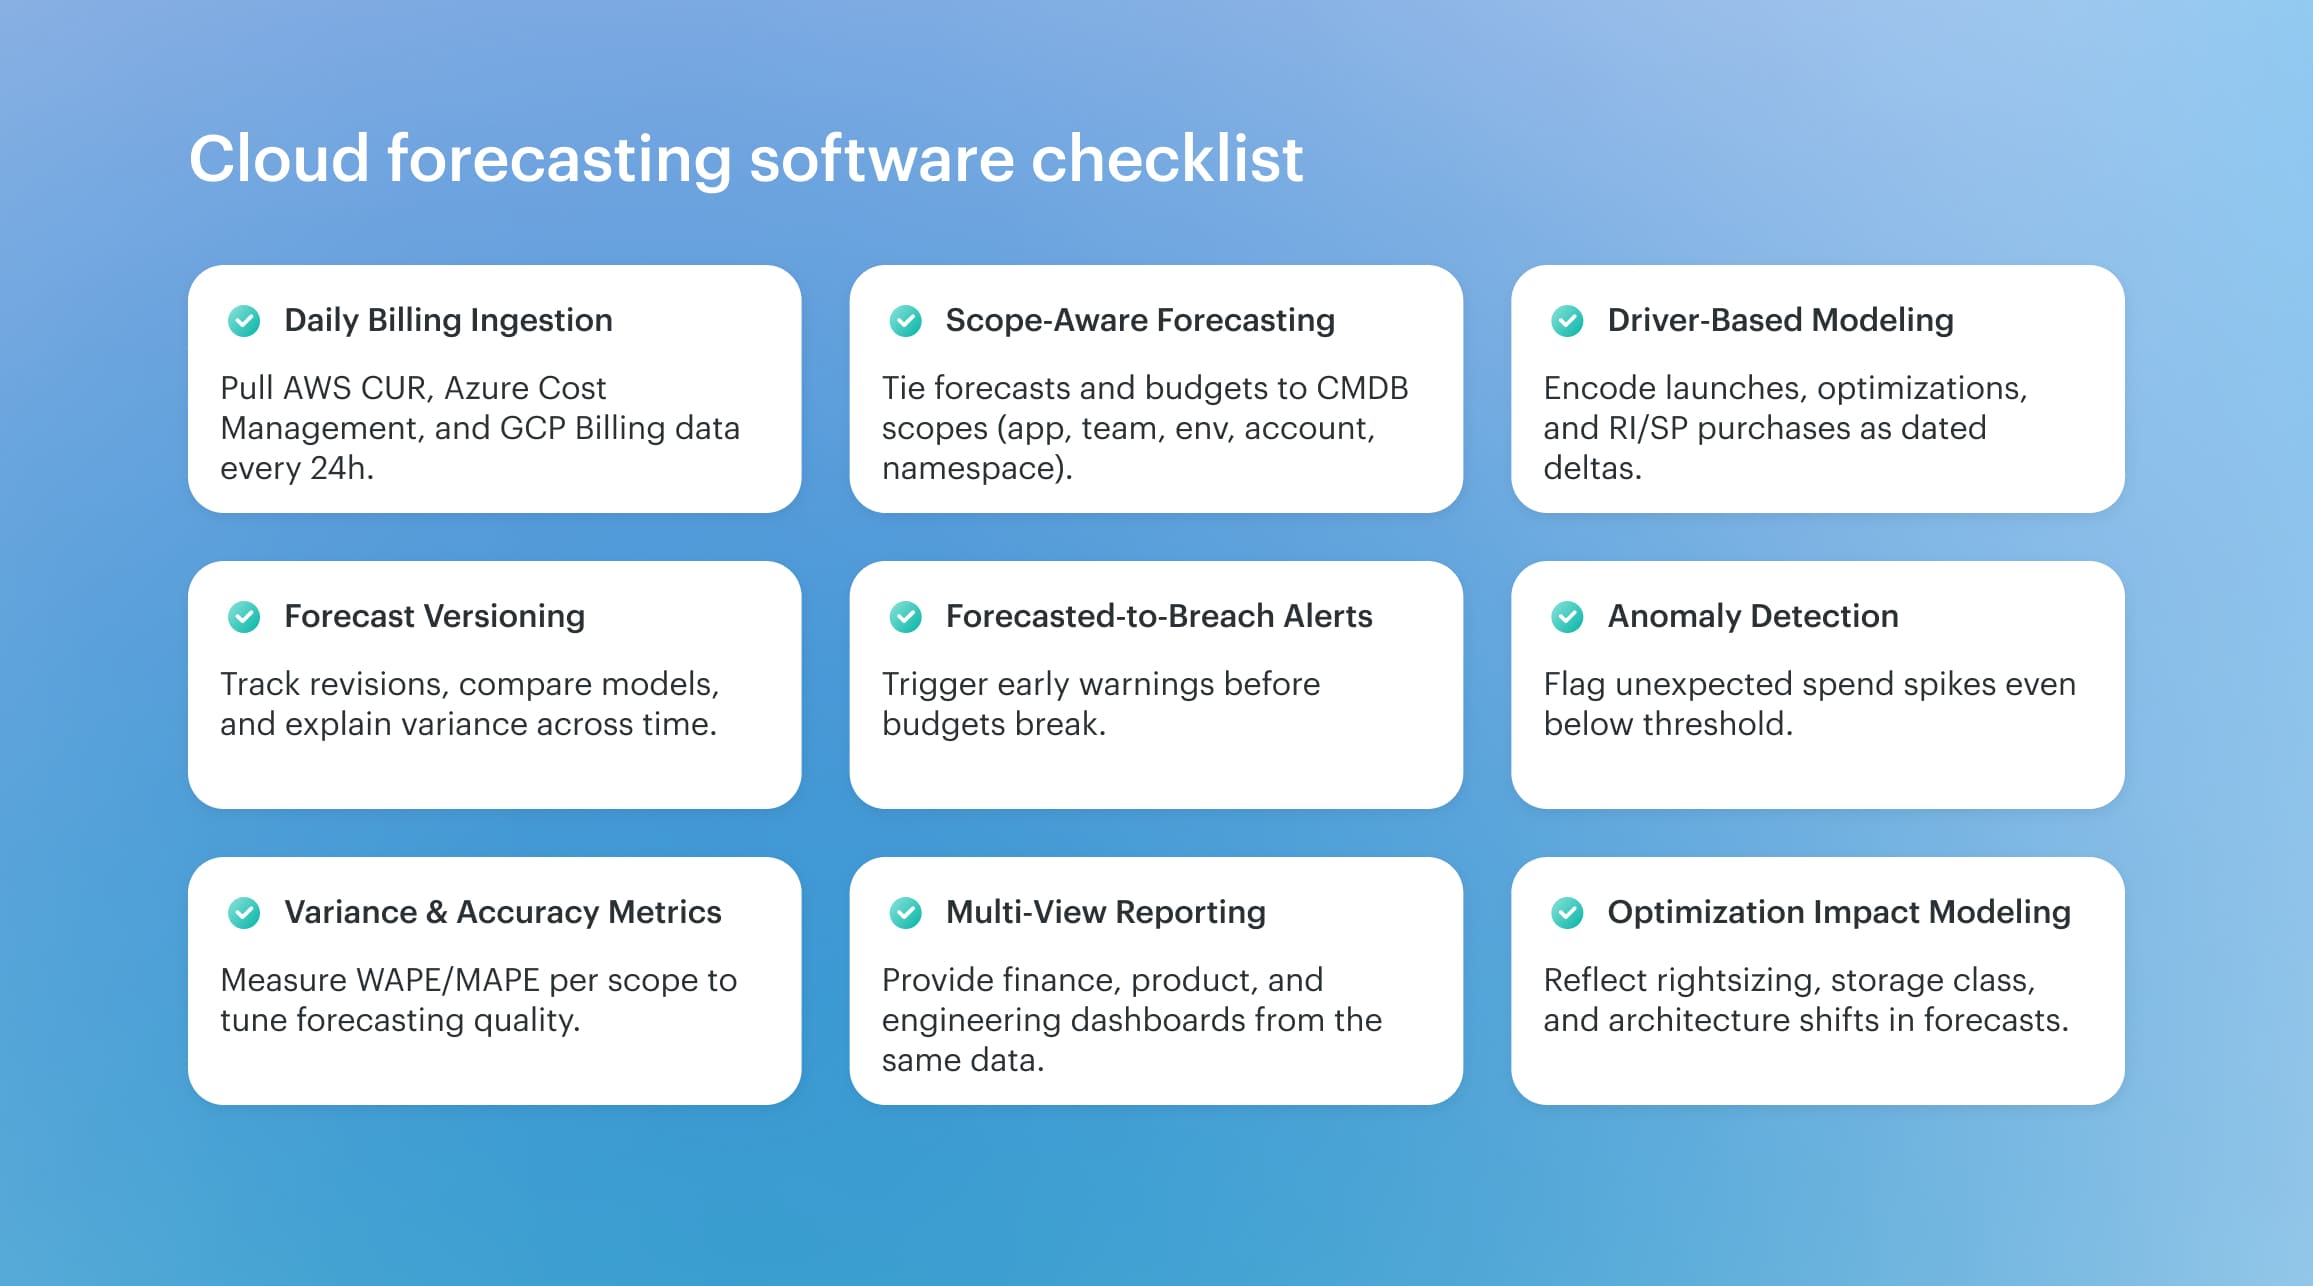
Key FinOps features Cloudaware provides
- Daily billing ingestion + normalization. No lags, no gaps. Real-time cloud usage synced from AWS, Azure, and GCP — normalized for forecasting and reporting.
- CMDB-enriched forecasting. Every forecast and budget is scoped with CMDB context — tags, owners, app/team/env mappings — so alerts land with the right person, fast.
- Cloud budgets with forecasted-to-breach alerts. Budgets by scope, with early warning thresholds and Slack/Jira routing. Engineers see them before Finance asks.
- Driver-based forecasting with versioning. Encode launches, migrations, RI/SP purchases, and optimization ramps as dated deltas. Track every change across versions.
- Anomaly detection tied to scopes. Auto-detect spikes that won’t cross thresholds — but still matter. Each alert includes scope, driver context, and next action.
- Built-in rightsizing intelligence. Identify overprovisioned compute, storage, and container workloads. Apply impact directly to the forecast.
- Tagging analysis and hygiene tracking. See missing, outdated, or conflicting tags by service and account. Improve cost allocation and scope clarity at the source.
- Forecast dashboards. Accuracy scoring for each scope. Dashboards built for Finance, Product, and Engineering — all from one forecast model.
- Flexible cost allocation engine. Model shared resources across business units or environments with rules tied to usage, % splits, or custom logic.
- ITAM‑informed cost forecasting. Workload and asset context pulled directly from Cloudaware IT Asset Management. Forecasts reflect actual deployed inventory — not just billing rows.
- Enterprise-level support from FinOps and ITAM experts. Dedicated services team helps you design your forecasting structure, tune scope definitions, and align budgeting with real-world delivery teams.