


AI unit economics measures what AI costs per unit of work and per unit of business value delivered. It explains a pattern FinOps teams now see in their own bills: the price of a given level of model capability keeps falling, by between 9x and 900x per year depending on the capability threshold, according to Epoch AI, while total AI spend keeps rising.
Yuriy Prykhodko, principal technologist at AWS Enterprise Support and founder of the open-source Cloud Intelligence Dashboards project, presented a three-layer KPI model for AI efficiency built with some of the largest Amazon Bedrock token consumers. The model rests on three FinOps foundations, measures AI efficiency from provider discounts up to business outcomes, and ends in a single test for whether an AI workload should scale.
TL;DR
- Falling token prices have not lowered AI bills. Consumption grows faster than prices fall, and reasoning models bill their hidden thinking as output tokens.
- Three foundations come first. Cost allocation, total cost of AI and cost governance give every later KPI an owner and a complete cost.
- Layer 1 measures discount capture. Cache hit rate, batch share, commitment coverage and model mix show how much of each provider's rate reductions a workload uses.
- Layer 2 is the bridge metric. Cost per million tokens, tracked per application over time, shows workflow changes that total spend hides.
- Layer 3 decides scale. Business unit cost and the value AI delivers answer whether one more dollar of AI spend returns more than a dollar.
- For the wider KPI catalog, see 27 FinOps KPIs and cloud cost optimization metrics.
Two mechanisms that raise AI bills while token prices fall
Lower prices per token have not produced lower AI bills. Two mechanisms explain the gap, and both act on the number of tokens consumed rather than on the price of each token.
Usage grows faster than the price falls
The Jevons paradox describes what happens when a resource becomes cheaper to use: total consumption rises by more than the saving. AI follows the pattern. Agentic workflows call models in loops: they plan, call tools, check results and retry. Models are now consumed at the pace of machines rather than the pace of people typing prompts, and a single user request that once meant one model call now means a chain of them.
Reasoning tokens are billed as output
Models with extended reasoning produce internal thinking before they answer. OpenAI bills reasoning tokens as output tokens even though the API does not return them, and Anthropic counts thinking tokens within the billed output tokens. Output tokens carry a higher price than input tokens on most models, so a reasoning model can cost more per request than an older model with a higher list price per token.
| Driver | Effect on the bill |
|---|---|
| Lower price per token | Lowers the cost of each model call |
| Agentic workflows | Multiply the model calls behind each user request |
| Reasoning models | Add billed output tokens that never appear in the response |
Total AI spend says little about efficiency on its own. A rising bill can mean waste, growth in usage or a deliberate model change, and the three layers of KPIs separate those cases.
Allocation, total cost and governance come before any AI efficiency KPI
Every AI efficiency KPI divides a cost by something. The ratio means nothing until the cost side is attributable to an owner and complete across providers. Prykhodko calls these foundations non-negotiable: they are the base every KPI is built on.
Cost allocation: which applications and teams consume AI
Allocation answers who uses AI: which applications, which teams and which features. AI spend arrives through two routes. Managed model services such as Amazon Bedrock, Vertex AI (now Gemini Enterprise Agent Platform) and Microsoft Foundry bill through cloud accounts, where cost allocation tags and application inference profiles attribute usage. Model vendors also bill directly against the API keys they issue, and a key shared by several features or agents hides which of them made each call. Splitting a shared key takes a usage signal from the application itself, such as request logs per feature or per agent.
Cloudaware allocates AI spend through the service catalog rather than through tags alone. Multi-signal mapping attributes a line of spend by a valid tag, then by account, project or naming pattern, so spend lands on an application even when tagging is incomplete. Custom-data allocation splits a shared key or a multi-agent workflow by the usage signal the application already produces. Spend that no rule can attribute stays visible as its own line, so the unallocated share is a number with an owner for the cleanup. For allocation methods in general, see cost allocation software.
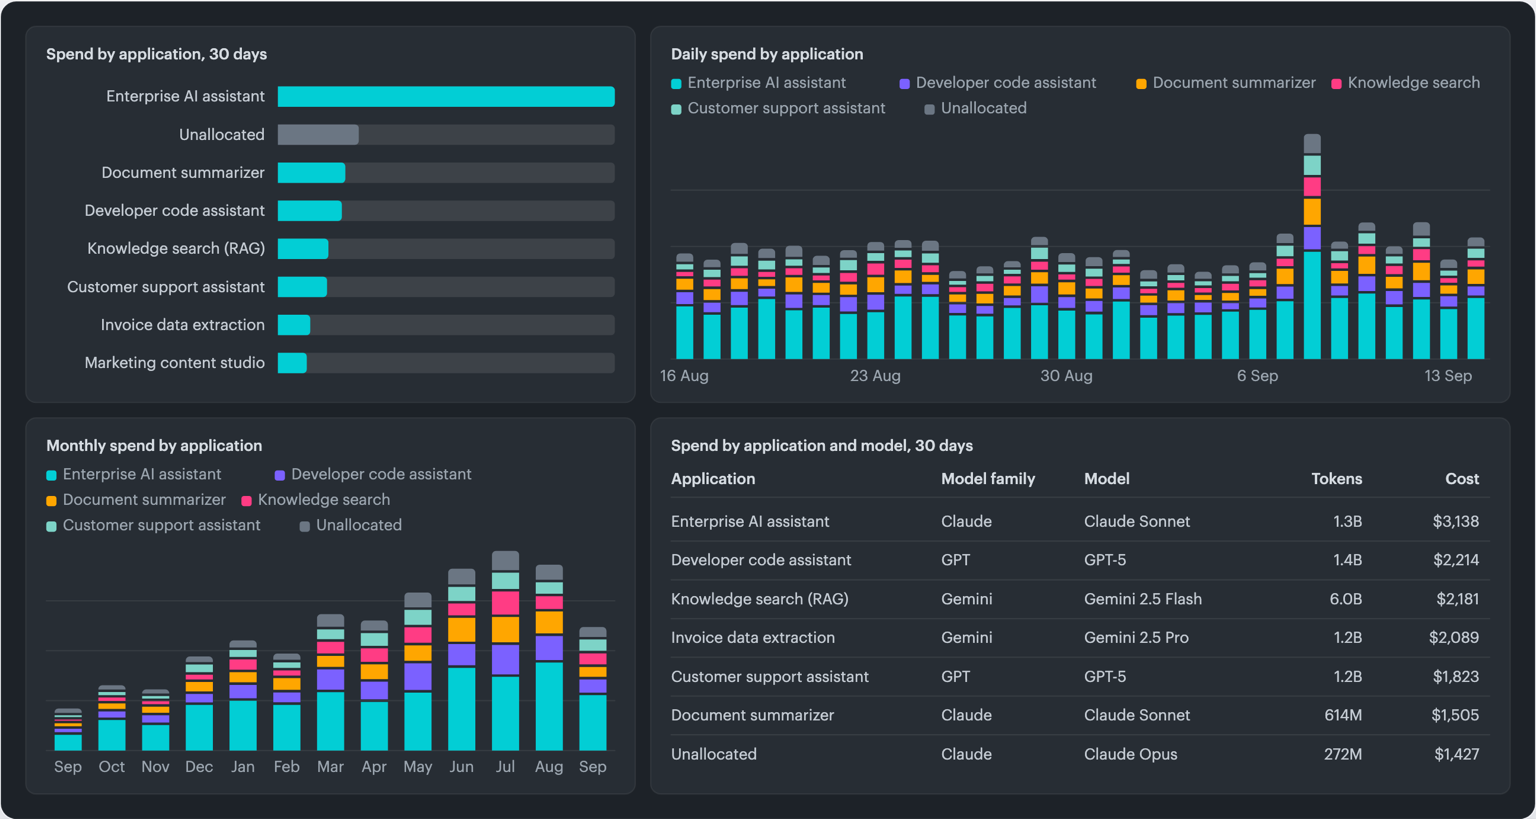
Illustration of the Applications view of the AI Model Dashboard in Cloudaware: AI spend by consuming application, daily and monthly, with model, token volume and cost per application and the unallocated share listed separately.
Total cost of AI across clouds and model vendors
Total cost answers how much. Spend on Amazon Bedrock, Vertex AI and Microsoft Foundry arrives in each cloud's billing export. Unlike infrastructure-as-a-service providers, AI vendors billed directly, such as Anthropic, OpenAI and OpenRouter, don't provide a billing dataset; their usage and cost come from each vendor's console or API, in each vendor's own format. GPU instances and managed machine learning capacity that host self-managed models belong in the same total.
Cloudaware consumes billing data from Amazon Bedrock, Vertex AI, Microsoft Foundry, OpenRouter, Anthropic and OpenAI, and generates a dataset in the FinOps Foundation's FOCUS format from their metering data. One query then returns AI spend across every provider, by model, by application and by team, and the KPIs in the three layers run on that one dataset.
Cost governance: budgets, allowances and alerts
Governance prepares the organization for surprises. Budgets per application or team, token allowances per group of users, and anomaly detection on daily AI spend catch a runaway agent loop or an expensive prompt change before month end. An alert can be acted on only when the owner is already attached, which is why allocation comes first.
Cloudaware's AI FinOps Command Center sets a monthly budget and a token allowance per team, tracks actual spend against both, and projects month-end spend from the current run rate. Teams projected over their allowance raise an alert before the month closes. For AI assistants licensed per user, such as coding and chat assistants, spend is tracked per user against that user's allowance and mapped to division, manager and cost center. Anomaly detection runs on the same allocated data, so a spike arrives with the application and owner already named.
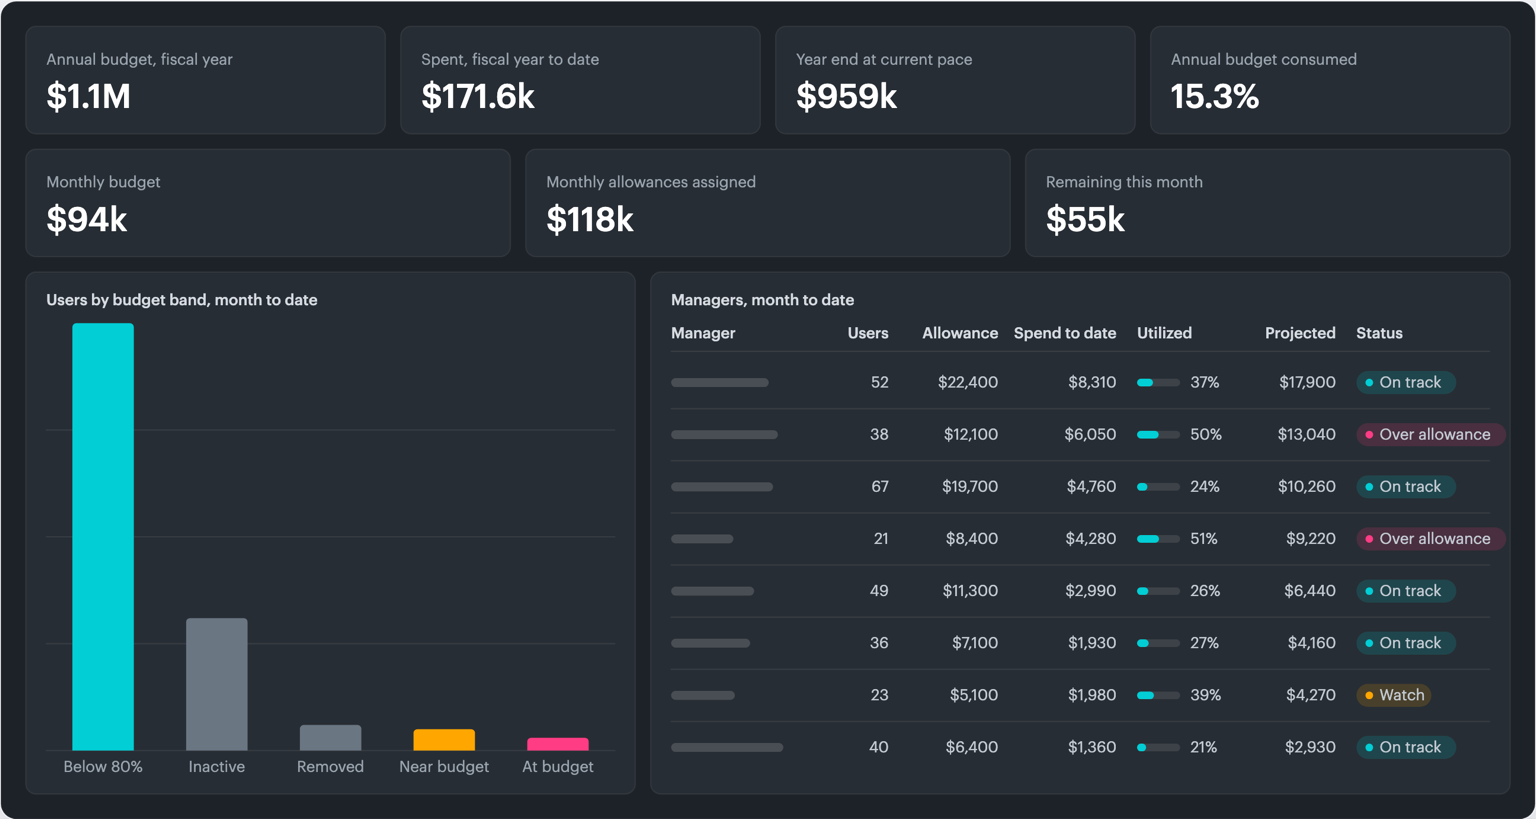
Illustration of the AI FinOps Command Center in Cloudaware: budget against actual and projected spend for the fiscal year, spend by team, and each team's allowance, utilization and status.
Three layers of KPIs connect token rates to business outcomes
With the foundations in place, AI efficiency KPIs sit in three layers. Read from the bottom up, they move from technical efficiency to business efficiency.
| Layer | Question it answers | Example KPIs | Typical owner |
|---|---|---|---|
| 1. Cost efficiency KPIs | How much of each provider's rate reductions does the workload capture? | Cache hit rate, batch share, commitment coverage, model mix | AI engineers, with FinOps |
| 2. Infrastructure unit cost | What does a unit of AI work cost, and how is that changing? | Cost per million tokens, per application | FinOps |
| 3. Business unit cost and value | Does AI spend return more than it costs? | Cost per business transaction, cost per successful outcome, value per AI dollar | Product and finance owners |
Each layer answers a question the others cannot. Layer 1 KPIs say nothing about value, and layer 3 cannot say why a margin moved. The layers work together: a signal in one sends the investigation to another.
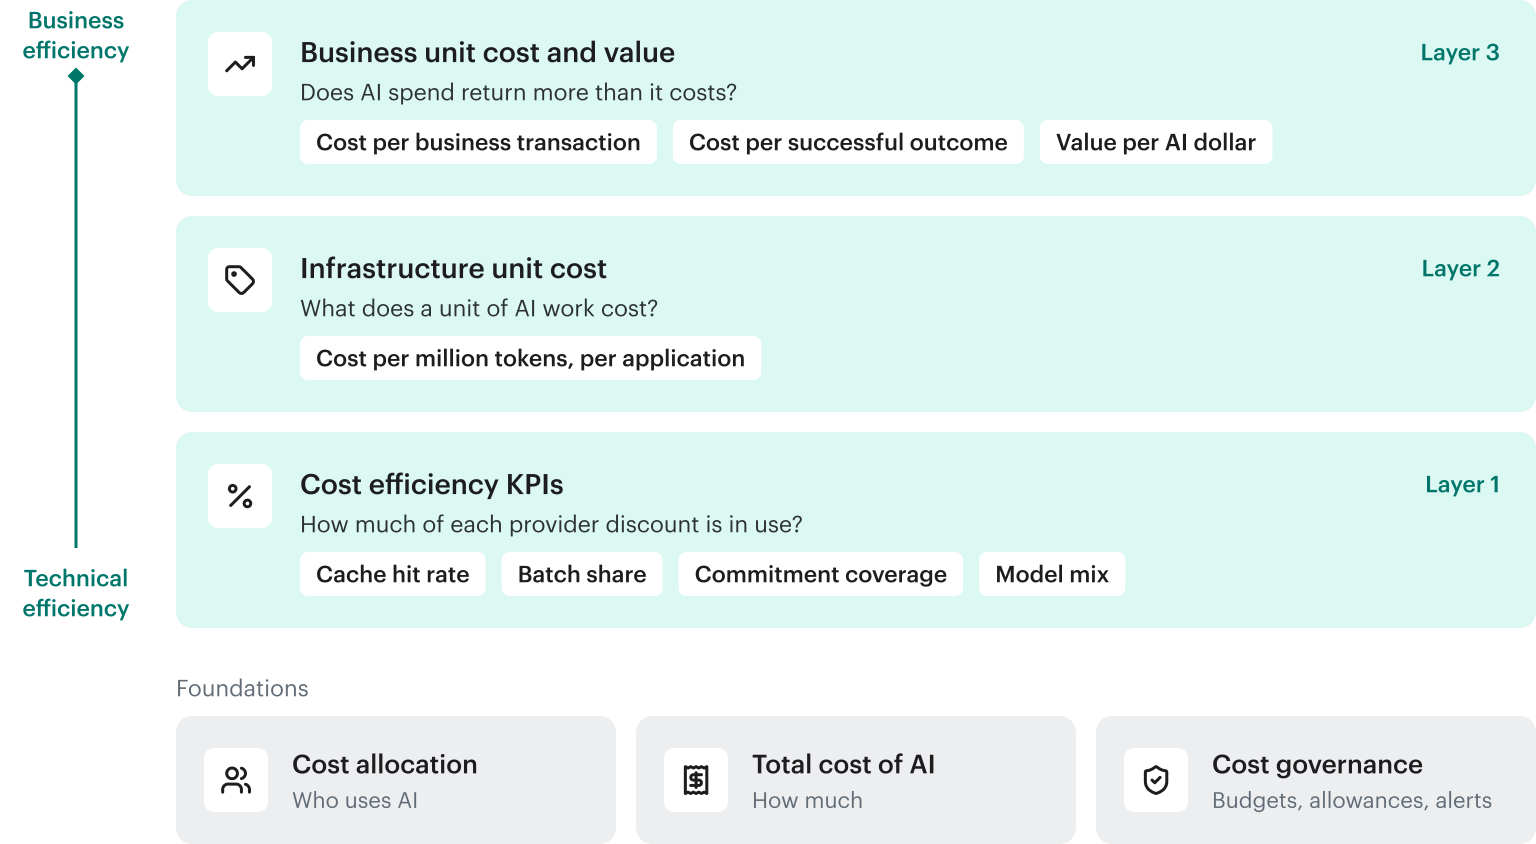
Diagram of the three-layer model: cost allocation, total cost of AI and cost governance underneath; cost efficiency KPIs, infrastructure unit cost and business unit cost above, each with the question it answers.
For agent workloads, the next step is comparing token cost versus token yield so token spend is evaluated against completed, merged, and value-producing work rather than token volume alone.
Layer 1: cost efficiency KPIs show how much of each provider discount is in use
Layer 1 turns each rate-optimization option a provider offers into a ratio. Using the option is an engineering choice; the ratio makes that choice measurable and comparable across teams. Prykhodko's rule for the layer is to turn every optimization opportunity into a KPI.
Cache hit rate
Prompt caching stores reusable context, such as system prompts, tool definitions and long reference documents, so later requests read it from cache instead of paying the full input rate. On Amazon Bedrock, cache reads are billed at a 90% discount compared to uncached input tokens, and cache writes at 1.25 times the input rate. Anthropic prices cache reads at 0.1 times the base input price on most models.
The KPI is cache read tokens divided by all input-side tokens: cache reads, uncached input and cache writes. A workload with long, stable prompts and a low rate has one of two problems. Either caching is not configured, or the prompt structure changes the cached prefix on every request.
Batch share
Work that does not need a real-time response, such as document processing or evaluation runs, can go through batch interfaces at half the on-demand price. Amazon Bedrock batch inference is priced 50% below on-demand for select models, and the Anthropic Message Batches API and the OpenAI Batch API carry the same 50% discount. The KPI is the share of token spend sent through batch rather than on-demand inference, read against the share of the workload that has no real-time requirement.
Commitment coverage for machine learning capacity
Self-hosted models and training jobs run on capacity that commitments can discount. Amazon SageMaker Savings Plans reduce cost by up to 64% on eligible machine learning instances in exchange for a one- or three-year commitment. The KPI is the same coverage measure FinOps already tracks for compute: the share of always-on machine learning capacity covered by a commitment. For coverage and utilization in general, see the cloud cost optimization playbook.
Model mix
The same task often runs acceptably on a smaller, cheaper model. Model mix is the share of each application's spend by model family, read against the tasks the application performs. A rising share of the most expensive model on a task that a smaller model handled before is a routing decision worth reviewing with the engineering owner.
How to implement layer 1
- Start from what engineers already optimize. FinOps practitioners work with the AI engineers and data scientists who run each application, list the rate options in use, and define one ratio per option.
- Measure from token-level usage data. Cache reads, cache writes, input, output and batch usage appear as separate usage types or fields in provider usage data. Each ratio needs them kept apart, not summed.
- Scale the KPI after it works for one team. A ratio defined with one application team becomes the standard for every application on the same provider.
How Cloudaware tracks layer 1
Cloudaware's efficiency scorecard keeps cache reads, cache writes, input and output as separate token types in the AI dataset, so the KPIs come straight from the billing data. It reports token spend, blended cost per million tokens, batch share of token spend, cache hit rate and Savings Plan coverage for machine learning capacity, each as a monthly trend. Filters by spend group, provider, account, service, model family, token type and inference type narrow each KPI to the slice under review.
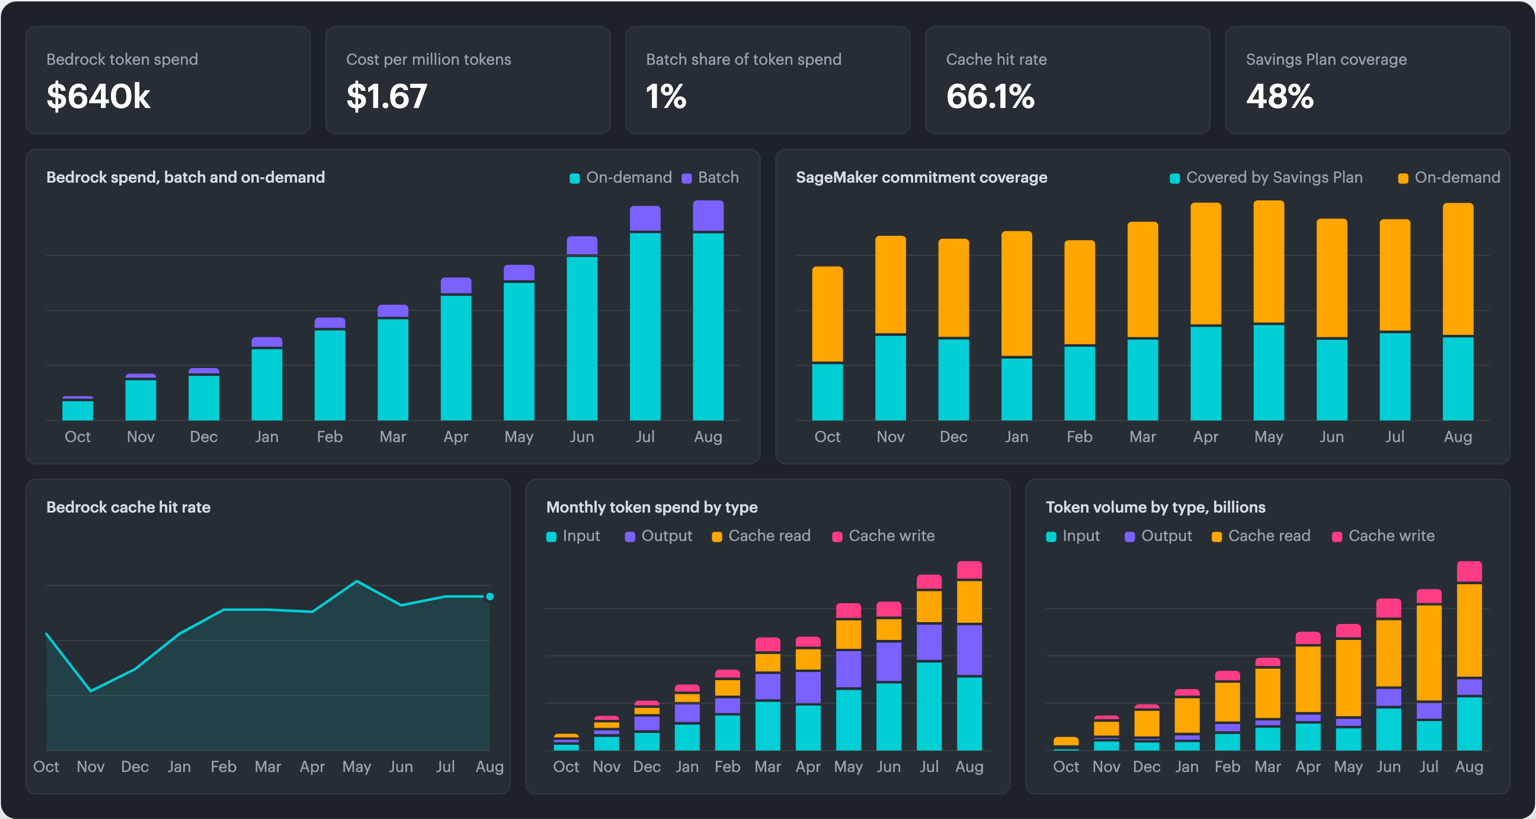
Illustration of the efficiency scorecard in Cloudaware: batch against on-demand spend, cache hit rate by month, token spend and token volume by type, and SageMaker Savings Plan coverage.
Possible pitfall to consider
Layer 1 KPIs measure optimization effort, not its effect. An application with a high cache hit rate still produces a larger bill if its request volume grows faster than the saving. The effect shows up in layer 2.
Layer 2: cost per million tokens shows a workflow change that total spend hides
Tokens are the main pricing unit for AI, which makes cost per million tokens the natural infrastructure unit cost. Prykhodko calls it the bridge metric because it connects the technical KPIs of layer 1 to the business measures of layer 3.
What cost per million tokens does and does not measure
Cost per million tokens does not measure value. It also does not compare cleanly across models: tokenizers differ between model families, and a more expensive model that finishes a task in fewer calls can cost less per outcome than a cheaper one.
Its strength is direction. One month's figure for one application says little. The same figure tracked per application over several months shows when the cost of a unit of AI work changes, and a change means the workflow behind the application changed.
Reading a change in the trend
| Change in cost per million tokens | Where to look next |
|---|---|
| Rising, with no planned change | Layer 1: cache hit rate, batch share, model mix, the ratio of output to input tokens |
| Rising after a planned model switch | Layer 3: whether the new model's outcomes justify the higher unit cost |
| Flat or falling while total spend rises | Volume: requests per day and model calls per request |
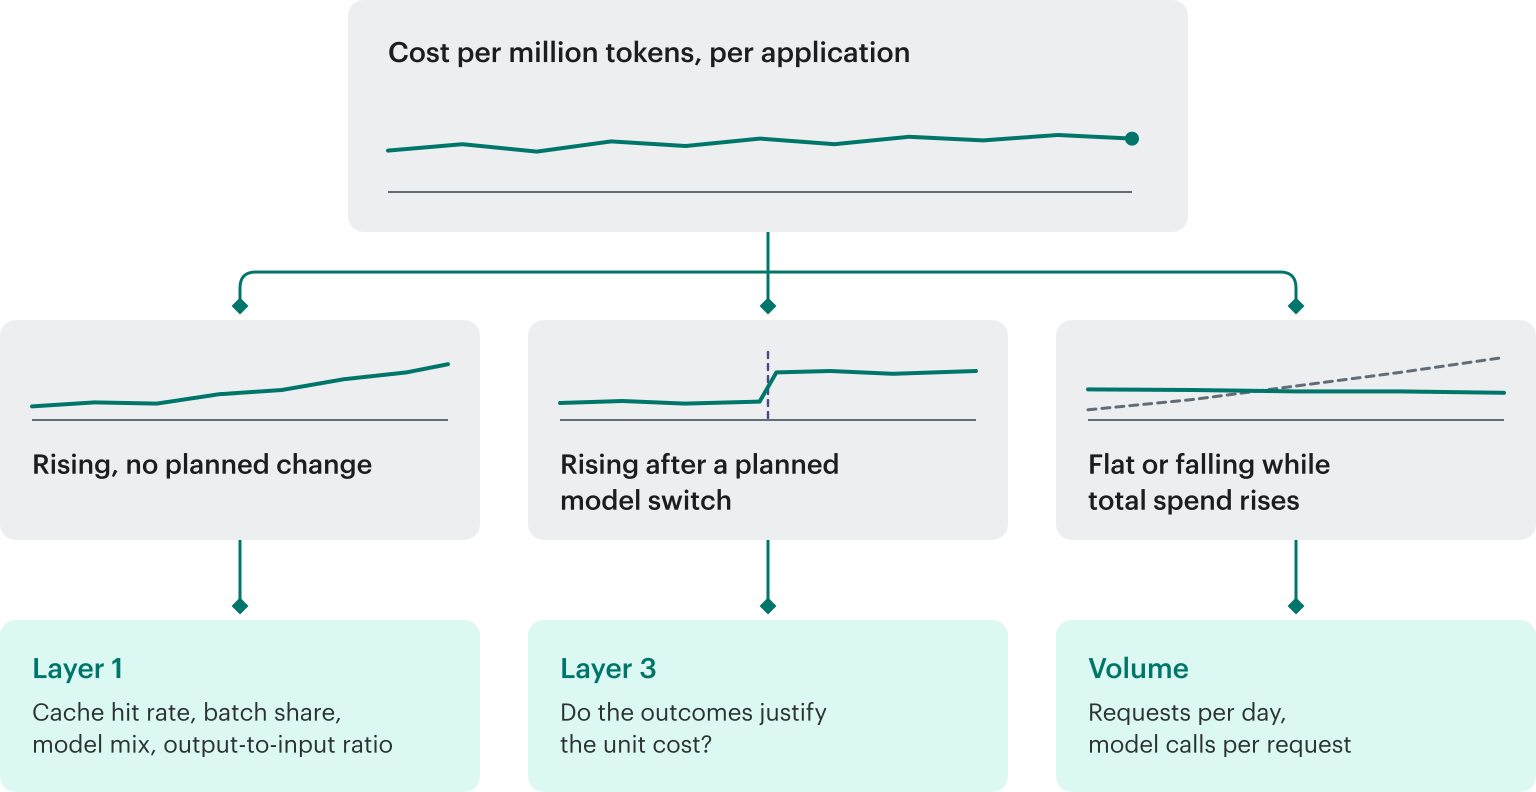
Diagram of how a change in cost per million tokens is read: a rise with no planned change goes to layer 1, a rise after a planned model switch goes to layer 3, and a flat unit cost under rising spend goes to volume.
How to implement layer 2
- Compute it per application, not per account. An account-level figure blends workloads with different models and prompt designs, so a change in one is hidden by the others.
- Keep model and provider as dimensions. A trend split by model shows whether a rise came from the model mix or from a price change on one model.
- Review it on a fixed cadence. Comparing each month with the months before it turns the metric into a trigger for investigation rather than a line in a report.
How Cloudaware tracks layer 2
The AI Model Dashboard in Cloudaware reports blended cost per million tokens for the last 30 days against the previous period, next to spend and token volume by model family, by provider and by application. The model table lists every model in use with its provider, the cloud or vendor it runs on, its token count and its cost, so a change in the trend traces to the model and the application that moved it.
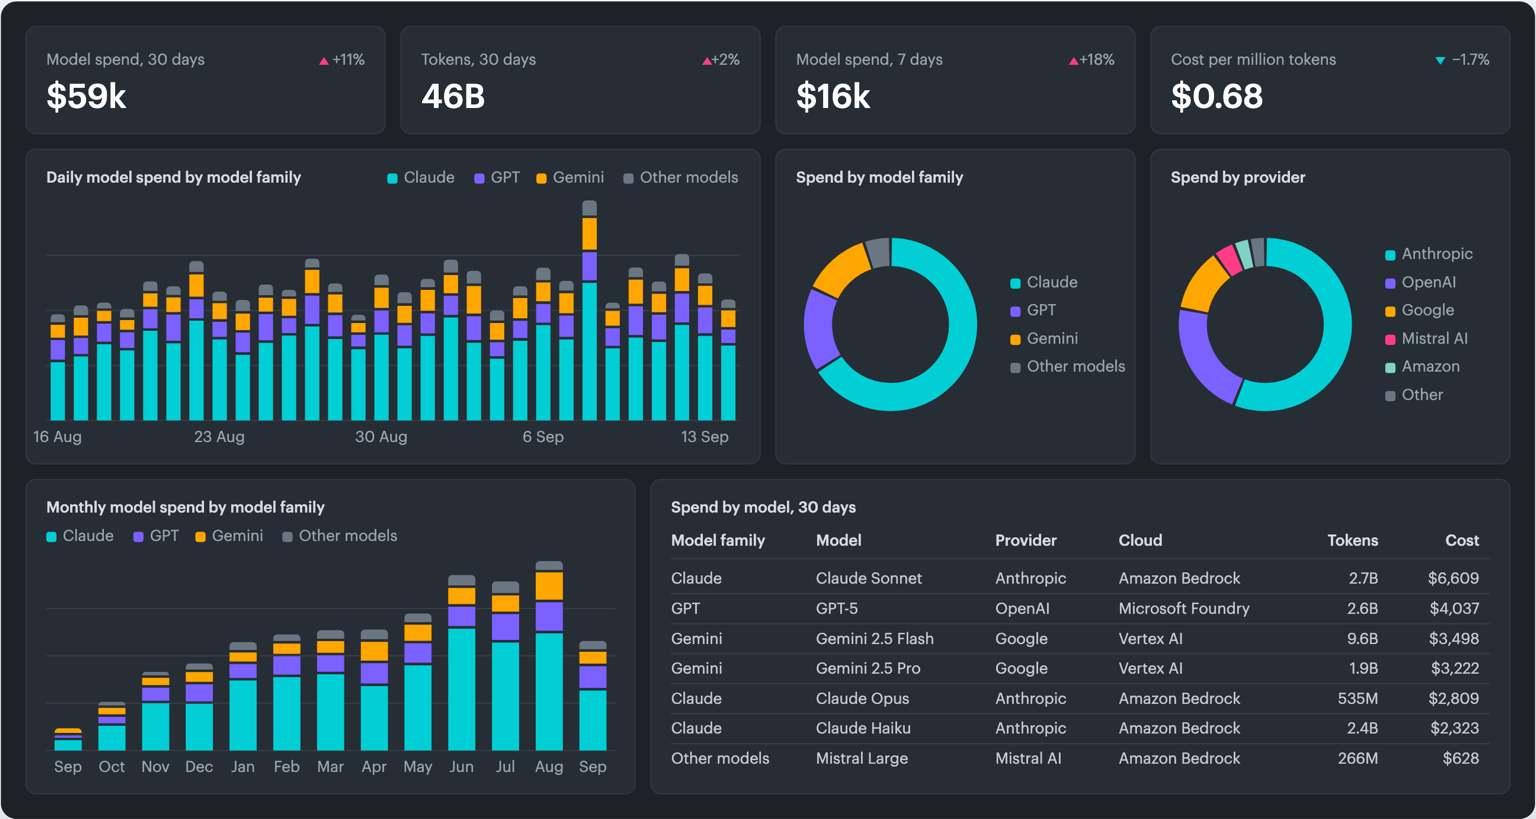
Illustration of the AI Model Dashboard in Cloudaware: AI model spend and tokens with period-over-period change, blended cost per million tokens, spend by model family and provider, and cost per model across Amazon Bedrock, Microsoft Foundry and Vertex AI.
Layer 3: business unit cost shows which AI applications to scale
Layer 3 connects AI spend to the business. Two kinds of measure belong here.
Business unit cost
Business unit cost is classic unit economics: AI cost divided by a business driver the application serves, such as cost per support conversation or cost per document processed. The driver comes from the application or a business system; the cost comes from the allocated AI spend in the foundations. For agent workloads, the most useful driver is the successful task: cost per successful outcome counts every model call an agent made, including retries and failed attempts, against the tasks it completed.
Value delivered
The second measure is the value AI produces, such as labor hours saved on a task or support tickets resolved without a person. These numbers come from the systems where the work happens, such as the ticketing system or the time-tracking system, and the definitions belong to product and business owners. Agreeing on them is usually the hardest part of layer 3. For how FinOps divides this work with product and finance, see FinOps personas.
How Cloudaware tracks layer 3
Cloudaware's unit economics capability ingests a business signal through a Data Manager recipe and uses it as the allocation key: conversations, documents processed, completed agent tasks or tickets resolved. AI cost per business unit then comes from the same dataset as the allocation, the budgets and the layer 1 and layer 2 KPIs, and value measures from the ticketing or time-tracking system sit next to the cost they are compared with.
The one-more-dollar test
With business unit cost and value on the same basis, each AI application can go through one test: does one more dollar of AI spend generate more than one dollar of outcomes?
- Yes: the application can scale with confidence.
- No: layer 1 shows where margin can be recovered, through caching, batch or model choice.
- No, and layer 1 is exhausted: the application spends budget without return and is a candidate to stop.
Possible pitfall to consider
A KPI that never changes a decision is a vanity metric. If a measure cannot move an application toward scaling, optimization or a stop, it does not belong in the review.
Four steps to start measuring AI unit economics
- Set up the foundations. Allocation, total cost and governance are the base every KPI is built on. Without them, a ratio has no owner.
- Score each AI workload through the three layers. Start with the applications that carry the most spend, define their layer 1 ratios with the engineering owners, and put cost per million tokens per application on the monthly FinOps review. For AI spend that runs only on AWS, the open-source CUDOS dashboard from Cloud Intelligence Dashboards provides layer 1 and layer 2 KPIs and can be extended to layer 3.
- Run the one-more-dollar test before scaling. A workload that cannot show more than a dollar of outcome per dollar of spend is optimized or stopped first.
- Drop KPIs that cannot drive a decision. A metric that never changes what anyone does costs review time and adds nothing.
Prykhodko closes the model on one line: cheap tokens are not the goal, efficient value is. Organizations that run AI across several clouds and direct vendor APIs need the three layers over a dataset that spans every provider.
Measure AI unit economics across every AI provider with Cloudaware
Cloudaware brings AI spend into the FinOps platform that already governs cloud spend, and covers all three layers and the foundations under them on one dataset. It consumes billing data from Amazon Bedrock, Vertex AI, Microsoft Foundry, OpenRouter, Anthropic and OpenAI, generates a FOCUS dataset from their metering data, allocates every line of AI spend to the application, team and owner that consume it, and reports the efficiency, unit cost and business KPIs on top.
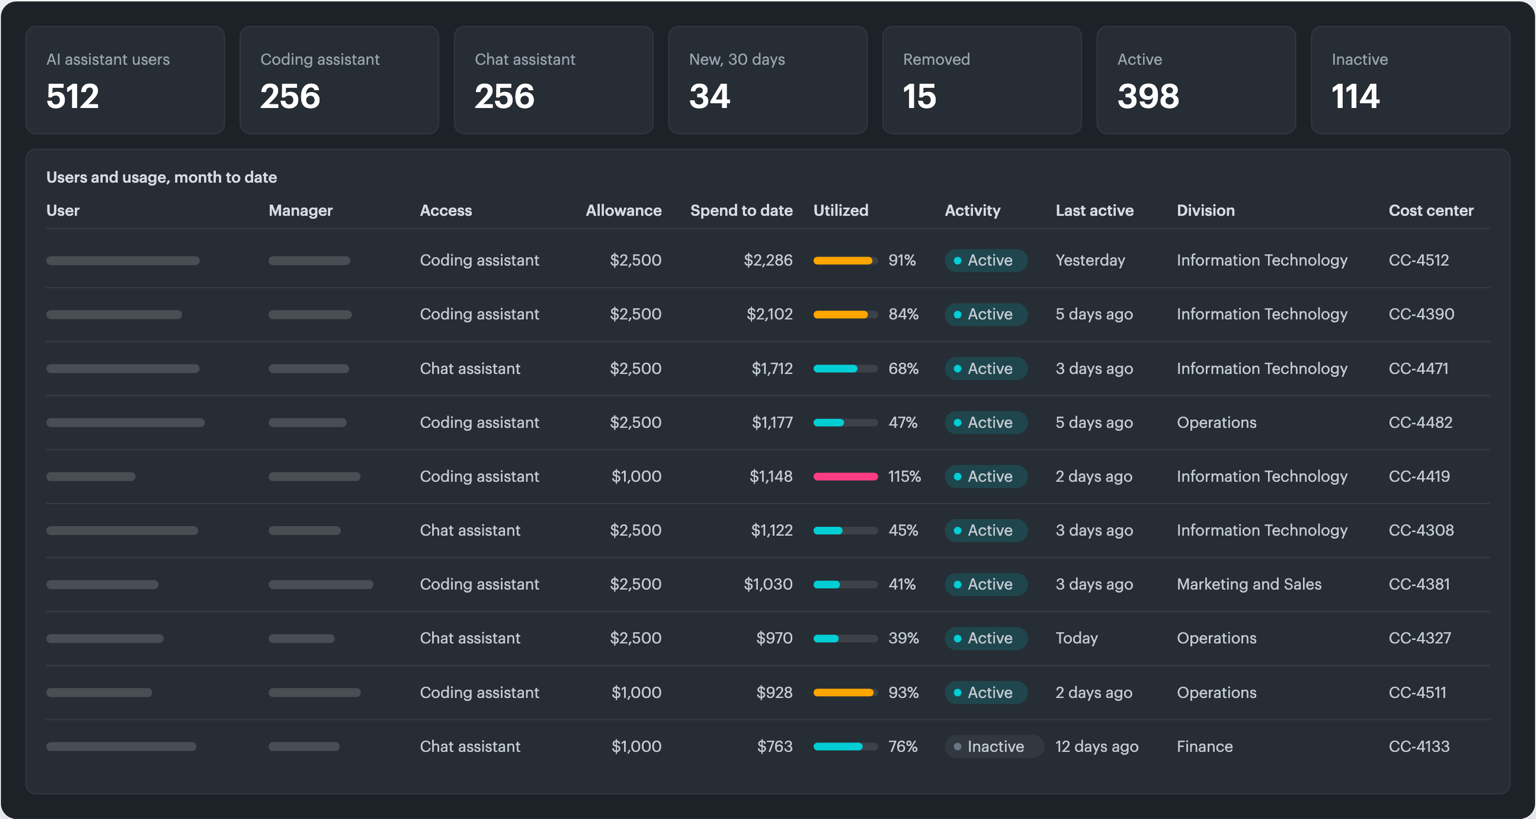
Illustration of the Users & Usage view of the AI FinOps Command Center in Cloudaware: AI assistant users by access type, spend against allowance per user, and the division and cost center each user maps to.
Core capabilities:
- AI cost allocation: AI spend lands on applications, teams and owners through the service catalog and multi-signal mapping, and shared keys and multi-agent workflows are split by the application's own usage signal, with showback and chargeback on the result.
- Efficiency scorecard: cache hit rate, batch share, blended cost per million tokens and Savings Plan coverage for machine learning capacity, by provider, account, service and model family.
- AI Model Dashboard: spend, token volume, model mix and cost per million tokens by model, provider and application, with period-over-period change.
- Unit economics: business drivers and value measures, from conversations and documents to completed agent tasks and tickets resolved, ingested as allocation keys, so cost per business unit and cost per successful outcome come from the same dataset.
- AI FinOps Command Center: budgets and token allowances per team and per user, projected month-end spend, and alerts on teams projected over their allowance.
- Anomaly detection: AI spend spikes flagged with the responsible application and owner already attached, and a triage playbook for the response.
Cloudaware does not decide which AI applications to scale or what counts as business value for each of them. Those remain decisions for the product and finance owners of each application.