


Owning the cloud bill? Azure cloud cost optimization becomes job #2. Flexera’s 2025 report shows 84% of orgs struggle with spend and overshoot budgets by ~17%.
This is for FinOps, DevOps, and architects steering RI/SP and Microsoft enterprise estates.
Cloudaware plugs in AWS CUR, Azure Cost exports, and GCP billing, so every resource has an owner—that’s how our users start fixing these problems. These 11 practices come from ITAM teammates with 10+ years of experience, Cloudaware client reviews, and FinOps Foundation and ProsperOps sessions about runaway storage.
We’re talking real Azure cloud headaches: EA vs MCA, forgotten AKS clusters, and premium disks on sleepy dev boxes.
In the article you’ll see
- where cloud cost blow-ups start,
- which alerts fired,
- and which FinOps processes changed behavior.
- touch commitments, Kubernetes chargeback,
- and where spot capacity works without waking you at 3 a.m.
Let’s start with the most popular issue—cost visibility 👇
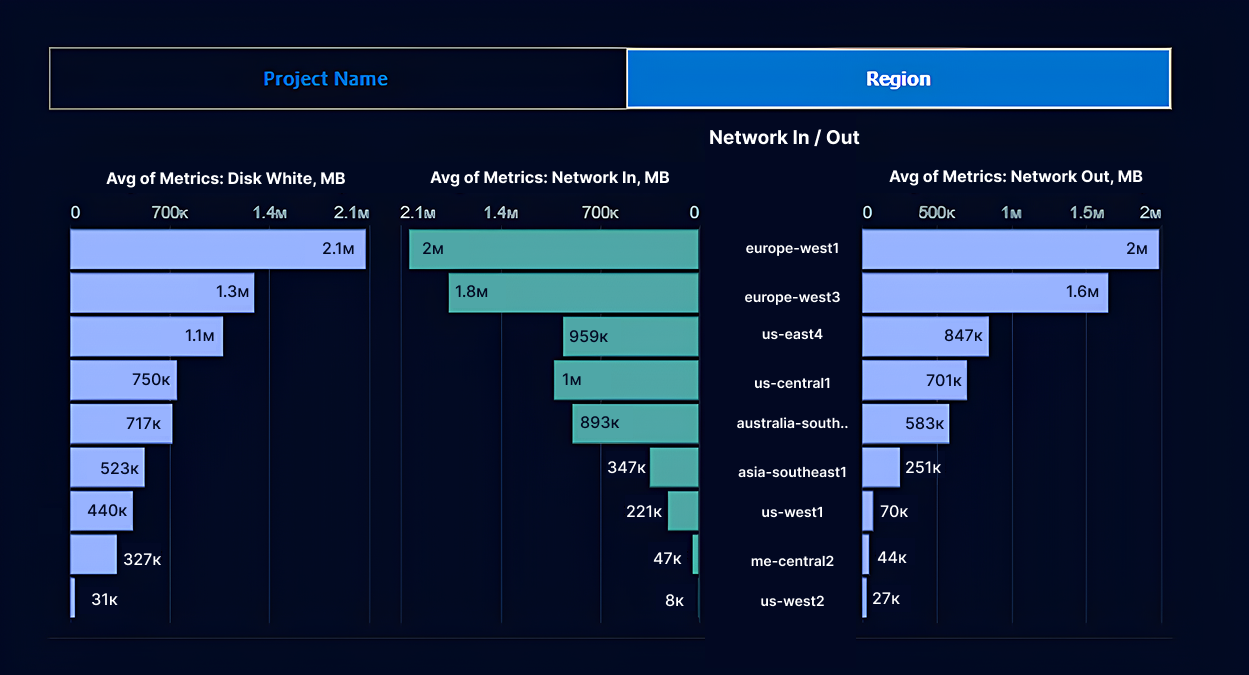
#1 Centralize Azure cost visibility across subscriptions and tenants
You know that moment in a cloud cost optimization Azure review when Finance asks, “Okay, but how much are we spending per product?” and twelve different subscription owners send twelve different screenshots?
Flexera’s 2025 State of the Cloud report says 84% of orgs now list managing cloud spend as their top challenge and are overshooting budgets by 17%.
In a lot of estates, you’ve got EA/MCA agreements on one side, PAYG sprawl on another, a CSP partner for a specific region. Plus a second tenant for regulated workloads in Azure. Every new initiative got its own subscription, but nobody ever stitched those views back together.
The raw billing data lives everywhere: EA and MCA portals, Cloud Cost Management + Billing, CSV exports dropped into storage accounts. And maybe a BI tool someone in finance set up years ago to tame the cloud invoices. Each team lives in its own dashboard, which feels fine… right up until an exec wants a single number.
Lack of centralized views isn’t just annoying; it’s expensive. Faddom’s 2025 roundup cites Anodot data showing that 54% of wasted spend comes from lack of visibility into costs. When you can’t see everything in one place, zombie VMs, forgotten PaaS plans, and duplicate environments happily survive quarter after quarter.
Meanwhile, your hierarchy is working against you. Management groups, subscriptions, and resource groups were designed for governance, not reporting, so resources that belong to one product might sit in three different subscriptions and five different RGs. Untangling that with ad hoc queries is why your FinOps reviews start late and end with, “*We’ll follow up on a spreadsheet.*”
The billing layer adds even more friction. EA price sheets, MCA rate cards, PAYG rates, Marketplace charges, reservations, Savings Plans. Every contract and offer shape slightly changes effective pricing, which makes side-by-side comparisons for execs painful.
From a FinOps perspective, centralizing data is literally step zero in the Inform phase before any serious cost optimization work. The FinOps Framework calls out “gather cloud billing data” into a single tool that can ingest and normalize it before you allocate, forecast, or set budgets.
This is where Cloudaware quietly earns its keep.
You export all Azure cost data (EA/MCA/PAYG) in the formats Microsoft recommends, send it alongside AWS and GCP billing, and Cloudaware ingests it into one normalized model. Then it decorates that with CMDB context: apps, owners, environments, tags, and on-prem relationships.
Outcome: a single dashboard that actually answers, *“What’s our total spend per product and team, across every subscription and tenant?*” instead of twelve contradictory charts.
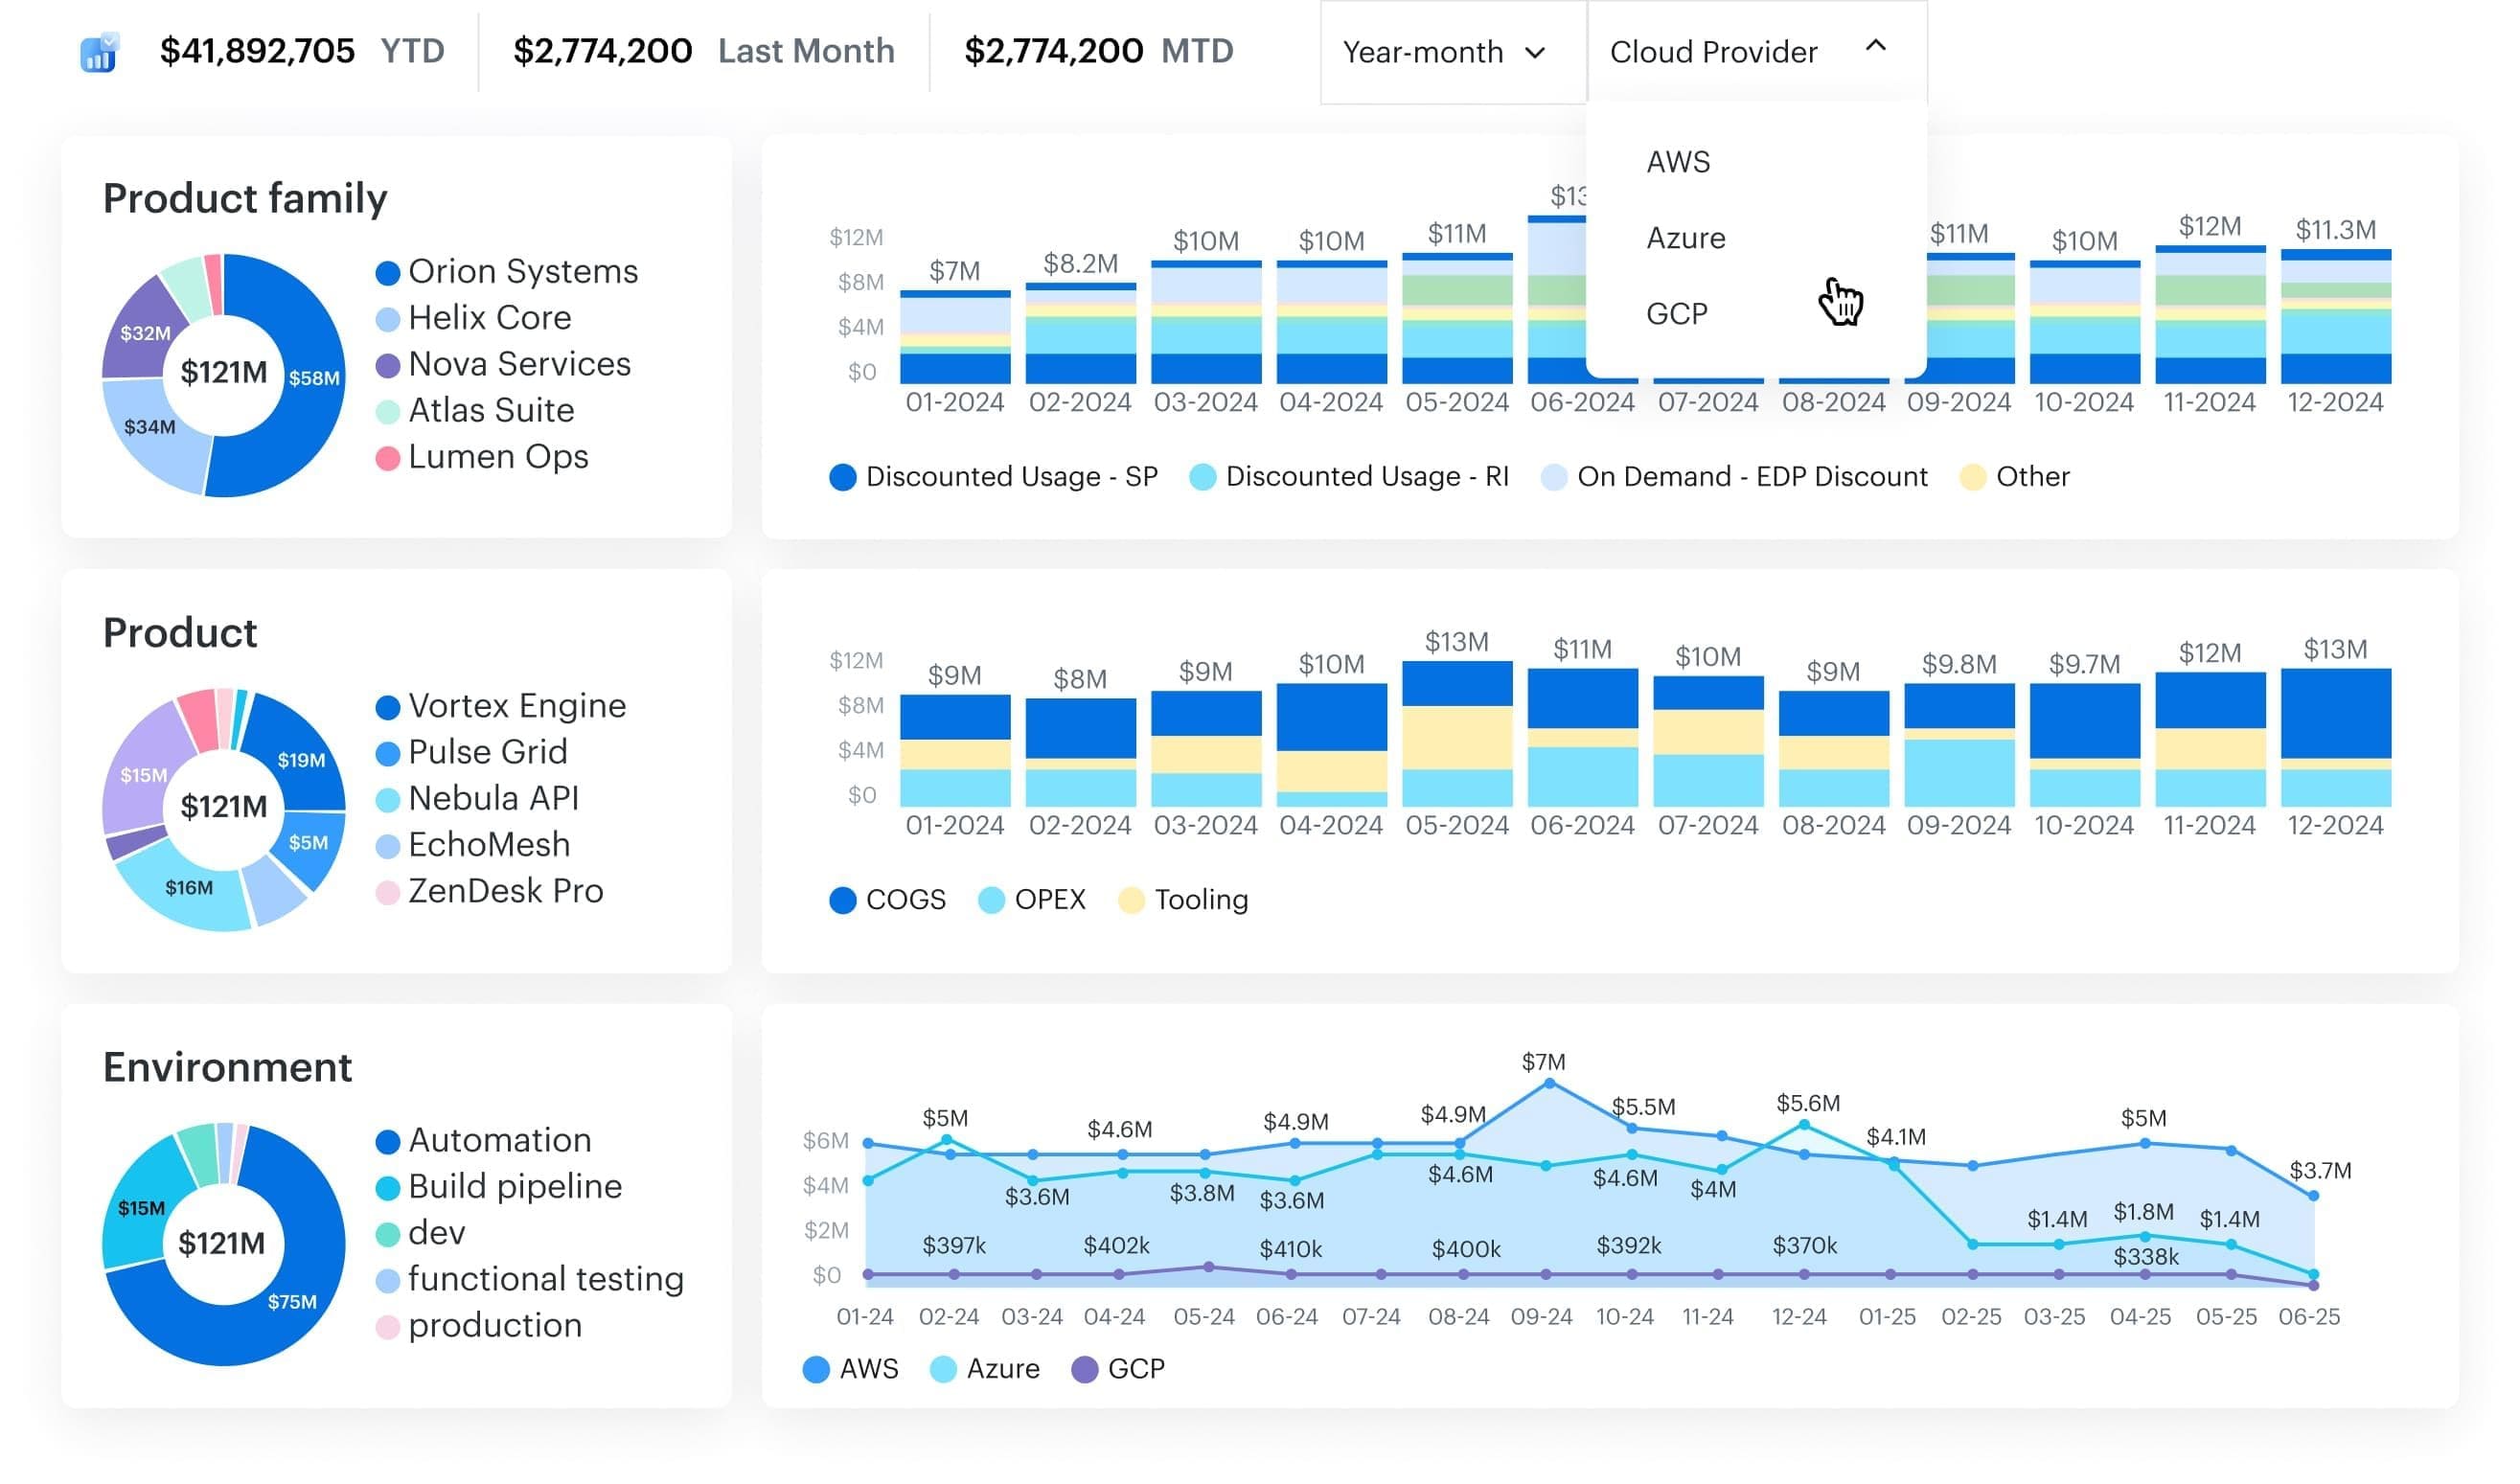
Cloudaware report element. Sschedule a demo to see it live
Once that centralized management view exists, the next question becomes way more interesting—and way more political: who actually owns which slice of that bill? That’s where the next best practice kicks in 👇
#2 Make cost allocation non-negotiable (apps, teams, environments)
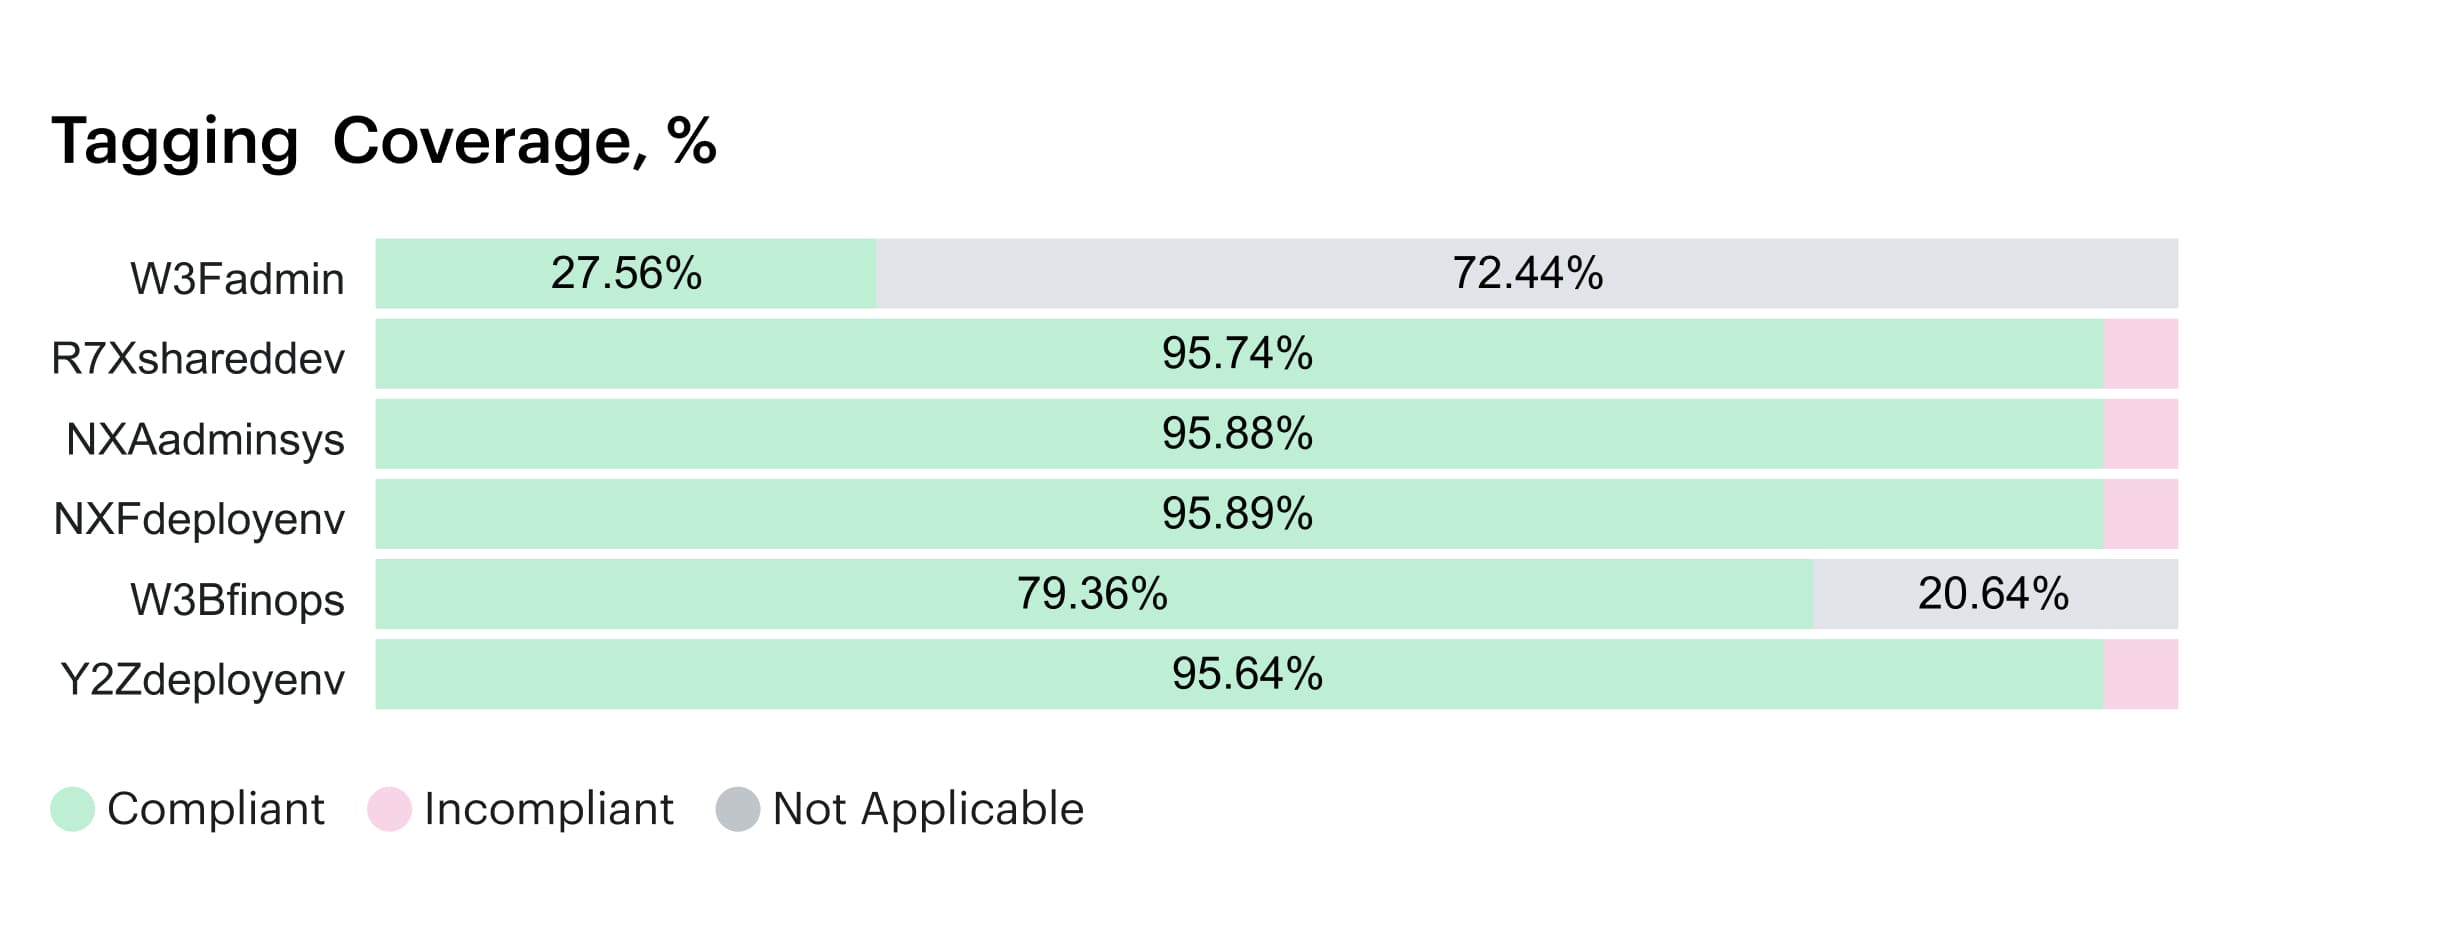
Have you ever experienced the moment when Finance requests product-level showback, and you discover that half of your Azure bill is still categorized as "Other" or "Unassigned"? In Cloudaware FinOps clients’ practices, we usually see 26–32% of spend sitting in the unallocated bucket, and tag coverage stuck around 70–75%.
From a FinOps perspective, the inability to reliably slice your cloud invoice by app, team, and environment prevents you from running real showbacks or chargebacks. The FinOps Foundation’s Allocation capability literally defines the practice as assigning spend to the people accountable for it using accounts, tags, labels, and metadata.
IDC estimates that 20–30% of cloud spending is wasted; poor tagging and unallocated costs are a big part of why engineering and Finance argue over every variance review.
So you make a minimal tagging schema non-negotiable for all billable resources: application, service, environment, owner_email, cost_center. FinOps and vendor guides line up on this pattern because it’s the smallest set that lets you tie spend to real owners and products.
Shared services are where many teams stumble. Microsoft’s own docs now ship cost allocation rules so central VNETs, gateways, and shared SQL can be split by tag, subscription, or usage—perfect when you want to spread “SQL-shared-eastus” without inventing shadow pricing models.
Read also: 7 Cloud Cost Allocation Strategies in 2026
Next, you prepare the data for delivery. Azure Policy plus Terraform/Bicep checks mean no required tags, no merge. Tagging moves from “we’ll fix it later” to a front-door cost optimization control in your CI/CD.
Cloudaware then does the heavy lifting on Azure cost attribution.
It ingests Azure billing and usage, normalizes tags, and merges everything with the CMDB so every line item can roll up cleanly to an app, service, and owner—down to shared DBs split 40/60 between two products.
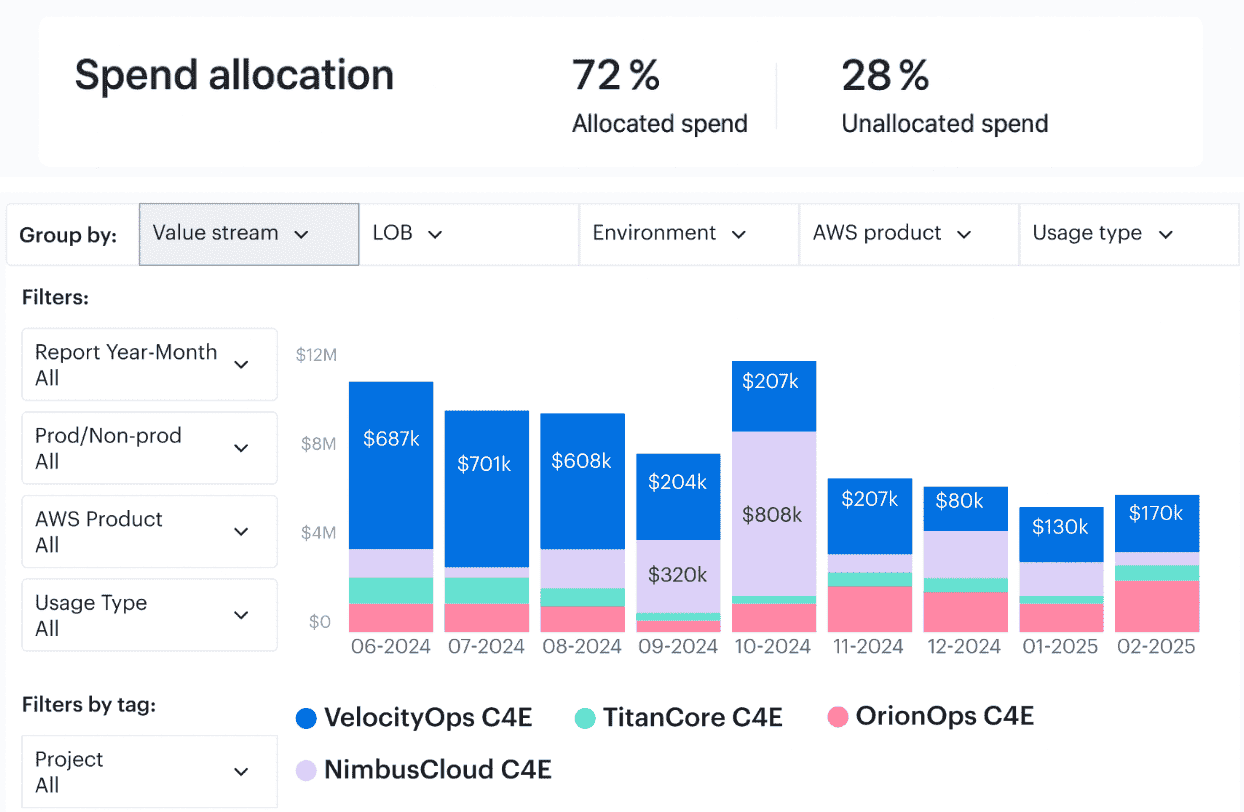
Cloudaware report elements. Schedule a demo to see it live
Once that allocation picture is stable and sitting in shared FinOps management dashboards, the next question you’ll get is simple: “Cool. Now, which computation do we shrink first?”
That’s exactly where the next best practice kicks in 👇
#3 Rightsize Azure compute continuously, not once a quarter
Think about your incident review: everyone swore, “We’ll rightsize next sprint,” and then nothing changed. Teams chasing Azure cloud cost optimization keep launch-week capacity forever and watch the bill climb.
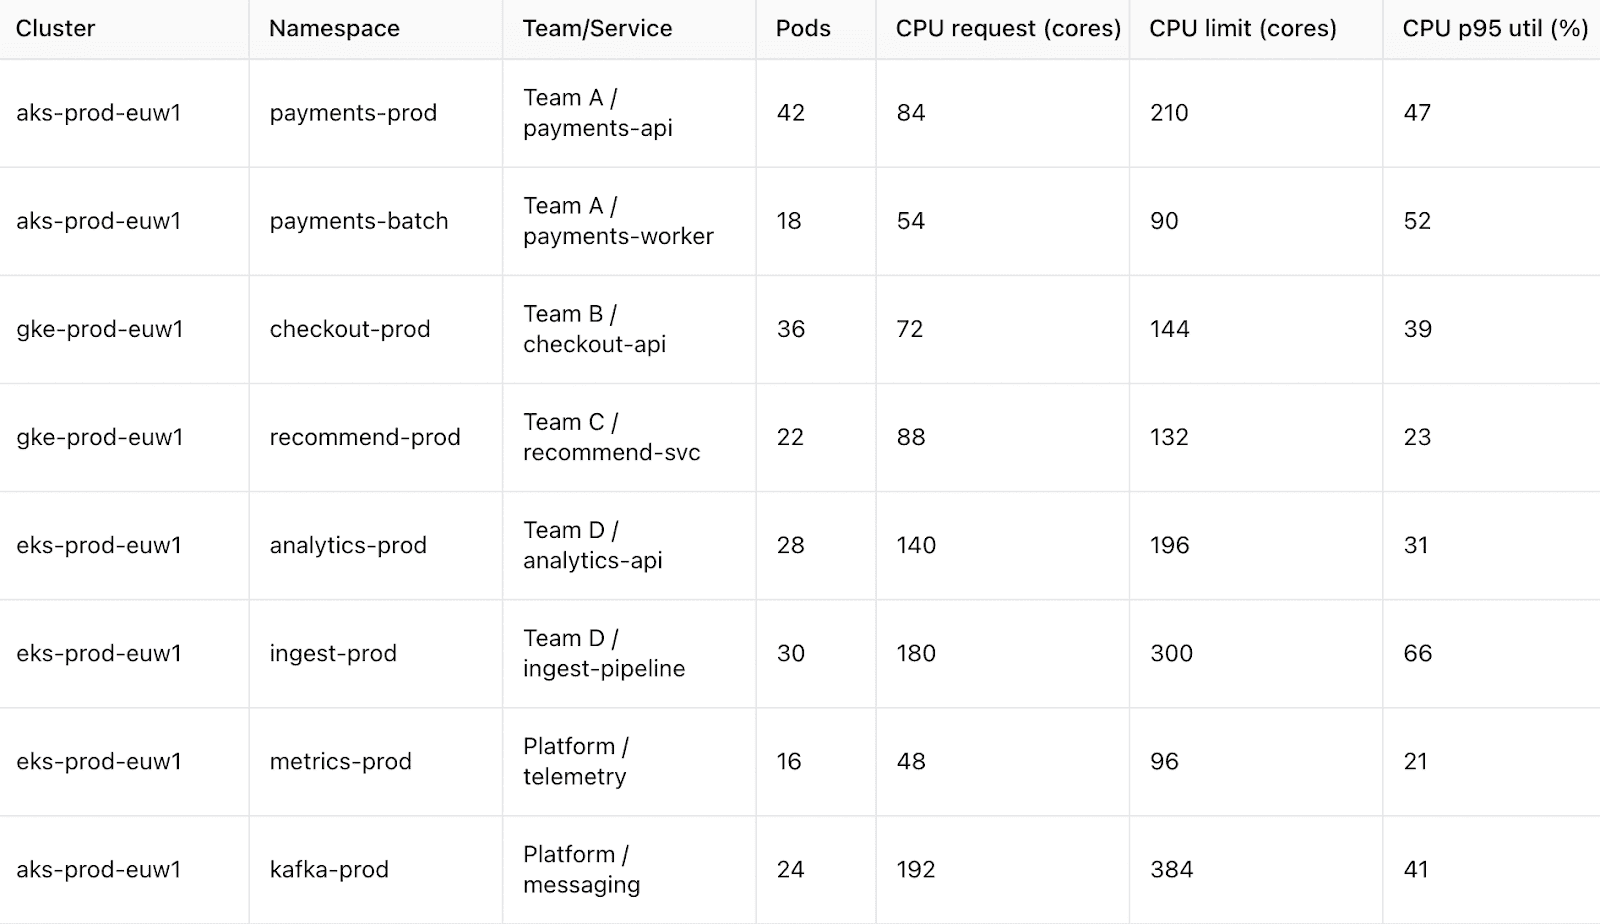
On most estates, D-series VMs sit at 8–12% CPU, VM Scale Sets never scale back, and AKS node pools run larger than live traffic needs.
Rightsizing gaps are why analysts keep finding 30% of public cloud spend wasted on over-provisioned compute—a chance to reclaim budget.
This is where long-window telemetry helps: 30–90 day CPU, memory, and disk I/O from the monitoring service show which shapes shrink safely so performance holds and infrastructure costs match demand.
Line those graphs up per VM, VMSS, and AKS pool, and the quiet resources pop: weekend-idle workers, staging clusters at single-digit CPU, and forgotten jump boxes humming along.
Sometimes the answer is a straight size drop; other times you switch families to better match memory or storage patterns and stay ahead of pricing shifts.
In FinOps terms, you turn rightsizing into a recurring cost optimization motion: weekly backlogs ranked by savings, monthly variance reviews, and clear owners who know which fleets to touch first.
Cloudaware ingests billing and CPU utilization, merges them with the CMDB, and surfaces “Top 50 underutilized VMs” or “AKS node pools with >50% headroom,” so every Azure cost discussion starts with a shortlist.
Cloudaware report element. Schedule a demo to see it live
Once that rhythm lands, capacity management stops being a yearly clean-up and becomes a normal delivery conversation—setting you up for the next move 👇
Read also: 10 Cloud Cost Analysis Tools for FinOps for 2026
#4 Park and schedule non-production Azure workloads by default
Here’s the quiet killer for Azure cloud cost optimization: every dev, test, and staging environment running 24/7 “just in case.” Organizations waste ~32% of their budget on underused infrastructure, and non-production environments alone can represent ~27% of overall infra spend when they’re left always on.
In your Azure estate, that usually looks like separate -dev / -test subscriptions, a couple of legacy sandboxes, and “temporary” pilots that somehow survived three quarters. No one wants to risk breaking a pipeline, so everything stays powered up by default.
Across the wider cloud landscape, Stacklet and Flexera surveys keep repeating the same story: the bulk of waste comes from idle or underused environments that nobody bothered to schedule, even though they’re the safest place to experiment with automation.
The fix starts with simple classification. Label every non-prod subscription and set environment=dev or environment=stage so you can safely segment that slice of costs from mission-critical workloads and treat it as a playground for aggressive scheduling.
Once that’s clear, you add calendars. Auto-stop VMs after business hours, shut them all down over weekends, and use login/API inactivity rules to gracefully power down anything nobody has touched. AKS dev clusters are perfect resources for this: let node pools sleep at night while your engineers do.
Vendors and Microsoft both highlight that dev/test subscriptions and PaaS services offer generous dev/test pricing and scale-to-zero patterns, which get real savings only when you actually stop running them 168 hours a week.
FinOps guidance calls scheduling non-prod one of the highest-ROI cost optimization wins: teams routinely reclaim 20–40% of their infra bill by automating off-hours shutdowns before touching production at all.
Cloudaware ingests Azure billing data and resource/CI inventory via APIs, maps everything into a single CMDB, and lets you filter out all non-prod workloads into one “non-prod Azure cost” view.
Then feed that list into runbooks, Azure Automation, or your preferred scheduler—instead of rebuilding ad hoc reports per subscription.
Once non-prod is napping on autopilot, and you’ve locked in that operational management habit, the next logical move is to tackle the other big sinkhole 👇
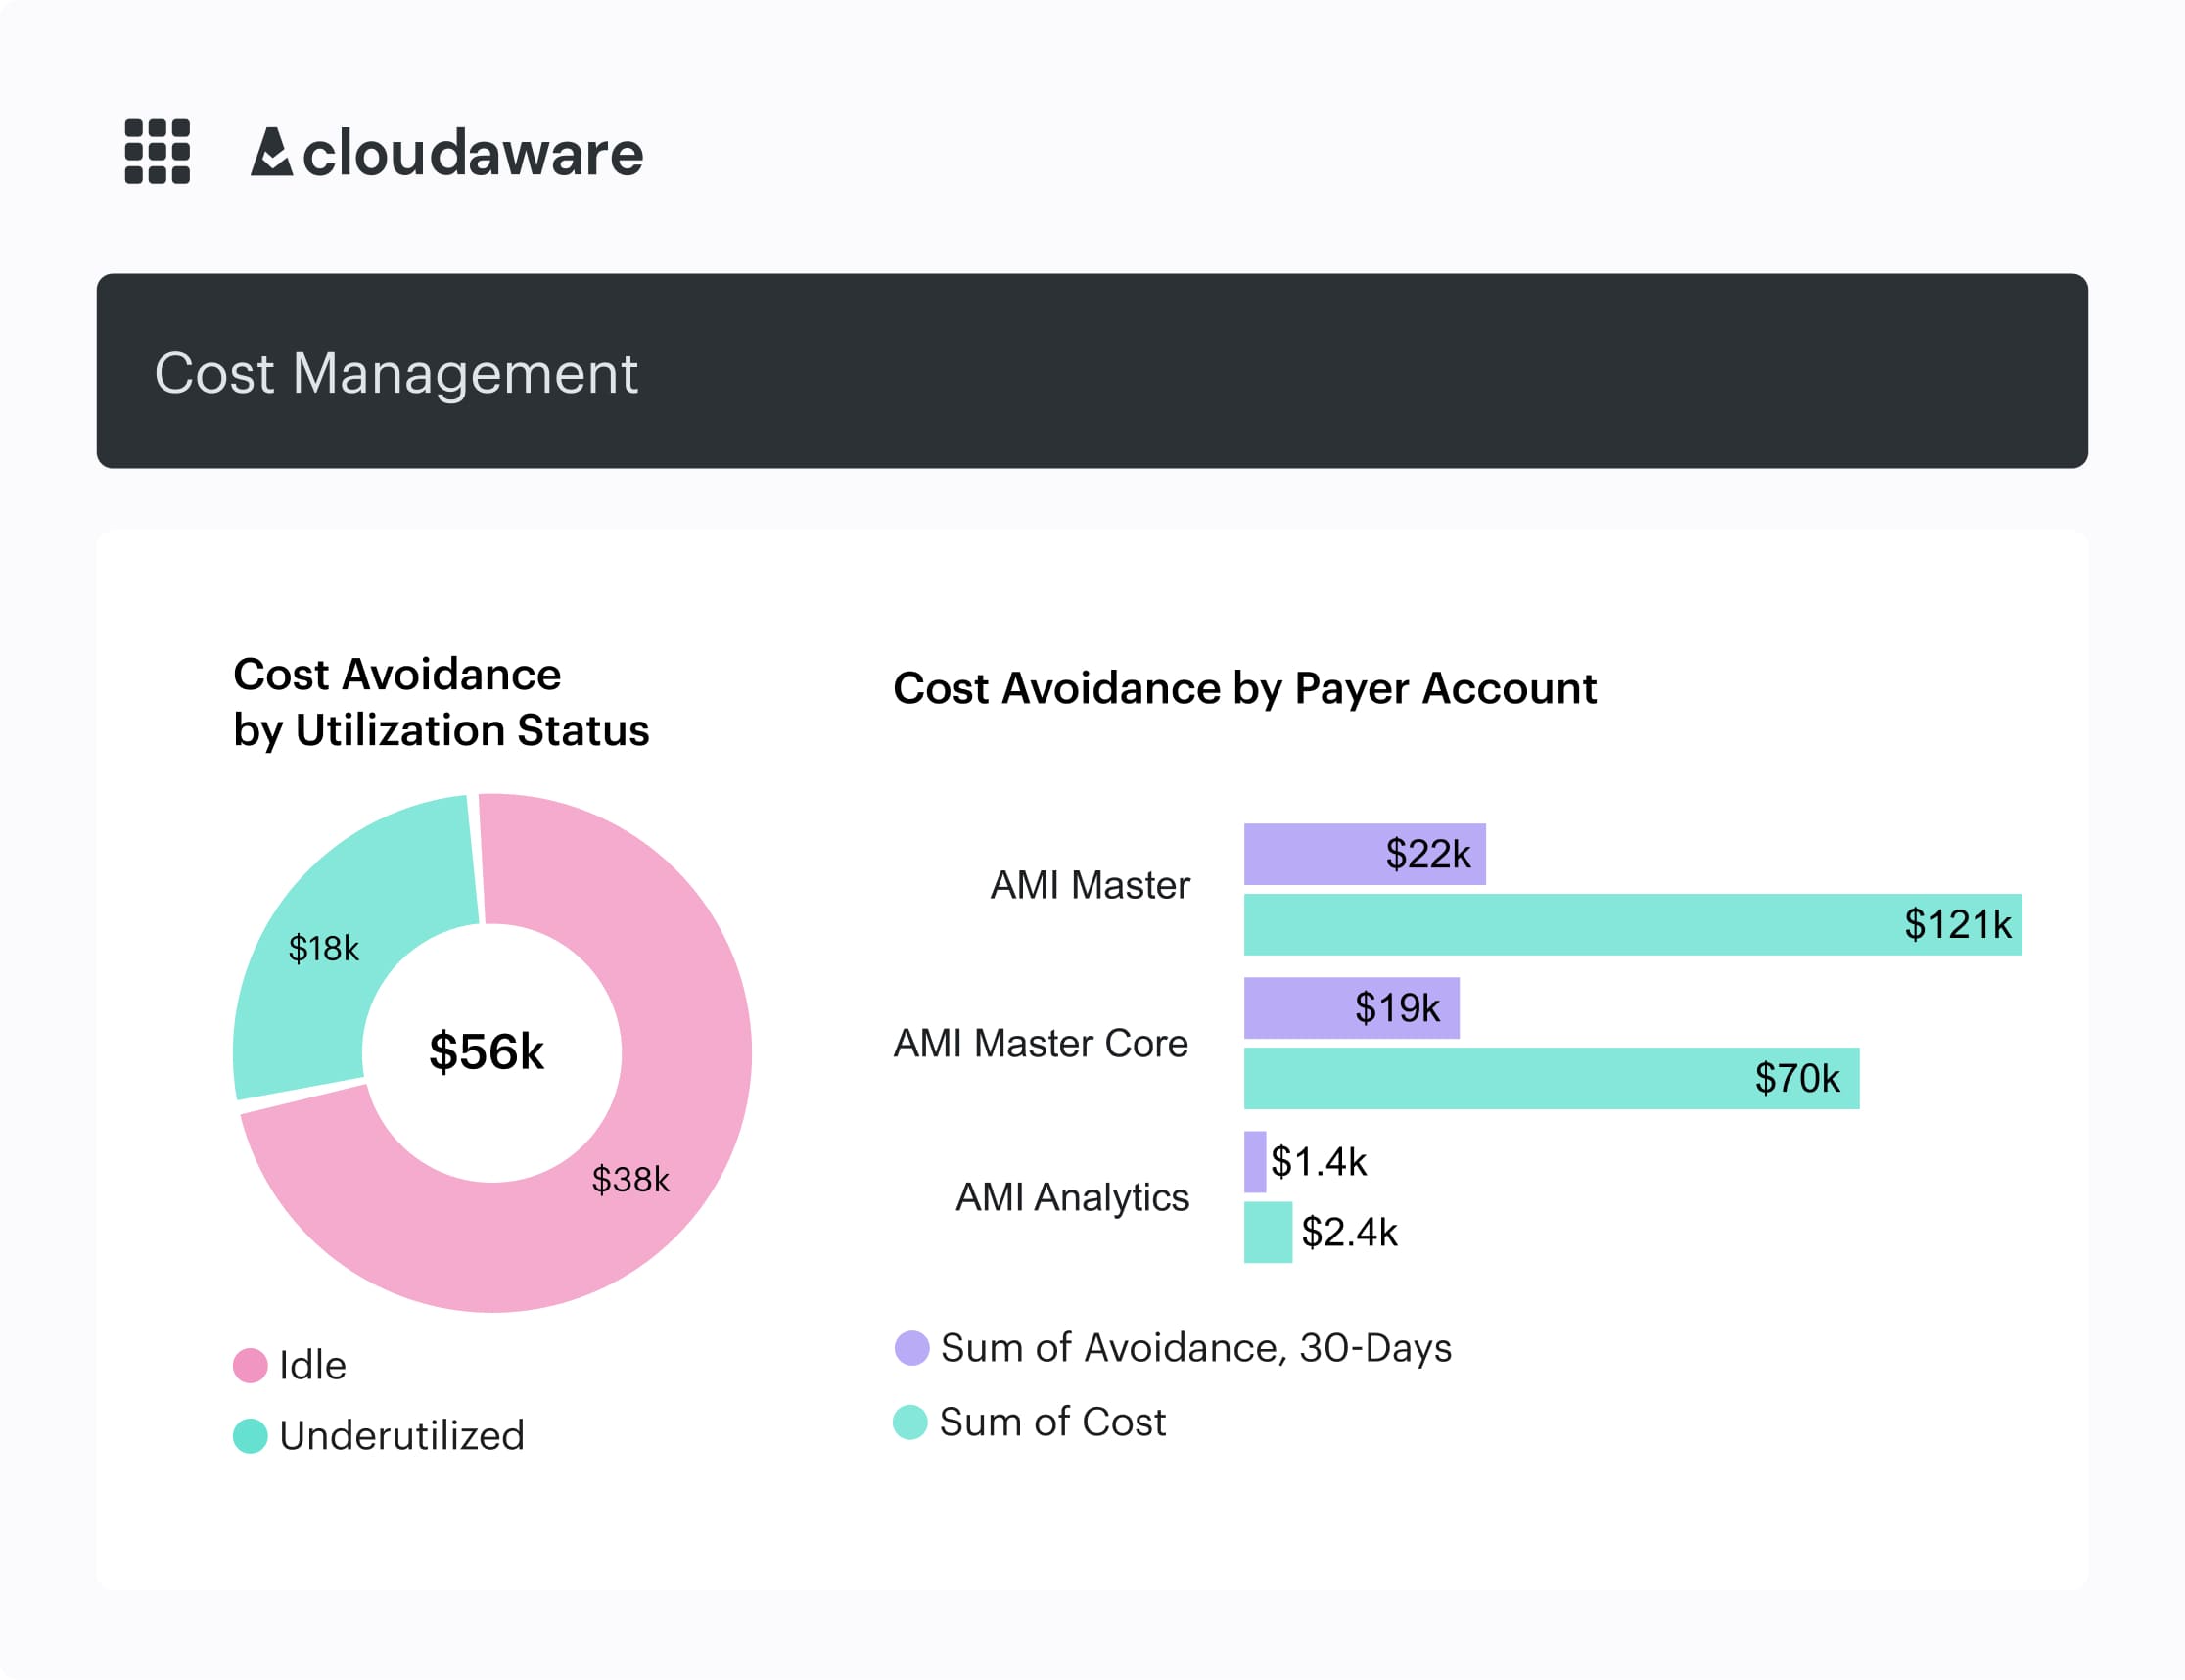
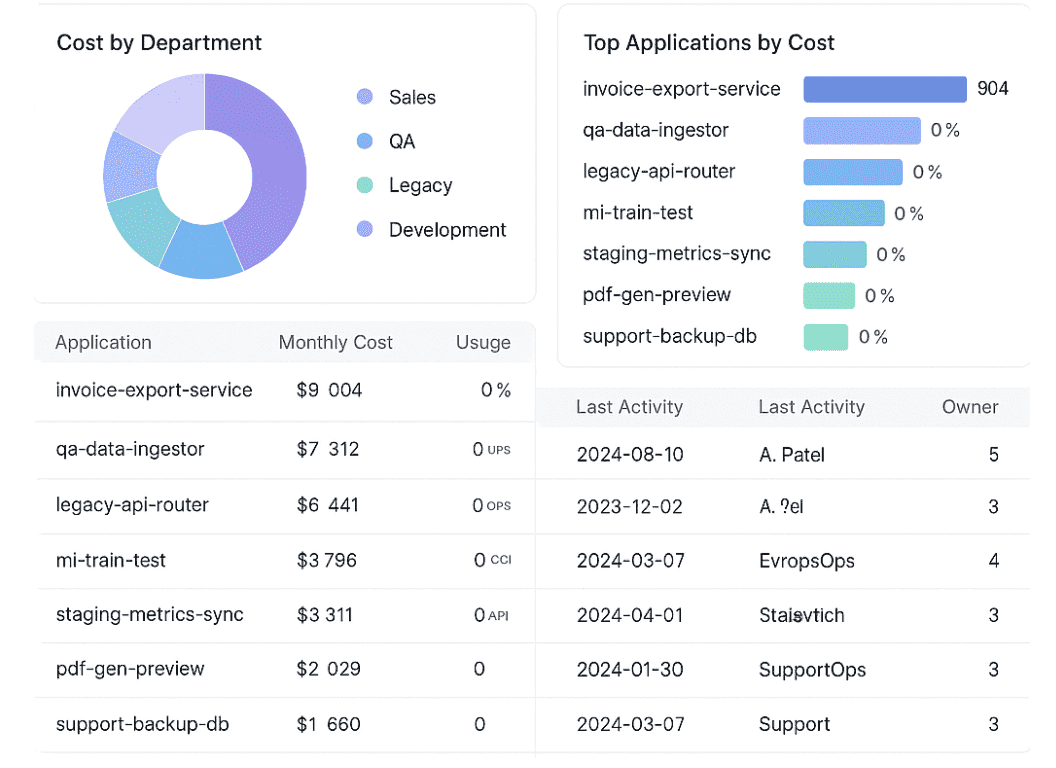
#5 Clean up storage, disks, and networking you forgot about
You know those mystery line items that keep popping up in reviews, and no one can remember what they belong to? Every serious cloud cost optimization Azure guide from FinOps Foundation, ProsperOps, and CloudZero pushes the same first move: hunt the zombies.
Flexera-based analyses show “orphaned” assets alone can chew through roughly 27–32% of cloud spend.
On the Microsoft side, the usual suspects are unmanaged bits of Azure: unattached managed disks left behind after VM deletes, snapshots from retired workloads, abandoned backup vaults, and “temporary” storage accounts that quietly lived past their decommission date. Microsoft’s own cost-optimization posts call out orphaned disks as a dedicated clean-up stream.
FinOps and architecture leaders keep repeating this story because they see it in every cloud estate: storage gets provisioned “for safety,” never tagged properly, and never given a lifecycle. Gartner’s FinOps commentary and FinOps Foundation’s storage playbooks both treat storage cleanup as a day-one FinOps motion, not an afterthought.
Look at real money: N2WS shows a single premium managed disk family can run to over $130 per month, while EazyOps documented saving $2,100 per month just by deleting orphaned disks. Those costs scale fast when you add snapshots and backups nobody will ever restore.
So you need repeatable discovery. Use Azure Resource Graph, KQL, or dedicated tooling to list unattached managed disks, snapshots older than your retention window, unused public IPs, and other idle resources every week and feed them into a cleanup backlog instead of “someday” spreadsheets.
Then you get smart about tiers and pricing. Azure Blob lifecycle management can push infrequently accessed data down through Cool and Archive automatically, which FinOps and Spot.io both point to as a low-effort, high-impact lever.
Networking clean-up matters just as much. FinOps guides and Azure cost articles repeatedly flag unmonitored egress, cross-region traffic, NAT gateways, and VPN appliances as a dedicated cost optimization topic because they compound quietly in the background.
Cloudaware leans in here: its CMDB-aware cost module scans multi-cloud estates for orphaned volumes, idle storage, and rogue IPs, then shows the associated Azure cost impact in the same views app owners already use for KPIs and unit economics.
Cloudaware report element. Schedule a demo to see it live
Once this “zombie report” is part of your regular FinOps management cadence, you’ve freed real budget and simplified your footprint—a perfect setup for the next lever 👇
Read also: 7 Cloud Cost Management Challenges and How to Fix Them
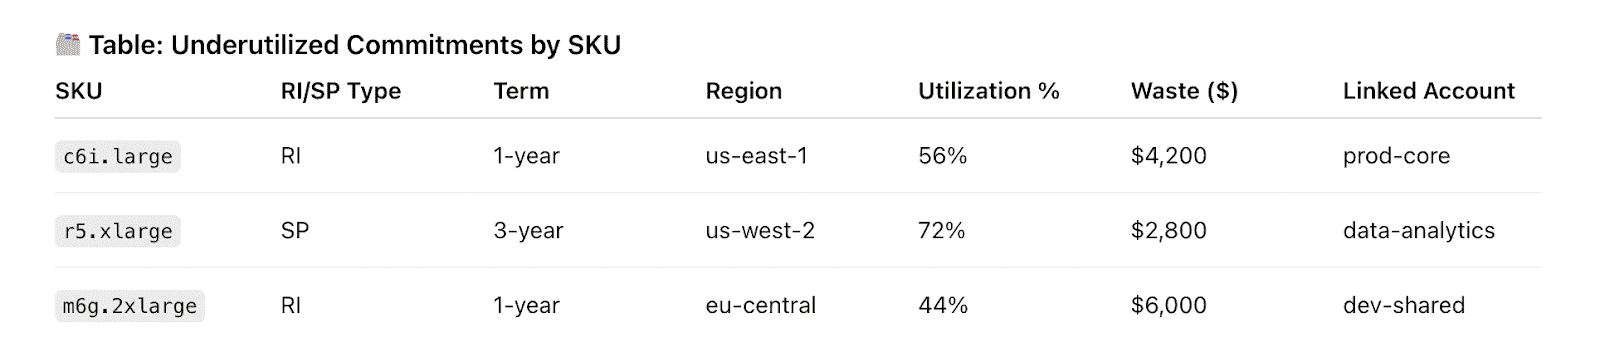
#6: Design a sane Azure commitments strategy (Reservations, Savings Plans, Spot)
Commitments are where Azure either saves your budget… or quietly locks you into three years of regret.
ProsperOps, Flexera, and the FinOps Foundation all say the same thing: discounts work only when you base them on real usage, not “we think this app will be big.” Microsoft’s own docs show Reservations can cut compute spend by up to ~72% and Savings Plans by up to ~65% vs pay-as-you-go – huge upside, but only if you actually consume what you buy.
If you care about Azure cloud cost optimization, start with a boring baseline: 6 – 12 months of usage for core web, API, worker, and AKS node pools. FinOps experts like J.R. Storment and Mike Fuller recommend aiming for commitment coverage only on workloads that have proven stable over time.
Across your cloud estate, you’ll see two patterns: steady, business-critical fleets that hardly move, and everything else (migrations, pilots, noisy experiments). Those steady fleets are commitment material; the rest should stay flexible. ProsperOps’ portfolio benchmarks back this split over and over.
Most mature FinOps teams keep committed costs in a 60–80% band of steady compute, laddering in 1- and 3-year Reservations/Savings Plans gradually instead of doing one giant buy after a scary invoice.
Then you map that plan to actual resources: specific SKUs, regions, and node pools that really do run 24/7. Anything labeled retiring, experiment, or sitting in a migration wave stays on demand or on short-term discounts.
On pricing, think of Reservations as your deep discount for predictable shapes and Savings Plans as your hedge for evolving architectures—Gartner and Spot.io both frame them that way in their guidance.
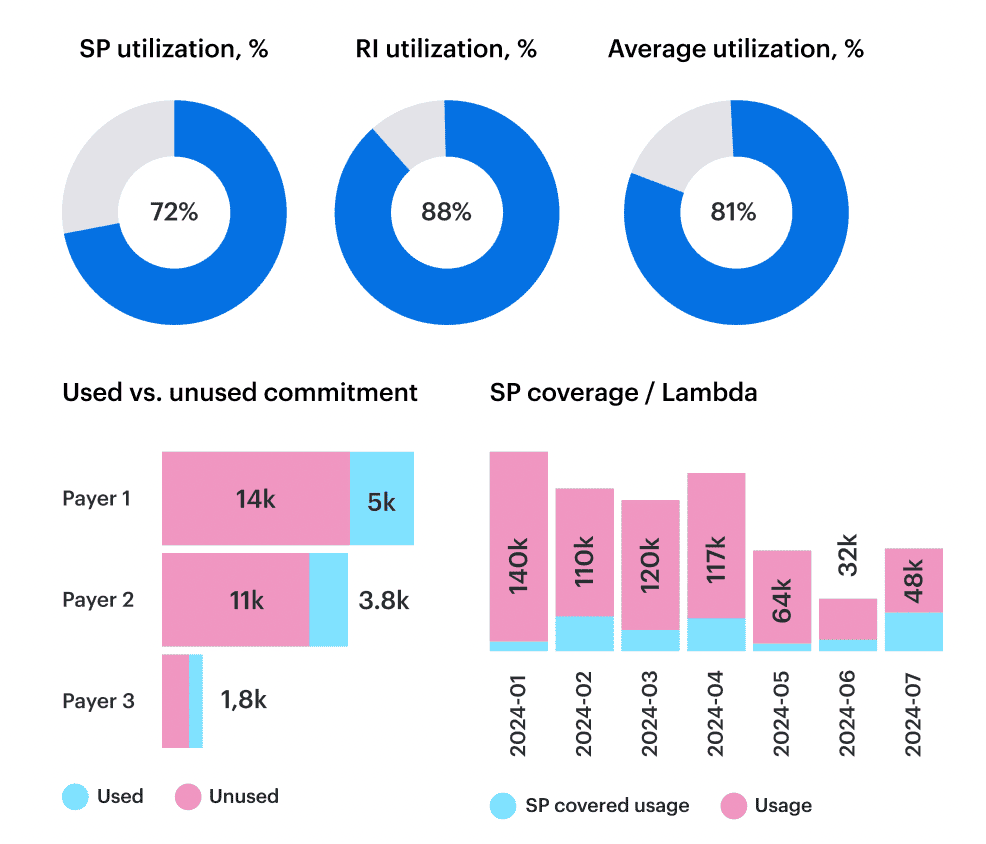
From a FinOps cost optimization view, this becomes a standing topic in your monthly review: coverage %, utilization, expiries, and rebalancing—never a once-a-year panic.
Cloudaware pulls in billing data plus utilization data, decorates it with CMDB context, and shows Azure cost coverage and RI/SP utilization per app, team, and environment. So your commitment management decisions are grounded in how workloads actually behave, not gut feel.
Cloudaware report elements. Schedule a demo to see it live
Once that lever’s under control, you’re ready for the next one 👇
Red also: Hybrid Cloud Cost - How to Optimize and Manage in 2026
#7: Optimize cloud spending with Azure cost optimization alerts and anomaly detection
To optimize cloud spending with Azure cost optimization efforts, you can’t just look at the bill once a month – you’re running post-incident reports on money that’s already gone. Flexera’s 2024 State of the Cloud report shows 82% of enterprises rank managing spend as a top concern and routinely overshoot budgets.
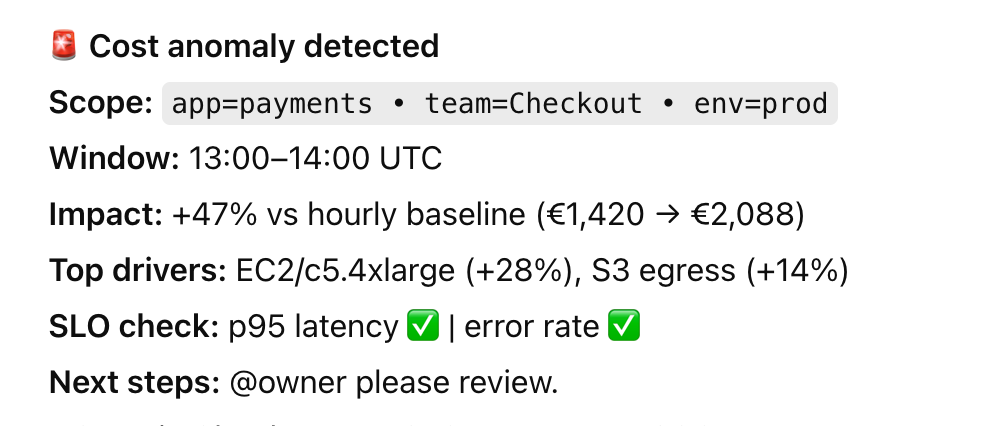
Here’s the pattern: a forgotten POC, a misconfigured AKS dev cluster, or a new data pipeline quietly doubles daily costs, and nobody notices until Finance closes the month. FinOps Foundation calls this out as “Anomaly Management”: catching unexpected spend fast enough that you can actually avoid it, not just explain it.
So you give your telemetry a job. Use the native portal to create budgets per subscription, environment, or cost center, then wire alerts for daily spend, not just month-end. That way the spike shows up in your channel while it’s still small enough to fix. Azure Budgets and anomaly alerts are literally built for this.
Then layer in anomaly detection on top of the usual graphs. Day-over-day and week-over-week deltas per service and app make the noisy resources obvious: yesterday’s spend was normal, today that dev AKS node pool is 2x higher, tomorrow it could be 10x if nobody touches it.
Vendors, FinOps practitioners, and even Azure docs keep hammering the same idea: alerts must reach the person who can act, within hours, not weeks. That’s where tooling choice and alert pricing (noise vs. value) really matter in practice.
Cloudaware leans into this: it ingests multi-cloud billing data, runs daily anomaly detection across services, accounts, tags, and regions.
Anomaly detection report element. See it live
And pushes alerts straight to the right owner via email, Slack, or Jira – so “dev-aks-west-eu” doubling spend shows up in that team’s queue the same day, not in a quarter-end Azure cost review.
Cloudaware report element. See it live
Once that alerting and anomaly management loop is humming, you’re ready for the next maturity step 👇
Read also: Compare 12 Best FinOps Tools - Features, Price, Pros & Cons
#8 Bake cost controls into Azure governance and CI/CD
Cloud cost optimization Azure dies the second your governance lives in a Confluence page nobody reads. FinOps Foundation’s Policy & Governance capability straight-up says you need guardrails that actually run in the platform, not “best practices” in a PDF.
On Azure, that guardrail brain is Azure Policy. You can deny any deployment that’s missing critical tags or that tries to spin up a GPU monster in a dev subscription. Microsoft’s own cost governance posts show built-in policies for allowed VM SKUs, redundancy tiers, and region restrictions specifically to prevent runaway spend.
Across every cloud estate I see, the pattern’s the same: FinOps runs a cleanup, platform fixes things manually, and next sprint reintroduces the exact same waste. Your costs go down for a month, then bounce right back, because nothing blocked bad infra from shipping.
So you let policy and pipelines do the nagging. Require tags like application, environment, owner_email, and cost_center on all billable resources. Use policy initiatives to lock dev/test into sane SKUs and storage tiers while keeping production flexible enough to meet SLOs and performance pricing needs.
Then you push it left. CI/CD adds checks so any Terraform/Bicep PR that introduces an out-of-policy VM size, region, or missing tag fails fast. That’s FinOps cost optimization wired into delivery, not bolted on later. Microsoft's FinOps-ready landing zone guidance explicitly emphasizes the importance of integrating budgets, tagging, and policies into your IaC from the outset.
All of this rolls up into clearer Azure cost views and cleaner policy management. You know which teams are constantly fighting the guardrails and where your design standards need work.
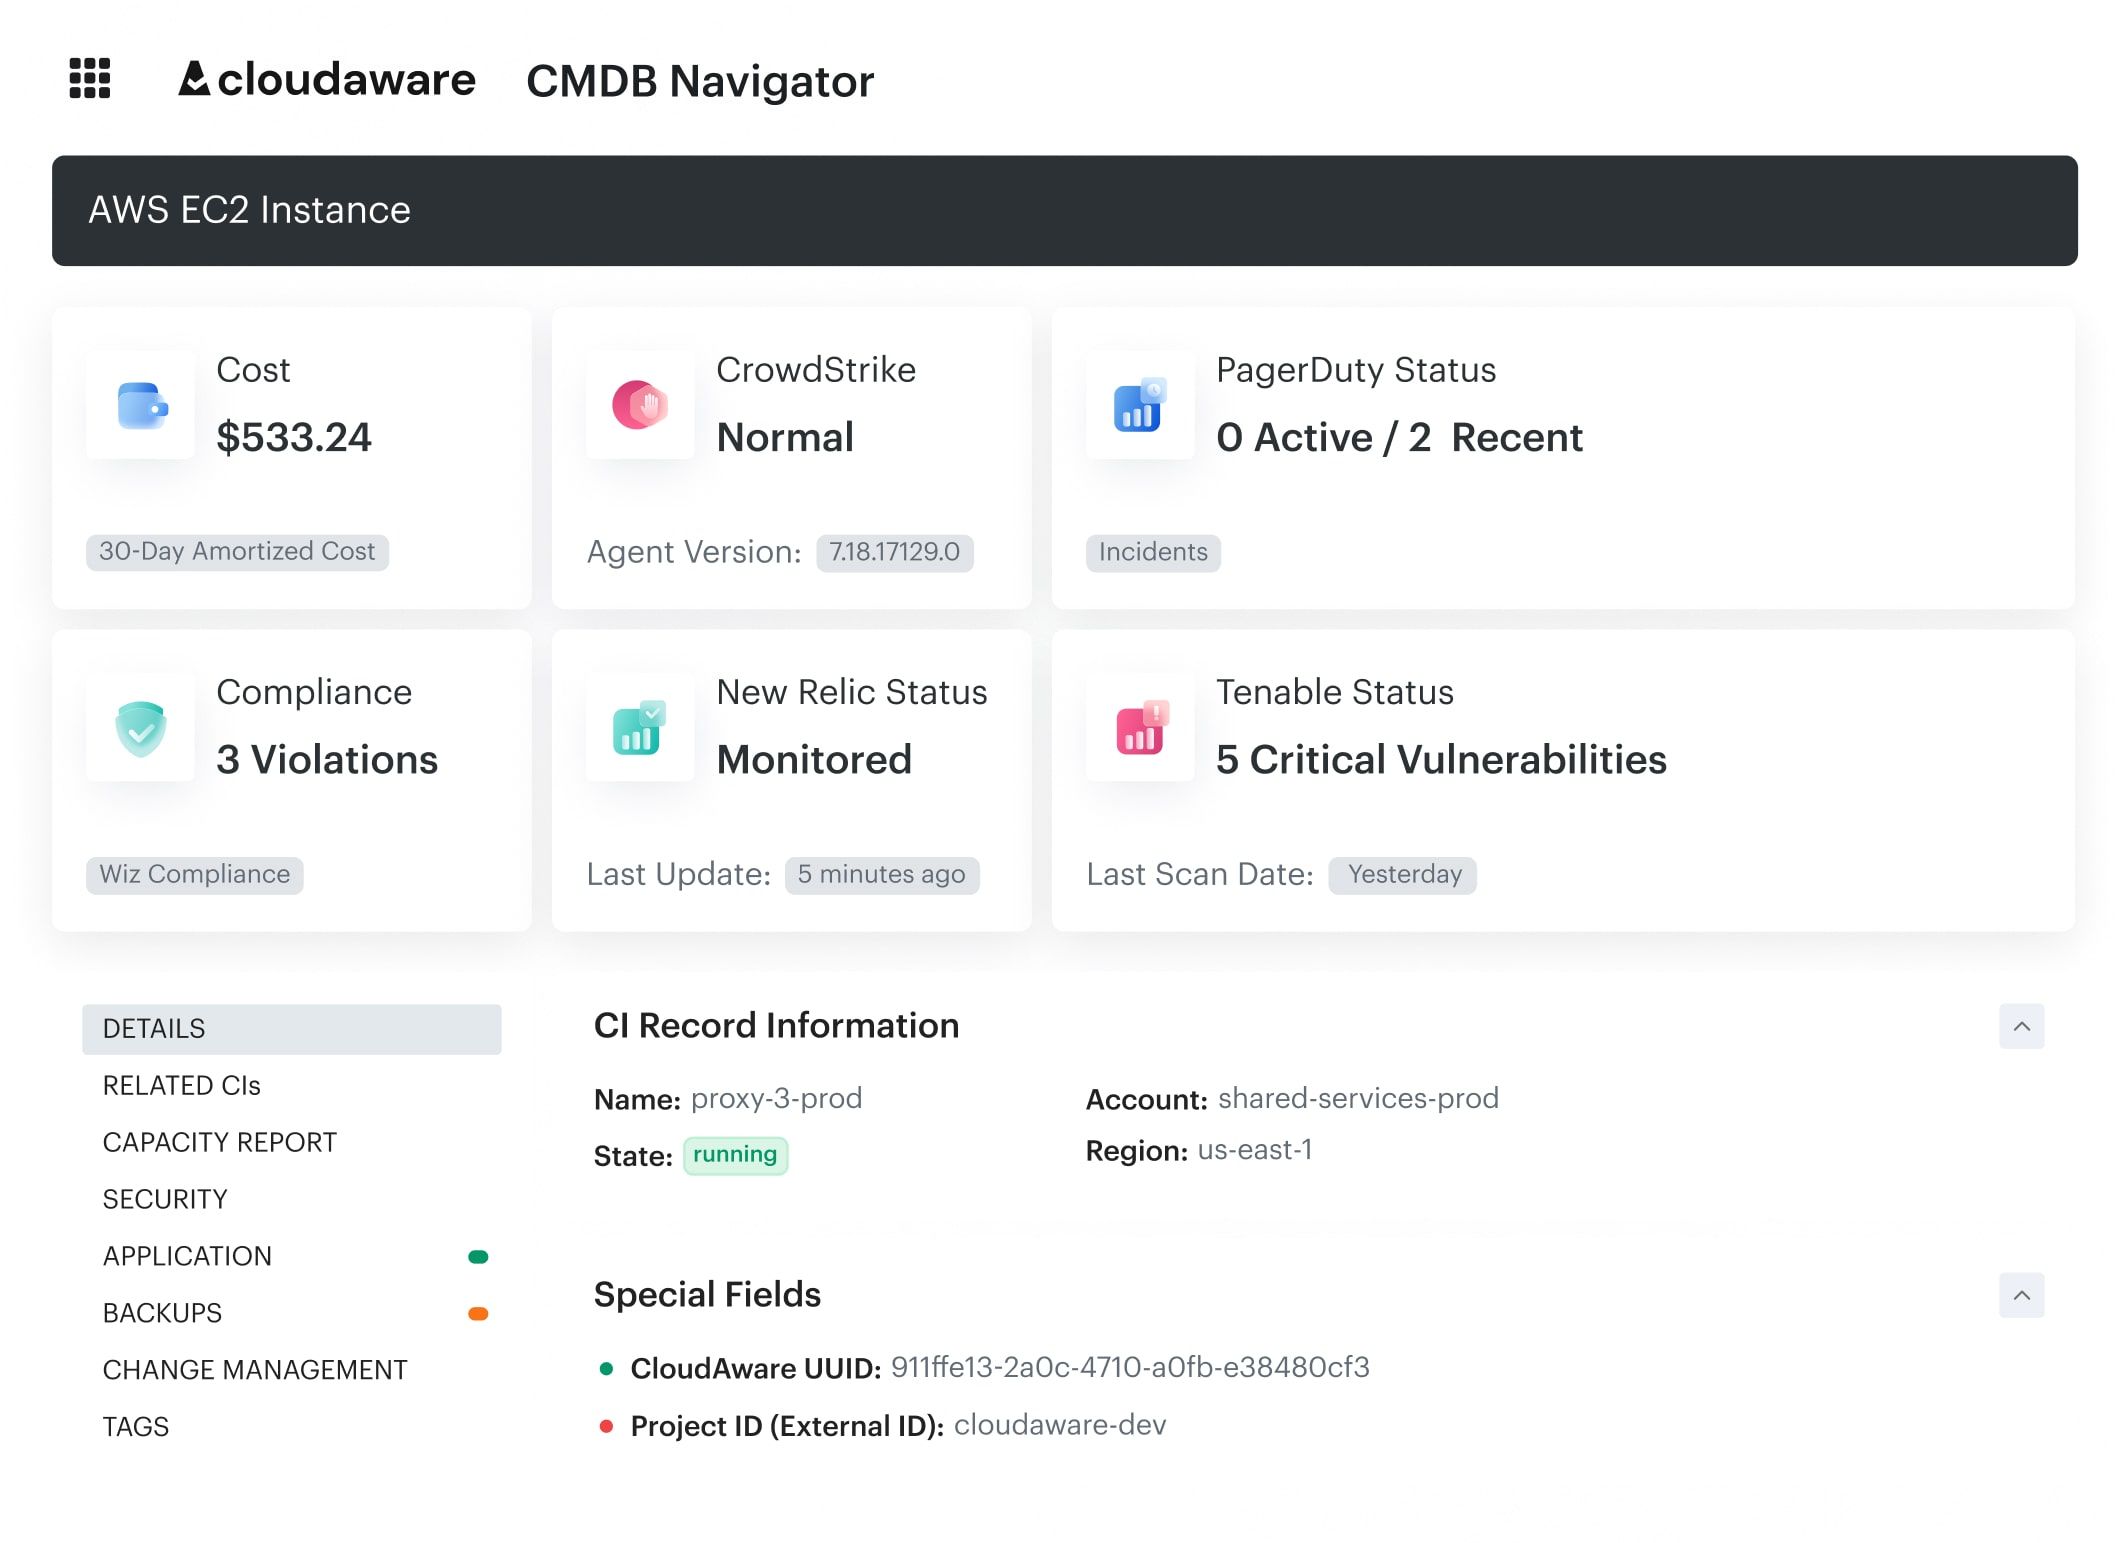
Cloudaware backs that up with a Compliance Engine built on a CMDB:
Hundreds of rules scanning every major Microsoft provider – Azure, AWS, GCP – for tag gaps, region drift, over-spec’d SKUs and more, all tied back to the exact app and owner.
 Schedule a call to see it live.
Instead of grepping logs, you open one report and see every non-compliant resource, the dollar impact, and who to ping. That’s the level of governance that actually moves storage sprawl, GPU misuse, and idle gateways out of your Azure cloud estate and off the cloud cost line.
And once those guardrails are working for you, not against you, you can start tailoring the same ideas to teams with way fewer people and way less process—that’s where we go next 👇
#9 Approach Azure cloud cost optimization for startups differently than enterprises
If you’re running Azure cloud cost optimization for startups, here’s what I’d actually do in your shoes.
First, accept that you don’t have bandwidth for full-blown FinOps. You need a 90-day play that protects the runway without slowing shipping.
- Month 1 – Kill the obvious waste. List every subscription and environment. Delete dead workloads, shut down abandoned sandboxes, and tag what survives with app, environment, and owner. Your goal: no “mystery spend” and a clean baseline for Azure.
- Month 2 – Fix the big rocks. Take your top 10 largest workloads and right-size them. Smaller SKUs, fewer nodes, reasonable limits. Then add basic schedules so dev/test sleeps at night and on weekends. That step alone can reclaim a big chunk of cloud spend.
- Month 3 – Grow up just enough. With a cleaner footprint, design a simple commitment plan and a 3–6 month view of costs. Only commit to workloads that have been stable for months; keep experiments on demand.
Most early-stage teams are already multi-cloud (Azure + AWS or GCP), so looking at resources per provider in isolation won’t answer investor questions about total infra.
This is where I recommend using Cloudaware: you plug in all billing feeds once, the system enriches them with CMDB context, and you get one view of spend by product, team, and environment—without building your own data stack or reporting layer.
Cloudaware report element. See it live
Once that’s in place, the next logical step is strategic 👇
Read also: 10 Cloud Cost Optimization Benefits & Why It’s a Must In 2026
#10: Link Azure cloud costs to business KPIs and unit economics
If you care about cloud cost optimization in Azure, the real unlock is tying every dollar to a business outcome, not just a workload.
For Azure, I start by asking, “*Can you show me cost per customer or per transaction for your top three products?*” Most teams can’t, and the FinOps Foundation’s Unit Economics capability exists precisely because this gap is so common.
Across your cloud estate, VM charts and p95 graphs are helpful, but CFOs and product leaders still only see a big opaque line item in the P&L. Datadog and CloudZero both argue that unit economics is where cloud spend finally becomes a strategic conversation.
So we map infra to services and products first. That means expressing costs per service, per product line, per environment – then layering business metrics on top.
The practical move is a CMDB-style catalog that links SKUs, tags, and relationships so individual resources roll up cleanly to “Checkout API”, “Data Platform”, “Billing Service”.
Once that’s live, you can finally say: “This feature’s gross margin dropped because these three pricing drivers changed – egress, storage tier, and commitments.”
FinOps Foundation explicitly treats unit metrics as a later-stage cost optimization capability—harder to implement, but the one with the largest strategic payoff.
I usually start with a tiny set of Azure cost KPIs: cost per active user, per successful API call, and per processed GB.
Those become part of the regular FinOps management cadence—reviewed alongside forecast variance and commitment coverage, instead of living in an experimental dashboard.
Industry voices like the Cloud FinOps authors, Datadog’s unit economics work, and CloudZero’s allocation research all converge on the same message from the Microsoft ecosystem to multi-cloud: margins live or die on unit cost clarity.
At that point, raw billing rows aren’t enough; every resource has to know which app, team, and feature it belongs to.
Cloudaware’s CMDB gives you that mapping by default—assets, relationships, and owners—so you can see when storage decisions or retention policies are quietly wrecking margin for a specific feature.
Cloudaware report element. See it live
Because Cloudaware ties cost data to a service catalog, your Azure cloud reports show spending by BU, product, or feature teams, not just subscription IDs.
That’s when you can talk about cloud cost per order or per workspace in board meetings without three weeks of spreadsheet archaeology.
With unit costs nailed down, you can safely decide which workloads can lean harder on commitments or even spot capacity without surprising Finance.
Visualize and optimize your Azure cloud costs with Cloudaware
Cloudaware is your FinOps control center—the place where all your Azure bill chaos, AWS experiments, and “who owns this thing?” questions finally land in one view.
Under the hood, Cloudaware’s CMDB connects to five major clouds—AWS, Microsoft Azure, Google Cloud, Oracle Cloud, and Alibaba Cloud—plus VMware and on-prem.
Cloudaware report element. Schedule a demo to see it live
For cost work, Cloudaware already plugs into the billing sources you’re wrangling by hand: AWS CUR/DBR, Azure EA billing, and GCP billing exports.
All of that lands in a Salesforce-grade analytics engine (reports, dashboards, automation), so you don’t need to bolt on a separate BI tool or extra “FinOps integration” subscriptions just to chart spend, send alerts, or share PDFs with Finance.
Once the data is in, this is what FinOps teams actually use day to day:
- CMDB-enriched cost views. Map Azure subscriptions, resource groups, tags, and assets to applications, services, owners, and environments. Slice “Azure cost per product / per team / per environment” instead of per subscription only.
- Tagging & allocation. Tag Analyzer to find untagged/mis-tagged resources across AWS, Azure, GCP. Chargeback/showback reports by app, cost center, and business unit with 90%+ allocation coverage.
- Daily cost visibility & sharing. Cross-cloud and Azure-only dashboards with blended/unblended rates. Budget alerts, daily email reports, and scheduled PDF/Excel sends for stakeholders who never log into the console.
- Waste detection & rightsizing signals. “Underutilized compute” and “idle resources” surfaced from usage + billing. Inputs for right-sizing VMs, AKS node pools, and cleaning up disks, IPs, and storage accounts.
- Commitment planning. Reserved Instance Planner and coverage/utilization views for RIs/SPs. Support for effective cost views so you can see the real impact of commitments on unit economics.
- Forecasting & budgeting. Run-rate based forecasts per cloud, account, or application. Budget tracking and variance views are wired directly to real billing data.
- Alerts, governance & automation. Budget alerts as an early warning on Azure spikes. Compliance views that show where resources violate tagging/region/SKU policies, feeding back into Azure Policy and IaC baselines.