


Cloud cost management strategies in 2026 deal with a very different reality. It’s no longer just EC2, VMs, or GCE. Spend now comes from AI/ML jobs, Kubernetes clusters nobody fully owns, SaaS tools that teams forget about and more.
The issue isn’t just overspending — it’s keeping costs predictable and clearly owned. Different clouds report data differently, network traffic adds up fast, and Kubernetes or SaaS often hide who generated the spend. That’s why teams keep chasing down what changed and who caused yesterday’s spike.
This guide breaks down the 9 cloud cost management strategies that real FinOps teams rely on when dashboards, tags, or forecasts start going sideways:
- Tagging & CMDB (Allocation backbone)
- Daily cost visibility & Anomaly response
- Continuous right-sizing & Waste reduction
- Coverage Strategy (RIs, SPs, Multi-Cloud Commitments)
- Storage & Lifecycle optimization
- Egress & Network cost control
- Kubernetes cost governance
- Forecasting & Variance management
- Automated guardrails & Cost policies
These aren’t “tips.” They’re the workflows, cloud cost optimization metrics, and habits that make cloud costs predictable — even when workloads, teams, and priorities keep shifting.
Cloud cost management best practices in 2025
Before jumping into the strategies, here’s the baseline every FinOps practitioner needs in 2026. The latest FinOps Framework updates emphasize one idea: cloud cost management is no longer about Find Waste → Cut Cost. It’s about running cloud like a measurable, predictable business function.
The 2025 State of FinOps report shows that the best practices for implementing FinOps in cloud cost management usually start with clean allocation, daily visibility, and a clear set of shared KPIs.
This is why high-performing teams treat FinOps best practices for cloud cost management as system-wide habits, not tips:
- Understand costs — normalize AWS/Azure/GCP data, pull SaaS + Marketplace + licensing into the same view.
- Quantify value — track unit costs per product, job, API call, model run.
- Optimize intentionally — automate commitments, lifecycle policies, networking design, and k8s hygiene.
- Improve predictability — daily refresh, anomaly alerts routed to owners, driver-based forecasts.
When this foundation is in place, every downstream cloud cost optimization action becomes easier: teams understand the “why,” dashboards align with reality, and cloud spend stops producing monthly surprises.
How strategic cloud cost management actually works
Strategic cloud cost management is about linking usage, cost, and value over time rather than chasing short-term savings. The best practices for cloud cost management combine FinOps culture, shared ownership, and automation, so teams can ship fast without losing financial control.
Many organizations now treat FinOps cloud cost management best practices as a standard part of their engineering process, not a side project.
What cloud cost management strategies look like
At a high level, modern teams use three types of cloud cost management strategies:
- Operational management — handling day-to-day signals like anomalies, cost spikes, storage growth, or surprise egress. This is where fast alerting, owner routing, and daily cost reviews matter most.
- Architectural management — long-term patterns that reduce spend through better design: network topology, data locality, storage lifecycle, and scaling models. These are the real cloud cost management optimization strategies because they change cost shape, not just cost amount.
- Financial management — commitments, budget cycles, forecasting accuracy, and unit economics. This is where Finance and Engineering meet, and where the biggest gains in predictability happen.

Many teams reuse the same playbook across providers, but Amazon cloud cost management best practices and Google cloud cost management best practices still differ in details like pricing models, discounts, and native tooling. The strategies in this guide are meant to sit above those differences so you can apply one cloud cost management strategy across AWS, Azure, and GCP.
Below, we break down the 9 strategies FinOps teams use in the real world — from tagging and CMDB mapping to egress control, commitments, SaaS governance, and policy-as-code.
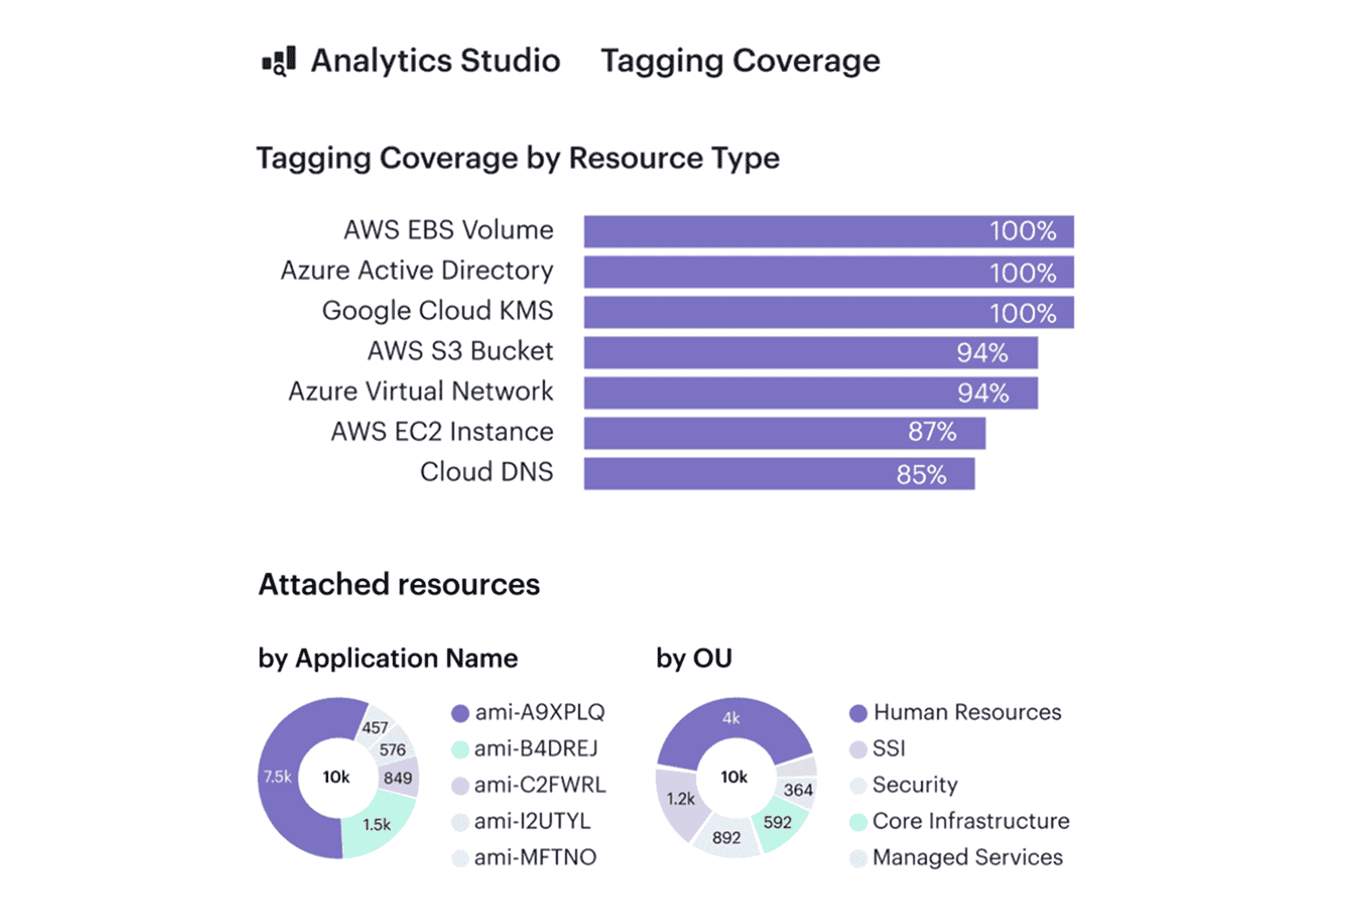
1. Tagging & CMDB (Allocation backbone)
FinOps teams call this strategy an allocation backbone because it’s the only strategy that consistently turns cloud bills into something explainable.
When AWS CUR, Azure Cost Management exports, or GCP Billing data show a growing “Unknown” bucket, nothing else works — not anomaly response, not forecasting, not rightsizing. Tagging sets intent, but the CMDB gives structure.
When it helps
You see Slack threads asking “Who owns this NAT gateway?”, or Jira tickets from Finance because 15-20% of charges sit in “shared.” Kubernetes clusters complicate it further: nodes, egress, snapshots, and control-plane cost rarely carry meaningful tags.
Typical signals it’s needed:
- a rising “unallocated” line in CUR or Azure exports
- teams disputing spikes because nothing ties to their service
- egress and NAT costs with no clear owner
KPIs to track
If you want to know whether your allocation backbone is healthy, track these:
- ≥90% allocatable spend across AWS/Azure/GCP
- 95%+ daily tag/label conformance
- Shared-cost variance <10% between raw vs allocated
- 0 “unknown” buckets by month-end
When these KPIs stabilize, it means the strategy is doing exactly what it should: making cloud costs explainable.
How to implement it
- Define a 4-5 field schema engineers will actually use
(application,environment,owner,cost_center,service). - Enforce at deploy-time with Terraform/OPA/Conftest — no tag = no deploy.
- Use CMDB relationships to allocate NAT, egress, snapshots, LB, K8s control-plane cost.
- Set allocation keys for shared services (e.g., NAT by GB, logs by events/sec).
- Run weekly allocation reviews before the MBR — fix drift early.
How Cloudaware accelerates this:
Cloudaware maps network-related cost items from AWS, Azure, and GCP to the underlying resources in the CMDB, so sudden changes in egress or NAT spend can be routed to the right owners. Teams see cost shifts early, even if they aren’t watching network dashboards.
Read also: 12 FinOps Use Cases + Solutions for Multi-Cloud Spend
2. Daily cost visibility & Anomaly response
Daily visibility is the strategy to use when cloud costs move faster than monthly reviews. A daily view of AWS CUR, Azure Cost Management exports, and GCP Billing data gives an immediate feedback instead of learning about issues at month-end.
It also turns anomaly response into a routine workflow. So value of is simple: teams see spend changes early enough to do something about them.
When it helps
Without daily visibility, teams investigate cost spikes days or weeks after they occur. Slack fills with “did anyone deploy something yesterday?” messages.
Common red flags:
- Cost increases with no matching usage trend
- Anomalies land in shared inboxes instead of owners
- Spend spikes only discovered during MBR prep
KPIs to track
The strategy is healthy when these metrics stay stable:
- MTTA < 1 hour for anomalies
- MTTR < 24 hours
- Daily data refresh ≥ 98% across all clouds
- Anomaly accuracy > 80% with low noise
When KPIs hold, spend becomes predictable and teams react before issues grow.
How to implement
The goal is simple: build one fresh snapshot of spend every 24 hours and surface anomalies while engineers still remember what changed. Once the pipeline is stable, anomaly rules, ownership mapping, and direct alert routing turn daily visibility into a predictable operational loop.
Typical setup steps:
- Collect daily cost exports from every platform (cloud, SaaS, Kubernetes, on-prem)
- Consolidate them into one workspace or warehouse
- Define anomaly rules using both percentage and absolute thresholds
- Attach owners using tags, labels, or CMDB attributes
- Route alerts to Slack, Teams, or Jira with owner context
- Run a short daily review to confirm and close anomalies
How Cloudaware accelerates this:
Cloudaware pulls in daily cost data, flags unusual changes, and checks the CMDB’s CI records to determine who owns the resource behind that cost. The alert then goes straight to the correct owner in Slack or Jira, so teams don’t waste time guessing who should investigate the spike.

Read also: Cost Anomaly Detection: 6 Steps to Catching Cost Spikes Fast
3. Continuous right-sizing & Waste reduction
Rightsizing becomes a real strategy only when it runs continuously, not as a once-a-year cleanup. Most teams discover the same pattern: resources are sized for a peak that never comes, workloads drift over time, and non-production environments quietly run 24/7.
Continuous rightsizing prevents that drift by pairing usage signals with automated removal of everything idle, detached, or oversized.
When it helps
This strategy matters when environment growth outpaces engineering attention. You see VM fleets sized for yesterday’s traffic, Kubernetes workloads with inflated CPU requests, or storage volumes created for temporary work that no one deleted. Non-production clusters run through nights and weekends, and unused snapshots keep stacking until storage becomes a top driver of spend.
Typical signals it’s needed:
- Consistently low CPU or memory utilization on persistent workloads
- Kubernetes namespaces over-requesting resources by x2-5
- Unattached volumes, stale snapshots, or orphaned IPs accumulating
- Dev/Test environments running 24/7 without schedules
KPIs to track
These metrics show whether continuous rightsizing is actually working:
- p95 CPU and memory within the expected range for each workload
- 5-10% monthly reduction in idle or orphaned resources
- Non-prod hours cut by 30-50% through scheduling
- Decreasing list of oversize candidates in weekly reviews
When these stabilize, rightsizing becomes a predictable loop instead of a reactive cleanup.
How to implement it
Teams usually begin by collecting utilization data across compute, storage, databases, and Kubernetes clusters.
Storage waste follows similar rules: delete unattached volumes, expire stale snapshots, and apply lifecycle policies to shift older data into cheaper tiers. For non-production systems, schedules handle most of the savings with little risk.
Typical setup steps:
- Pull p95 CPU/memory for compute and Kubernetes workloads
- Identify idle or orphaned resources (volumes, snapshots, IPs, load balancers)
- Set TTL rules or cleanup automation for non-attached assets
- Apply schedules to dev/test systems to reduce off-hours waste
- Run weekly rightsizing reviews to approve or postpone changes
How Cloudaware accelerates this:
Cloudaware monitors utilization across clouds and Kubernetes, surfaces rightsizing candidates, and applies more than 100 waste-detection policies for unattached, idle, or misconfigured resources.

TTL logic, dependency insights, and owner routing help teams remove waste quickly while keeping changes safe and auditable.
Read also: What Is Rightsizing in Cloud Cost Optimization? Pro Insights
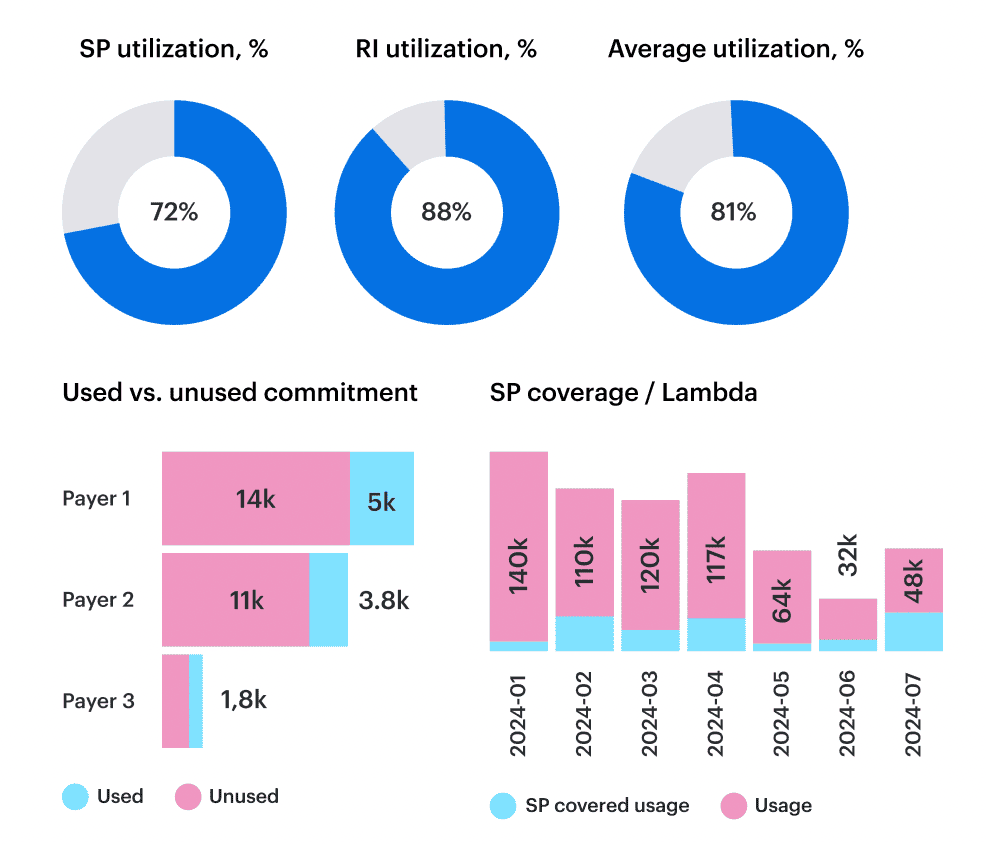
4. Coverage strategy (RIs, SPs, multi-cloud commitments)
A healthy coverage strategy aligns commitments with real usage patterns rather than assumptions. It treats RIs, Savings Plans, enterprise discounts, and BYOL licensing as one portfolio and adjusts coverage as workloads evolve.
When this strategy works, Finance sees predictable effective cost, and Engineering avoids over-commit or under-commit cycles that drag budgets off track.
When it helps
This strategy becomes critical when utilization drops or workloads no longer match the commitments purchased earlier in the year. You see RIs sitting unused while new services run fully on-demand. Teams shift to a different region or compute family, but commitments stay behind. Kubernetes growth outpaces VM-based commitments.
Typical red flags:
- Coverage <60% for steady workloads
- RI/SP utilization below 80-85%
- Rapid shifts in region, instance family, or service type
- Large portions of Kubernetes on-demand with unused VM commitments
KPIs to track
You can tell the coverage strategy is working when these metrics stabilize:
- Coverage 60-85% for predictable, steady workloads
- RI/SP utilization ≥90%
- Effective cost improving month over month
- Commitment expiries visible 30-60 days ahead
How to implement it
The implementation starts with understanding which parts of your estate behave predictably and which do not. The goal is to align commitments with engineering reality so coverage never drifts far from actual usage.
Typical setup steps:
- Analyze 60-90 day usage to separate steady vs variable workloads
- Target moderate coverage (not 100%) to avoid locking in volatility
- Use flexible commitments (e.g., convertible RIs) when architectures shift
- Align commitment planning with product and release roadmaps
- Review utilization weekly and adjust to avoid idle commitments
How Cloudaware accelerates this:
Cloudaware measures RI/SP coverage and utilization across AWS, Azure, and GCP, shows effective cost by service and environment, highlights unused or misaligned commitments, and surfaces renewal dates before they create gaps.

Teams adjust coverage with full usage context instead of spreadsheets or guesswork.
Read also: 13 Cloud Cost Optimization Best Practices to Use in 2026
5. Storage & lifecycle optimization
Storage costs grow quietly and often go unnoticed. Buckets collect months of logs, snapshots stick around long after the workloads are gone, and temporary volumes end up living forever simply because no one circles back to delete them.
Compute usually gets attention because it’s noisy; storage expands slowly, so it’s easy to miss until it becomes one of the most expensive parts of the bill. A consistent lifecycle approach helps keep that growth in check and prevents old data from piling up.
When it helps
This strategy is useful when storage usage rises even though traffic or compute hasn’t changed. You might see large buckets without lifecycle rules, snapshots that were never given an expiry date, or cold data sitting in the hottest and most expensive tiers. Kubernetes clusters show a similar pattern when PVCs keep accumulating after the workloads that used them are gone.
Typical signals it’s needed:
- Storage spend increasing while workloads stay flat
- Lifecycle rules missing from many buckets
- Volumes not accessed for long periods
- Snapshots kept indefinitely
- Unclear ownership behind big storage objects
KPIs to track
A good lifecycle process usually reflects itself in several areas:
- 70-90% of storage covered by lifecycle or retention rules
- 10-20% monthly reduction in unattached or stale volumes
- ≤30% of cold data stored on hot or premium tiers
- Snapshot retention aligned to defined windows (e.g., 7-14 days)
- Unowned or untagged storage reduced to <5%
How to implement it
The easiest way to run this strategy is to treat storage the same way you treat any other long-lived resource: give it owners, give it rules, and make those rules part of a regular review cycle.
Start with visibility, make sure each storage type has a clear lifecycle pattern, and keep retention settings tight enough that unused data doesn’t pile up. Most teams also set a simple check-in rhythm so changes in data access don’t go unnoticed for months.
Typical setup steps:
- Inventory storage across cloud, Kubernetes, SaaS, and on-prem using native APIs
- Apply lifecycle rules to buckets and file stores
- Set retention windows for snapshots and backups
- Remove stale or unused volumes
- Review tiering and retention monthly
How Cloudaware accelerates this:
Cloudaware maintains an up-to-date inventory of buckets, volumes, and snapshots across all clouds and Kubernetes.
The platform flags unattached volumes, buckets without lifecycle rules, and PVCs left behind after workloads move on, then sends the findings to the right team through Slack or Jira.
6. Egress & network cost control
Network charges grow in ways that don’t always match how teams think their systems behave. A service moves to another region, a pipeline starts transferring more data than expected, or traffic quietly routes through a single shared NAT gateway.
These changes often slip in gradually, and by the time someone looks at the bill, the pattern has already formed. Egress & network cost control helps teams bring visibility back to how data actually moves.
When it helps
This strategy is most useful when network spend rises but product activity doesn’t. A sudden spike in inter-region traffic or an unexpected jump in NAT charges usually means a service changed its path without anyone noticing. In some cases, analytics jobs or ML pipelines shift data between clouds, and the bill shows it long before the dashboards do.
Typical red flags:
- Egress rising while user or workload metrics stay flat
- NAT gateways moving traffic for multiple unrelated teams
- New cross-region flows that no one planned
- Large transfers triggered by a single misconfigured job
- Network-heavy workloads with unclear ownership
KPIs to track
- Cross-region traffic reduced by 20-40% after co-location fixes
- ≥90% of NAT usage mapped to owners
- Top 10 egress sources reviewed monthly
- Large transfers linked to known product events ≥80% of the time
- Unattributed network spend pushed below 5%
How to implement it
Start by making data movement visible. Most teams have a rough idea of which services talk to each other, but actual traffic often tells a different story.
Once the real flows are mapped, it becomes easier to decide what needs to sit closer together, which gateways should be split out, and where routing policies need tightening.
Typical setup steps:
- Identify top egress sources and cross-region flows
- Review NAT gateways and assign owners
- Co-locate high-traffic services to reduce hops
- Update routing to keep internal traffic local
- Review large transfers on a monthly cadence
How Cloudaware accelerates this:

Cloudaware highlights changes in network-related cloud charges through its daily cost updates and anomaly alerts. When egress or NAT spends shifts, the platform ties those cost changes to the right owners when tags or CMDB context provide that information.
Read also: How Cloud Experts Use 6 FinOps Principles to Optimize Costs
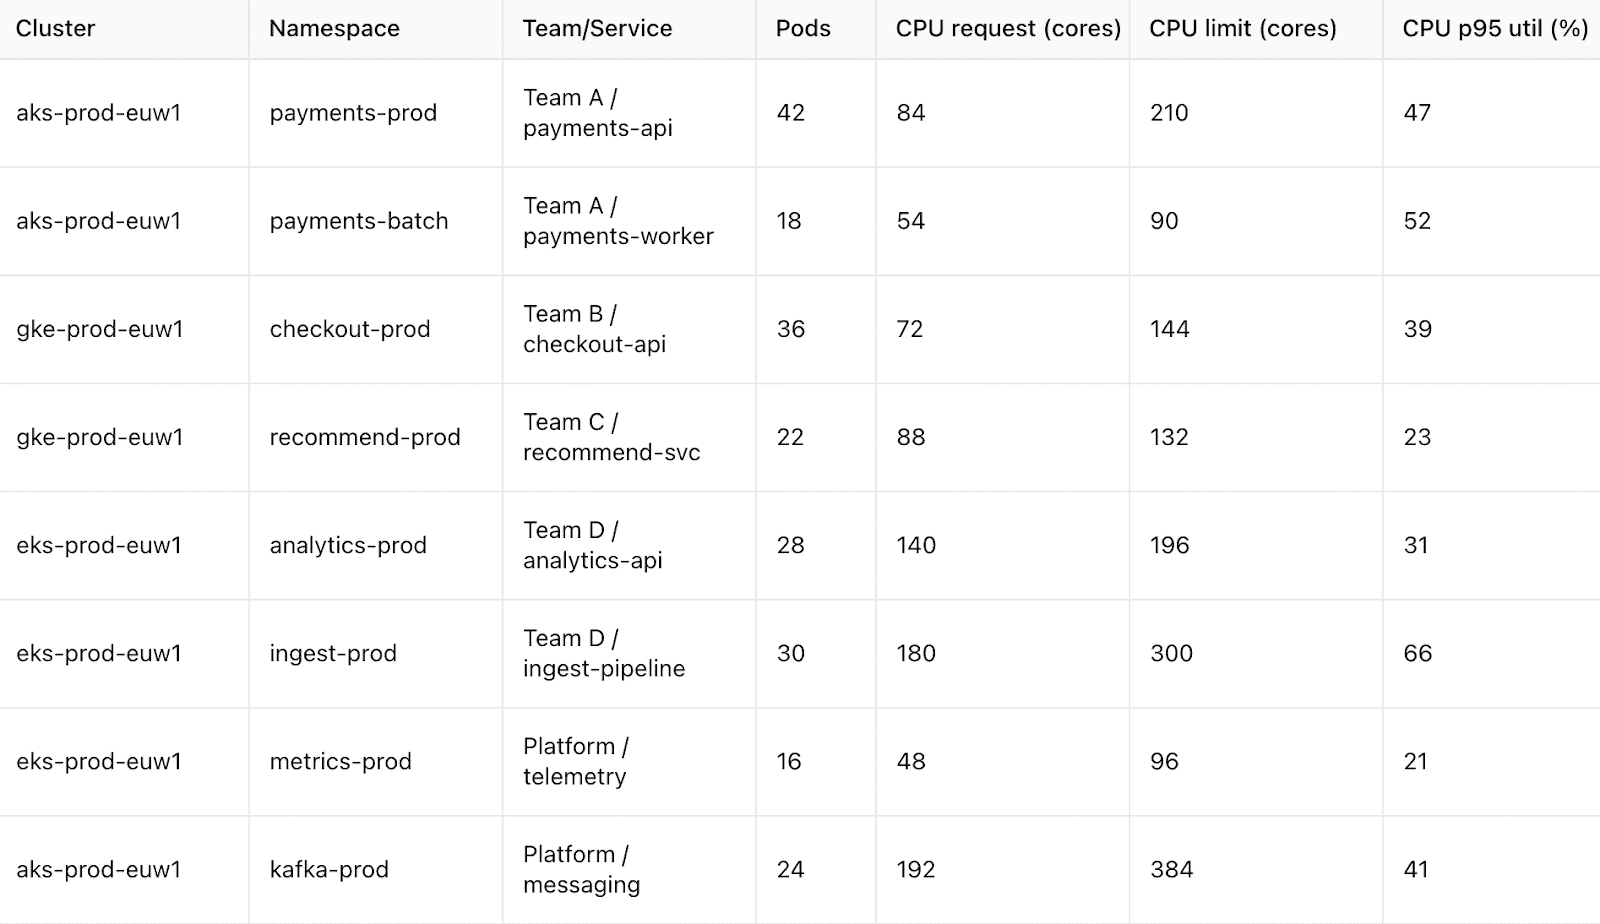
7. Kubernetes cost governance
Kubernetes has a habit of surprising people. A cluster may look calm one week and then, without any big release, node costs creep up again. It’s hard to manage costs in an environment that shifts this fast, so teams rely on a simple rule: put clear ownership in place and check resource settings on a regular basis.
When it helps
This approach becomes valuable once you notice that the bill no longer matches what teams believe they’re running. Maybe a service is asking for five times more CPU than it needs, or a GPU node sits mostly idle between training jobs.
Sometimes a namespace grows because people kept adding “temporary” jobs. PVCs also tend to pile up quietly after the workloads are gone, and they stay there until someone goes looking for them.
Typical signals it’s needed:
- Requests overshooting real usage by x2-5
- Namespaces shared by several teams with no single owner
- GPU nodes active for only short bursts
- PVCs hanging around after pod removal
- node groups sized for traffic that no longer exists
KPIs to track
- Request-to-usage ratio near x1.3 for steady workloads
- Owner and application labels on ≥90% of namespaces
- GPU utilization around 60-70% when in active use
- 10-15% monthly cleanup of stale PVCs
- node pool efficiency improving each quarter
How to implement it
A good start is to make the cluster a bit more predictable. Teams decide which labels must always be present, agree on how often they review requests and limits, and split heavy or noisy workloads into their own node pools. It also helps to remove leftover PVCs and services before they build up. A short monthly review is usually enough to keep the cluster from drifting too far.
Typical setup steps:
- Define required Kubernetes labels (
team,service,owner) and enforce them through CI/CD or admission policies - Review CPU and memory requests for key workloads and adjust based on actual usage trends
- Place steady and high-traffic workloads into dedicated node pools
- Set cleanup rules for PVCs, services, and orphaned workloads
- Run a monthly cluster review to check usage drift and ownership gaps
How Cloudaware supports this:
Cloudaware highlights cost changes in the cloud resources your Kubernetes clusters rely on — node groups, attached storage, and load balancers.
These shifts appear in daily spend updates and anomaly alerts. When ownership is defined in the CMDB, Cloudaware links these costs to the right teams.
Read also: Cloud Cost Optimization Framework: 11 Steps to reducing spend in 2026
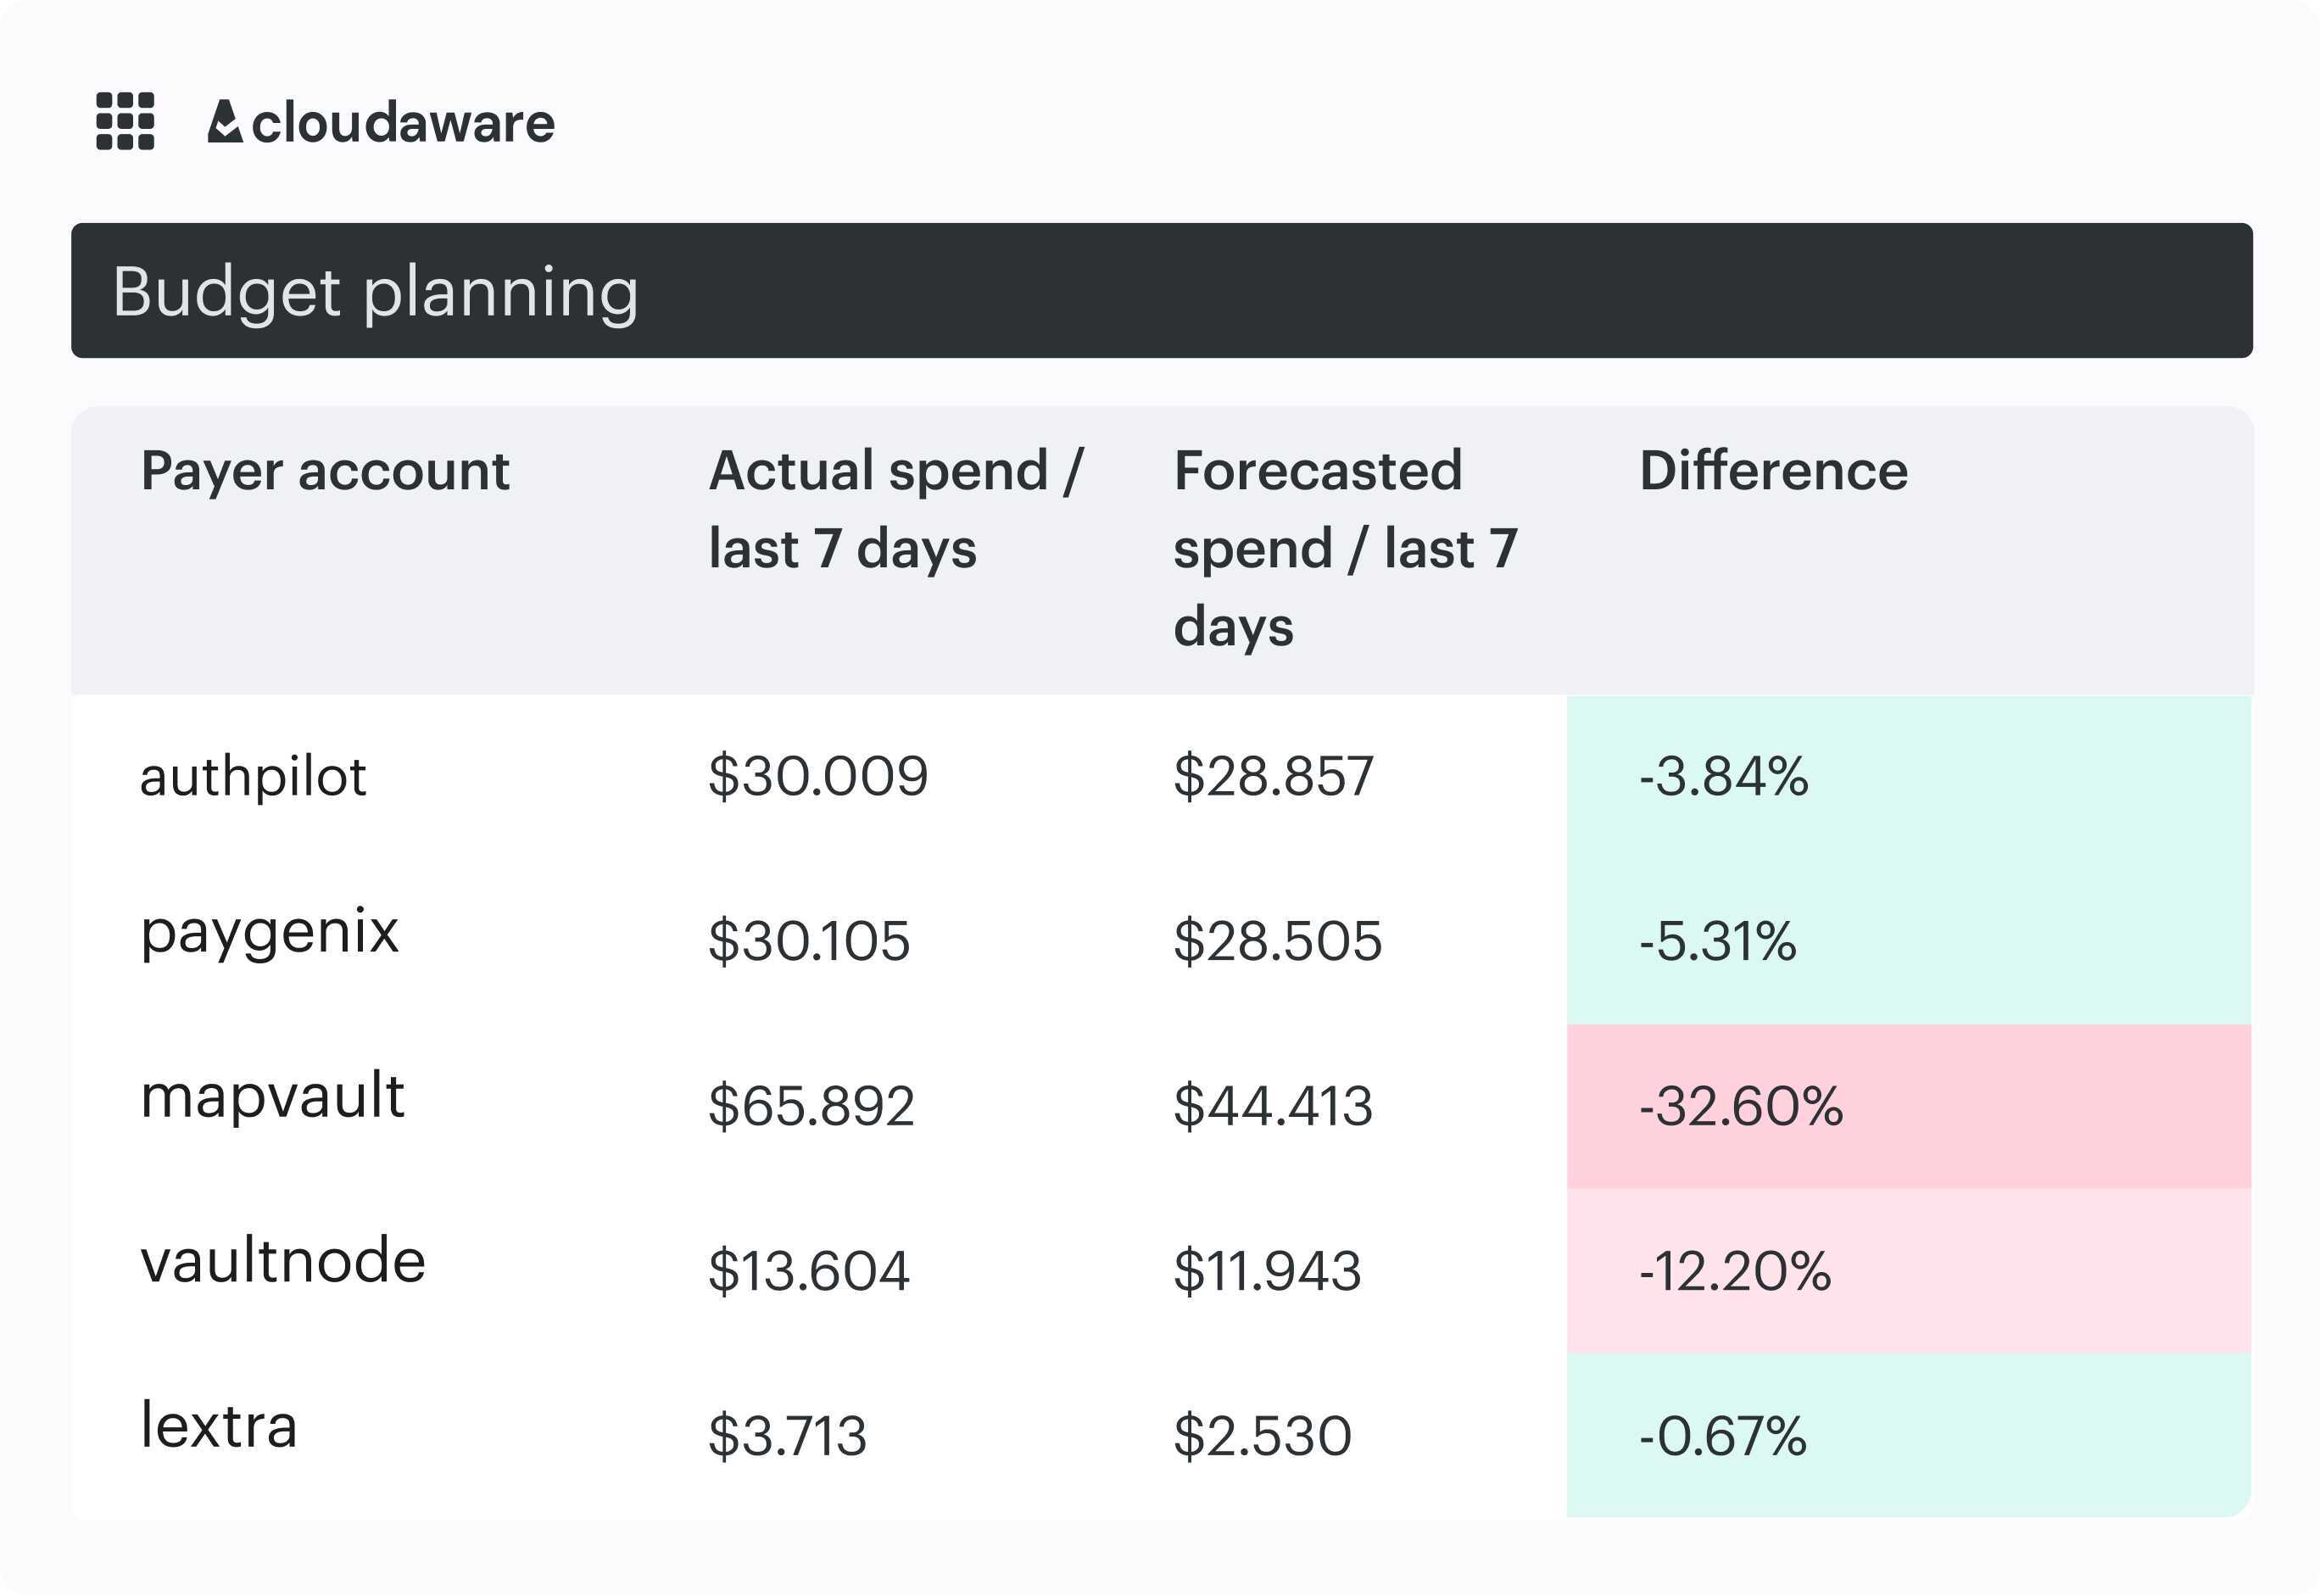
8. Forecasting & Variance management
Forecasting cloud spend is hard because the usage patterns behind it rarely move in straight lines. New features change traffic, data pipelines grow unpredictably, and even small architectural shifts can alter cost trends.
A good forecasting and variance management strategy helps teams stay ahead of these changes instead of defending them after the month closes.
When it helps
This strategy becomes essential once teams notice their budgets slipping even though nothing “big” changed. It usually shows up as a forecast built on averages that no longer match product behavior. A rollout happens, traffic doubles, or a new ML workload lands in production, and the forecast doesn’t catch up for weeks. Finance ends up surprised, and engineering spends time explaining rather than building.
Typical red flags:
- Forecasts missing by more than 10–15%
- Cost spikes that align with deployments but not with the forecast
- Commitments expiring without visibility weeks ahead
- Budget reviews shifting into reactive conversations
- Spend growing faster than the underlying usage
KPIs to track
- Forecast variance within 10-15% for steady workloads
- Coverage of forecastable spend ≥80-90%
- Commitment expiries visible 30-60 days out
- Unit cost stability improving month over month
- Driver accuracy improving across releases
How to implement it
A common FinOps rule of thumb is simple: forecast the drivers, not the dollars. Pick the few usage signals that truly move your bill — things like requests, jobs, active users, or storage growth — and anchor your forecast to those patterns instead of trailing averages. Most teams keep a short weekly check-in to catch shifts early.
One more habit that helps: write down expected changes before they ship, so Finance isn’t reacting to surprises after the fact.
Typical setup steps:
- Choose 3-5 usage drivers that explain most spend
- Build forecasts around those drivers instead of trailing averages
- Review variance weekly and adjust assumptions early
- Track commitment expiries and major infra changes ahead of time
- Link forecast updates to release or roadmap reviews
How Cloudaware supports this:
Cloudaware aggregates daily spend across clouds and shows how cost trends shift against historical patterns. When spend moves unexpectedly, anomaly alerts surface the change, and CMDB context ties it back to the teams or services involved.
The platform also provides budget and forecasting views that help teams track variance and see upcoming changes, without claiming to predict usage or run ML-driven forecasts.
Read also: Cloud Cost Forecasting: Build a Reliable Cloud Budget (Methods, Software, Examples)
9. Automated guardrails & Cost policies
Cloud costs rarely spike because of one big mistake. It’s usually a pile of small things like missing tags, machines sized “just to be safe,” test workloads running overnight, or someone picking premium storage by accident.
None of it feels urgent in the moment, but the drift shows up quickly in monthly reviews. Automated guardrails help catch these issues early, before they turn into budget problems or long email threads.
When it helps
Most teams start feeling the need for guardrails once the same issues keep coming back. A few missing tags? Fine. But when it happens every week, or when non-prod environments keep running 24/7, it eats into spend quietly.
Guardrails give a light layer of protection around everyday work. They don’t block engineers but nudge the environment back into shape.
Typical red flags:
- New resources created without required tags
- Test or dev workloads running around the clock
- Premium storage selected where standard would do
- Cleanup tasks accumulating across teams
- Cost spikes tied to simple config mistakes
KPIs to track
- Policy compliance ≥90% for key resource types
- Tag coverage ≥95%
- 20-30% drop in recurring waste signals after guardrails go live
- Violations detected within minutes, not days
- Steady decline in manual cleanup tickets quarter over quarter
How to implement it
Most teams start with a short list of rules that actually matter. Things like “these tags must exist,” or “don’t use this instance size unless there’s a reason,” or “dev workloads expire after X hours.” Simple rules work best — they’re easier to explain and harder to ignore. It also helps to revisit alerts from time to time; thresholds that were fine a month ago might be too strict today. The goal isn’t to block work, just to keep the environment from drifting.
Typical setup steps:
- Define a small set of required tags and size limits
- Add TTLs for test and dev resources
- Set checks for obvious waste patterns
- Review violations weekly and adjust noisy rules
- Track how compliance improves over time
How Cloudaware supports this:
Cloudaware’s IT Compliance Engine checks your cloud resources against the rules you define and links each violation back to the right owner using tags and CMDB context. Alerts go straight to the responsible team through Slack or Jira, so issues don’t sit unnoticed for days.
For recurring problems, teams can create custom policies with Cloudaware’s Java-based rule language or enable optional auto-remediation through a customer-deployed CloudFormation template. The template defines the IAM permissions for a Lambda workflow that runs under the customer’s control — Cloudaware never makes changes to infrastructure on its own.