You’re here because the board wants savings, Engineering wants guardrails, and you’re hesitating — FinOps tools isn’t cheap. Budgets are tight, invoices are noisy, AWS CUR/Azure Cost Management/GCP BigQuery don’t line up, tags drift, and chargeback reviews drag on. You want the cloud cost optimization benefits without breaking delivery or SLOs.
Fair.
Everything you’ll read comes from my teammates — 10+ years in the trenches with multi-cloud companies — watching real pipelines, triaging anomalies, planning RI/SP/CUDs, and hardening tagging governance. Plus industry patterns and what we learned partnering with Cloudaware clients like Coca-Cola, NASA, and Cisco.
Here’s what we’ll unpack — through results, not theory:
- Can cost visibility make Finance, Eng, and Product align in one sprint?
- How fast can waste removal move the needle without SLO regressions?
- What proves forecasting hit ±8–10% and stuck?
- Which commitments raised coverage without over-buying?
- How do anomaly alerts protect the bill before month-end?
- Why does unit economics finally land in the roadmap?
By the end, you’ll know why cloud cost optimization is important — and exactly how to validate it.
Cost savings without surprises (10–25% in 90 days)
Your cloud keeps growing — new services spin up, old ones linger, and the invoice drifts. Undocumented resources, drifting tags, and scattered data (AWS CUR, Azure Cost Management, GCP BigQuery) make reviews painful. Firefighting wins sprints; optimization slips.
What you see after rollout: real cost savings — 10–25% in 90 days — with SLOs intact. Allocation climbs past 90%, owners sign off monthly, and cloud costs stabilize. Finance stops chasing reclasses; Engineering stops defending line items. Forecast variance tightens to ±8–10%; commitments run >95% utilization.
Cloudaware users have a bunch of dashboards and methods to control this process
- Ingest billing → CMDB → normalize by app/team/env.
- Auto-remediate missing keys.
- Rightsize with p95 latency guards; schedule non-prod shutdowns (no rollbacks).
- Plan RI/SP/CUDs alongside sprint capacity; track utilization weekly.
- Route anomalies to service owners; auto-open tickets; close the loop with dashboards.
- Let optimization tools enforce policies; keep owners accountable.
Who keeps it green: FinOps + Service Owners — weekly anomaly triage, monthly allocation, and commitments reviews.
Read also: Cloud Cost Optimization Framework - 11 Steps to reducing spend in 2026
Cost management visibility by service, team, and environment
The pain is familiar: cloud invoices land as a wall of SKUs; shared resources blur ownership; tags drift; and the data from AWS CUR, Azure Cost Management, and GCP BigQuery never lines up. Reviews turn into archaeology while spending keeps rising and no one can say which app, which team, which env actually drove the cost.
Here’s what changes after cloud cost optimization lands: every dollar rolls up to a service, a team, and an environment you recognize. Allocation clears ≥90–95%, owners sign off, and showback stops the debates. Forecast variance tightens, exec dashboards answer the “where and why” in seconds, and accountability alone unlocks measurable cost savings.
Example of the spend allocation in Cloudaware:
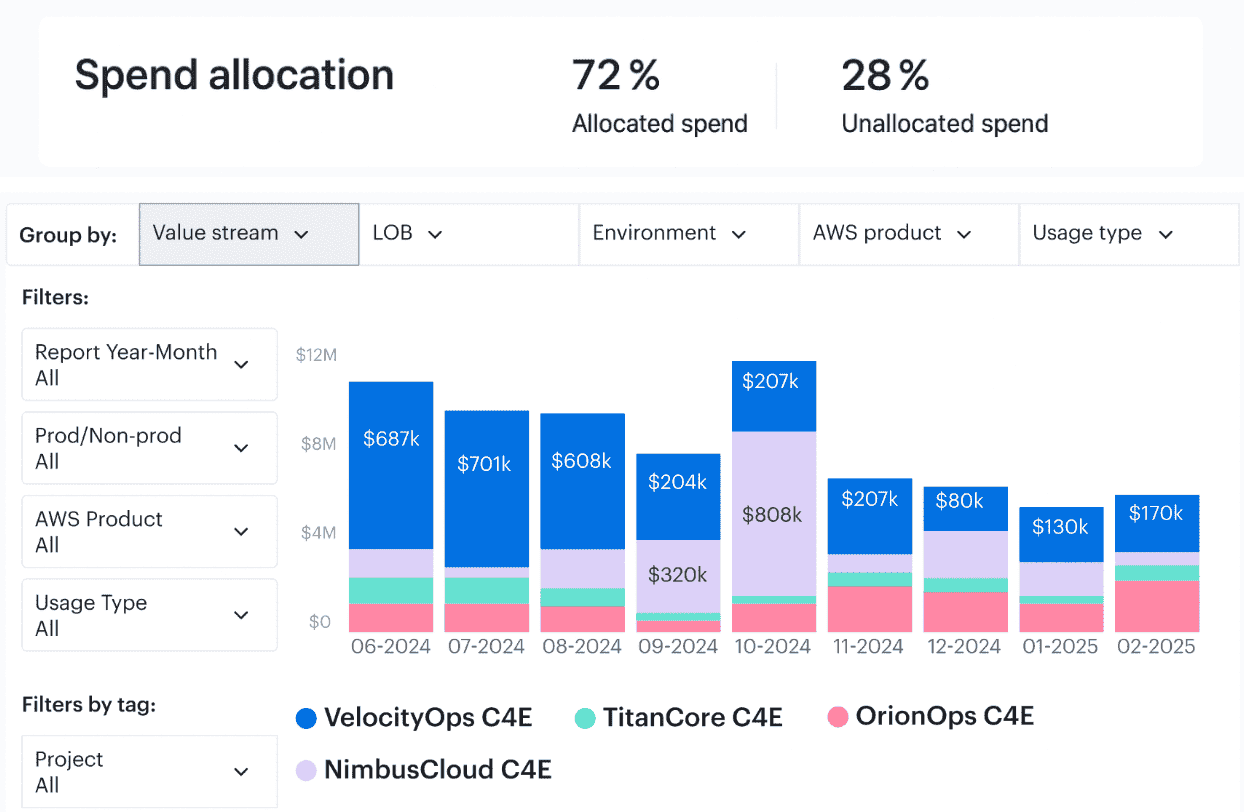 Cost allocation example in Cloudaware. Schedule a call to see it live.
This is the moment you feel, viscerally, why cloud cost optimization is important to the business.
How it becomes real:
- billing streams into the CMDB;
- we normalize by app/service/team/env;
- tag gates run in CI/CD;
- virtual tags backfill gaps;
- and a service catalog anchors ownership.
Showback/chargeback policies sit next to code, dashboards surface cloud costs per service, and anomaly routes ping the right owner. Your optimization tools plug in to enforce schedules and cleanup, while management cadence keeps decisions moving across hybrid environments used by modern companies.
Who keeps it green: FinOps + Service Owners — weekly allocation & anomaly reviews; monthly chargeback and forecast checkpoints.
Read also: How Cloud Experts Use 6 FinOps Principles to Optimize Costs
Optimize costs by eliminating waste at the source
The mess shows up on the invoice first: a cloud full of forgotten resources, drifted tags, and data that doesn’t reconcile across CUR, Azure, and BigQuery while spending ticks up. Finance asks for explanations; Engineering has no clean roll-up by service; management needs proof, not screenshots.
What you see after rollout: measurable cost relief in weeks. Idle EC2/RDS trimmed, unattached EBS and ENIs cleared, stale snapshots purged, non-prod on schedules, and K8s requests/limits aligned to p95. Storage moves to the right tier. Cloud costs fall, utilization rises, and owners sign off because every dollar is mapped to a service, team, and environment.
What is a key advantage of cloud cost optimization? You capture savings before waste ever hits the bill.
Behind the scenes process making it real in Cloudaware
- Pipe AWS CUR + Azure Cost Management + GCP BQ into the CMDB; tie assets to app/team/env (cloud cost optimization baseline).
- Detect waste patterns: EBS with 0 I/O, LBs with no targets, RDS under 10% p95, over-requested CPU in clusters — codified as policies.
- Enforce TTL and tag gates in CI/CD; the platform opens cleanup PRs automatically.
- Apply FinOps lifecycle rules and off-hours schedules; rightsizing with SLO guards so rollbacks stay near zero.
- Send route problems to the service owners, keep track of how many people accept them in Jira, and close the loop in shared dashboards.
- Let optimization tools keep rules up to date so that cost optimization works in all releases and environments.
Who keeps it green: FinOps and Service Owners do weekly evaluations of waste and anomalies and monthly checks on allocations and obligations.
Forecast cloud spending you can hit (±5–10% variance)
Month-end used to feel like guesswork: usage bursts nobody flagged, tags that slipped mid-sprint, and data threaded across AWS CUR, Azure EA exports, and GCP billing that never told one story. Finance wanted a number they could book; Engineering needed room to ship; you needed a forecast that held when one team scaled resources.
Here’s the shift: inside a quarter, your forecast settles at ±5–10%. Run-rate by service, team, and environment stays predictable; seasonality lives in the model; launches show up in plan before they hit the meter.
The business sees steady cloud costs, Finance closes accruals without firefights, and Engineering stops defending line items. Those are tangible cloud cost optimization benefits.
Behind the scenes process making it real
How Cloudaware makes it real: AWS, Azure, and GCP billing flow into the CMDB, where spend is stitched to services with live ownership.
The platform learns your burn — workdays vs. weekends, batch windows, release cadence — and blends top-down budgets with bottom-up drivers like reservations/utilization, rightsizing deltas, and off-hours schedules.
Anomaly alerts tighten the curve by routing spikes to the right owner before they distort trendlines. Mid-month, actuals vs. plan get nudges to owners, so management can steer early.
That’s evidence-based cost optimization supported by Cloudaware’s daily updates, alerts, cross-cloud dashboards, and forecasting.
Read also: What Is Rightsizing in Cloud Cost Optimization? Pro Insights
Commitments that pay, not bite
You’ve seen it — someone locks in Reserved Instances on AWS, usage shifts, and now that “discount” is costing more than on-demand. The resources are misaligned, Finance flags gaps in the coverage report, and Engineering avoids new workloads because capacity's already spoken for.
After cloud cost optimization, that changes fast. Coverage settles in the 60–85% range; utilization climbs to >95%. One team went from 68% to 96% in 45 days — tracked in Cloudaware’s RI/SP dashboards, visible to Finance with zero Excel wrangling. Forecast variance tightens, effective rates drop up to 40%, and every committed dollar shows up where it should: inside a real service envelope.
No more overcommitted regrets. Just smart, trackable cost optimization that pays for itself.
Behind the scenes process making it real
Here’s how Cloudaware makes that happen: billing data lands in the CMDB, linked to services and teams in live environments. The platform models demand using real data — scaling trends, off-hours plans, usage baselines. So when commitments are purchased, they match the estate, not a guess. Forecasts update with new rates.
Example of the forecast dasboard report element.
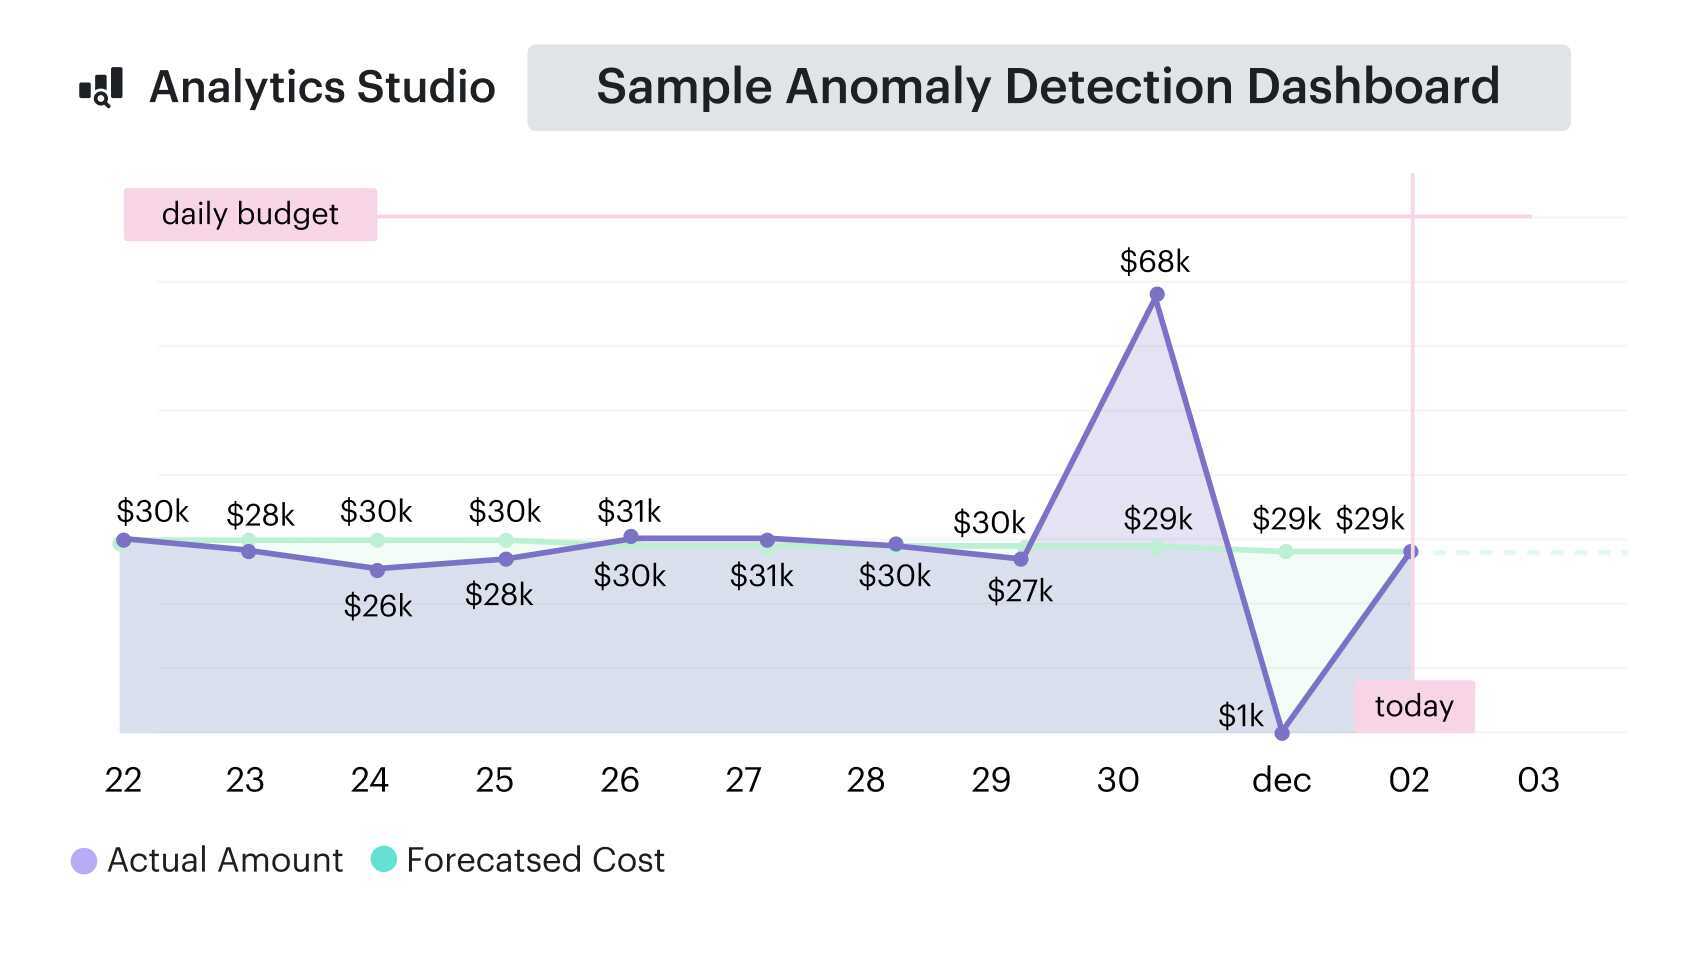
Schedule a call to see it live.
Utilization’s watched by the same tools that flag anomalies. If drift starts, owners get pinged. No noise. No lag. Just clean cloud spend, anchored in visibility and shared ownership.
And when Finance asks why this month’s bill actually dropped? You’ve already got the answer. So does the dashboard.
Rightsizing that protects performance
Rightsizing always sounds like an easy win — until the first rollback hits prod. You scale down an instance, latency jumps, and no one touches compute again for six months. Engineers stop trusting the process. Infra waste stacks up quietly across AWS, Azure, and GCP. Finance asks about cost, and no one has a confident answer.
After rolling out cloud cost optimization, that hesitation flips. Teams approve recommendations because they come with proof — p95 CPU and memory overlays, rollback thresholds, and live risk flags. One customer running production in US-East and EU-West dropped compute cloud costs by 27% in just 60 days — four instance families rightsized, no alert spikes, zero SLO hits. Capacity matched demand, not guesswork. The business saved money. Engineering saved time. No debates, no firefights.
Behind the scenes process making it real
Here’s how Cloudaware does it: the platform maps billing and telemetry data to services and teams through the CMDB. It scans underutilized resources daily, calculates rightsizing confidence scores, and packages everything in a clean dashboard.
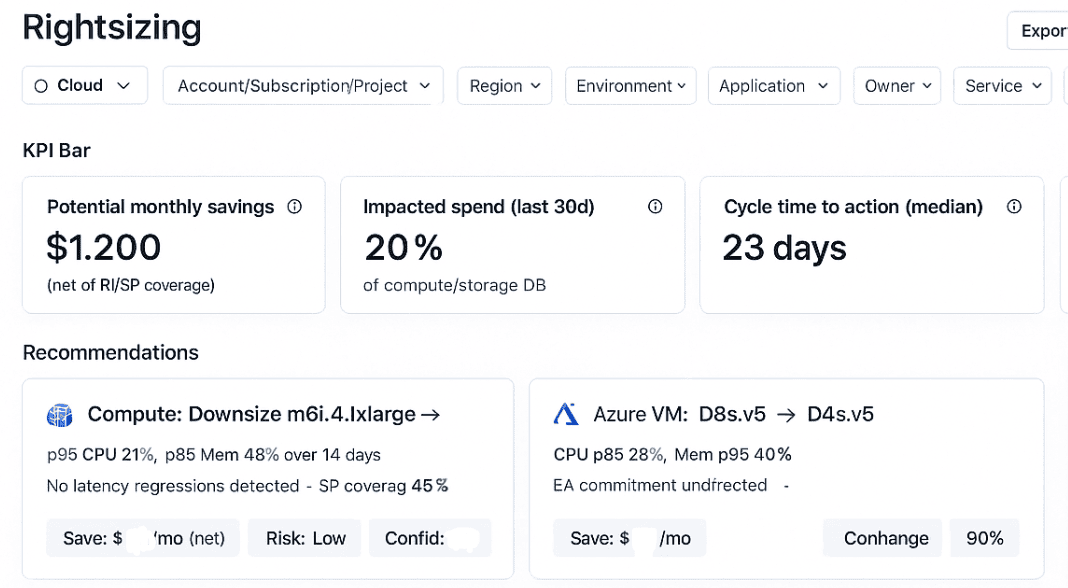
Schedule a call to see it live.
Each recommendation shows usage trends, performance history, and rollback criteria. When approved, automation triggers the resize, monitors impact, and notifies in Slack. If metrics dip, it rolls back — no ticket needed. This isn’t one-off scripting. It’s a release-safe loop your team can actually use.
That’s the kind of cost optimization you want running behind the scenes — quiet, proven, and trusted. One of the real operational benefits of cloud cost optimization? Rightsizing that never makes you flinch.
Anomalies contained before they snowball
After rightsizing settles and you’ve cleaned up oversized resources, you expect some stability. But then a test cluster runs 24/7, a misconfigured autoscaler triples instances, or a vendor’s pricing change slips through — and the cloud costs quietly spike. No alerts. Just a surprise waiting in your next invoice.
The moment cloud cost optimization implemented, that delay disappears. One Cloudaware customer caught a GCP load test that would’ve burned $18,000 in a week — alert fired within 45 minutes, owner resolved it the same day. That’s not luck, that’s detection with context. Alerts hit Slack, not your billing inbox. Cost exposure is cut off before it snowballs. And the business stops budgeting for damage control.
Behind the scenes process making it real
Cloudaware makes this real by wiring billing data into the CMDB, tagging every dollar to a team, service, and environment. The platform watches usage and spending daily across compute, storage, and third-party services — then flags variances against historical patterns.
When something drifts, anomaly alerts route directly to the owner via ticket or Slack, with actual cost delta and impacted resources. You don’t need to go hunting. It’s already there — explained, contextualized, actionable.
Example of email alert:
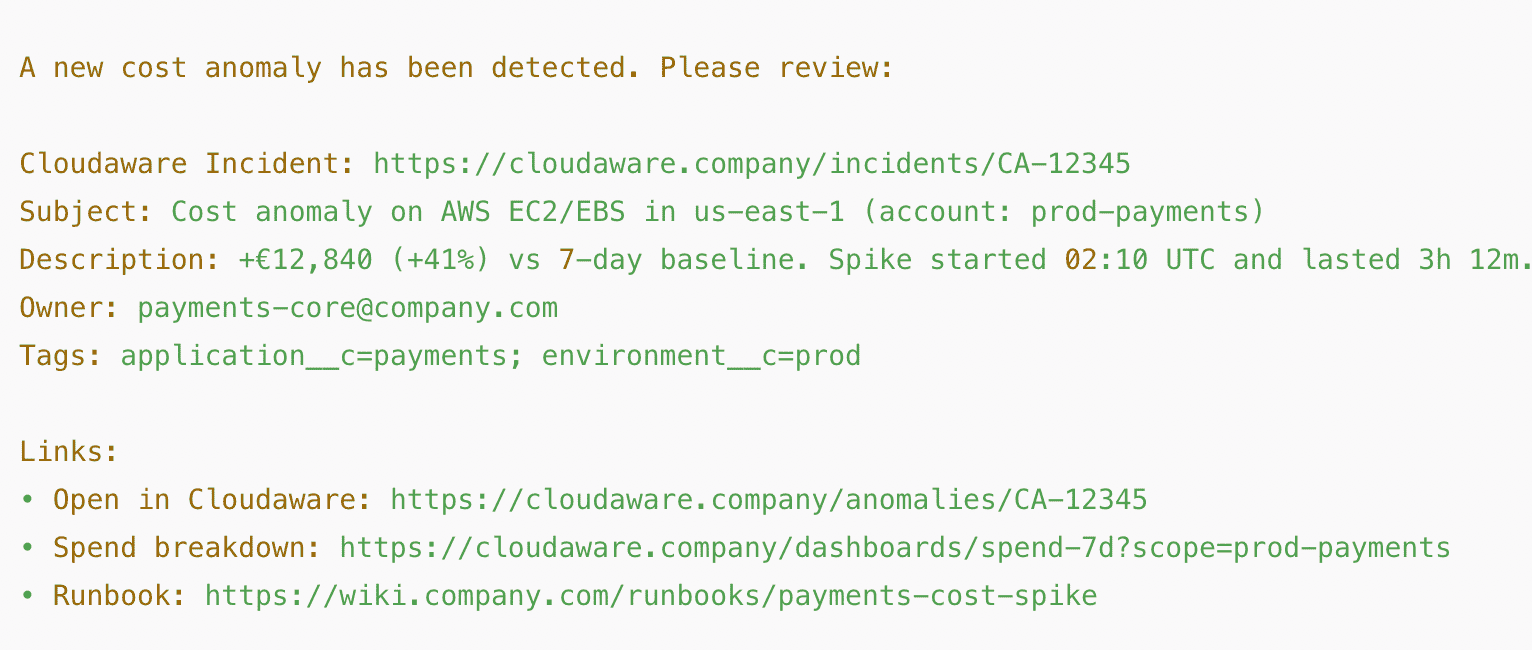
Tools don’t just signal noise. They shorten MTTR, reduce variance, and prove to management that your cost optimization process is doing what it should: protecting the budget, not just reporting on it.
That’s one of the most overlooked benefits of cloud cost optimization — a layer of defense your engineers respect and your finance team can count on.
Accountability that changes behavior
After you’ve caught a few spikes, right-sized the instances, and cleaned up stale resources, one question always hits: who approved this? Or worse — who owns this now?
Without real accountability, cost escalations turn into finger-pointing, cleanup becomes political, and shared services drift without a budget owner. Finance sees growing cloud costs and no clear contact. Engineering sees a Slack thread with no clear action.
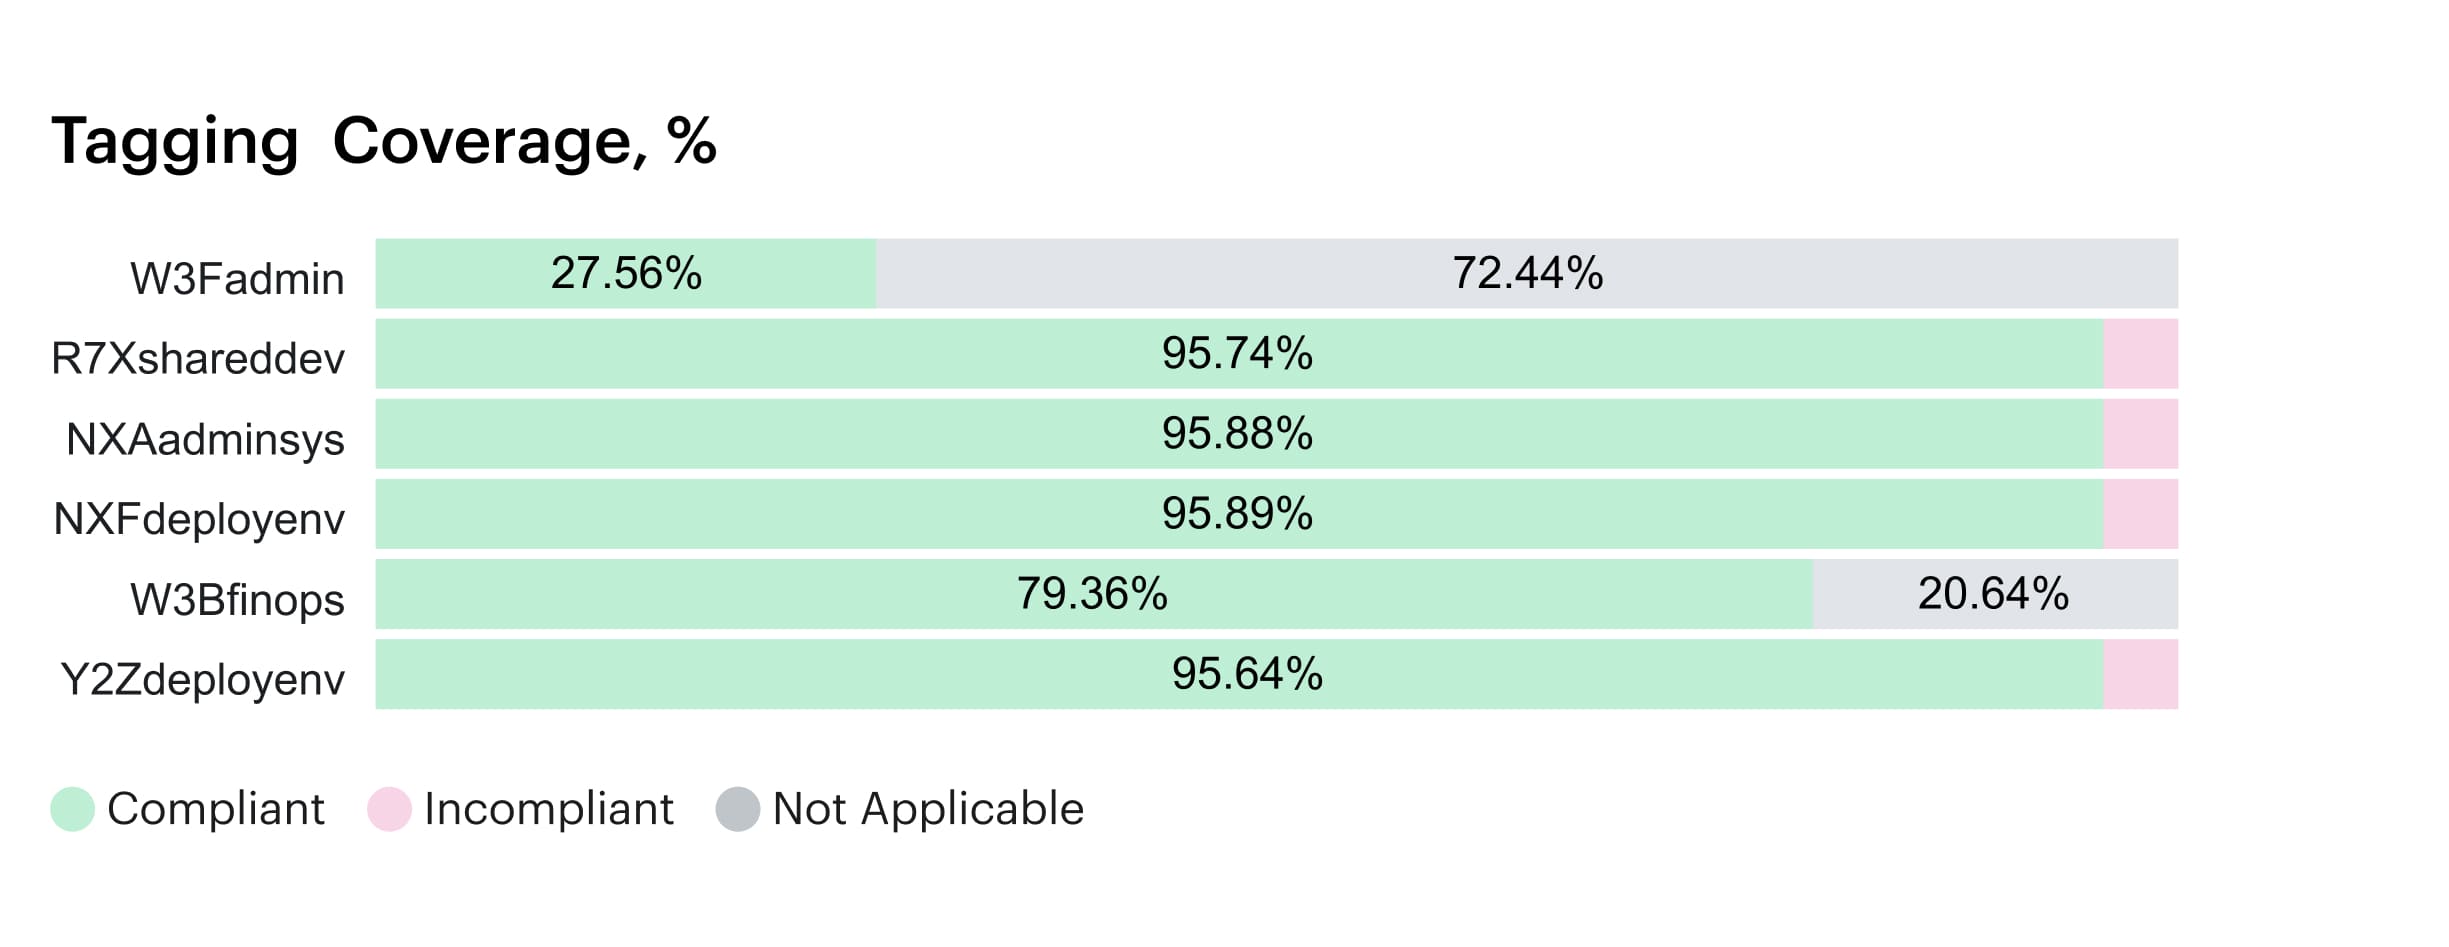
But once cloud cost optimization kicks in, ownership gets operational. One org saw a 92% reduction in unallocated spending within a quarter. Service owners now review usage monthly, and tags like application__c, environment__c, and owner_email__c hit 98% compliance. Cost reviews stop being a debate — they become a checklist.
Behind the scenes process making it real
Billing flows into the Cloudaware CMDB, tagging policies are enforced at deploy, and every dollar of cost is tied to a team, an app, and an environment. No ambiguity.
Tagging coverage report in Cloudaware:
Schedule a call to see it live.
The platform runs daily tag conformance scans, flags drift, and routes exceptions right to the team responsible — Jira, Slack, email, whatever they use.
Forecasts show owner-level impact. Dashboards show who’s over budget and why. And management finally sees cost tied to behavior, not just services. That’s cost optimization you can scale — because the accountability loop becomes part of how your business runs.
And that, is why cloud cost optimization is important. Not just to cut cloud costs, but to shift how teams think, plan, and own the data they burn.
Lower unit costs your CFO trusts
After we got ownership under control and teams started reviewing their cloud usage monthly, something else came into focus — unit economics. You’d think with all that data, we’d know what one user session or batch job actually costs.
But we didn’t. Not precisely. Services shared infra, instances weren’t tagged cleanly, and margin questions kept bouncing between Product, Finance, and Engineering. You can’t model pricing when no one trusts the inputs.
After rolling out, those unknowns became cloud cost optimization metrics. One company brought unit cost down by 19% in two quarters, just by tightening allocation, tuning commitments, and matching provisioned resources to actual throughput. Now their cost per API request updates weekly.
Margin by product line shows up on a dashboard. And when the CFO asks, they don’t get models — they get numbers.
Read also: FinOps Maturity Model - 7 Expert Moves You Can Steal
Behind the scenes process making it real
In Cloudaware, this shift starts upstream. The platform maps billing from AWS, Azure, and GCP to app, team, and environment using CMDB scopes. That means every instance, disk, gateway, and function lands inside an owner context with tagging enforced at deploy.
Then we sync telemetry — requests per second, batch volume, storage usage — through native connectors or ingestion APIs. You define the unit: order, job, GB transferred. Cloudaware connects that usage to actual cloud costs and builds per-unit cost overlays into forecasts.
The system flags when margin drops, when scale breaks cost drivers, and when your assumed unit rate no longer fits reality.
The team doesn’t need another BI tool. They get the truth in the same tools they use for change reviews, ticket queues, or budget sign-off. Management gets rate visibility. Engineers see cost trends on feature usage. And Finance gets numbers they can present in board decks without three rounds of clean-up. That’s cost optimization your org can run with.
And if anyone still asks why cloud cost optimization is important, show them your per-transaction margin improving without slowing a single deploy.
Scale without waste
Once your cloud cost per unit is stable and commitments are finally working in your favor, another layer shows up — scaling. Not the fun “big traffic spike” kind. The messy kind: idle instances sitting in auto-scaling groups, test services never decommissioned, non-prod environments running full throttle over weekends.
You scale up fast, but scale down? That’s where waste creeps in. And no one wants to chase it manually, because the data lives in five places and the owners have moved on.
After cloud cost optimization, scale actually behaves. One platform team cut off-hours spending by 36%, just by enforcing automated schedules and adding scale-down rules to their review flow. Their usage curve now trails their traffic pattern instead of running flat all night. And their Finance lead finally saw cost drop after traffic dropped — which didn’t happen before.
The same visibility unlocks deeper efficiency on Azure — especially when applying structured Azure cloud cost optimization to storage tiers, VM families, and scaling groups.
Read also: Cost Anomaly Detection - 6 Steps to Catching Cost Spikes Fast
Behind the scenes process making it real
Cloudaware makes this part feel automatic. The platform maps scaling behaviors to services and environments through the CMDB. It sees usage, schedules, and thresholds.
When traffic drops and resources go underused, it flags it — then checks if scale-down actions were actually applied. You can tie this to your Git flow, so scale policies are versioned with the app, or let the engine run enforcement across defined scopes. Either way, waste doesn’t linger.
The system pushes change tickets or schedules cleanup automatically — using the tools your teams already rely on.
Management sees this in dashboards: off-hours usage, scale lag, idle rates.
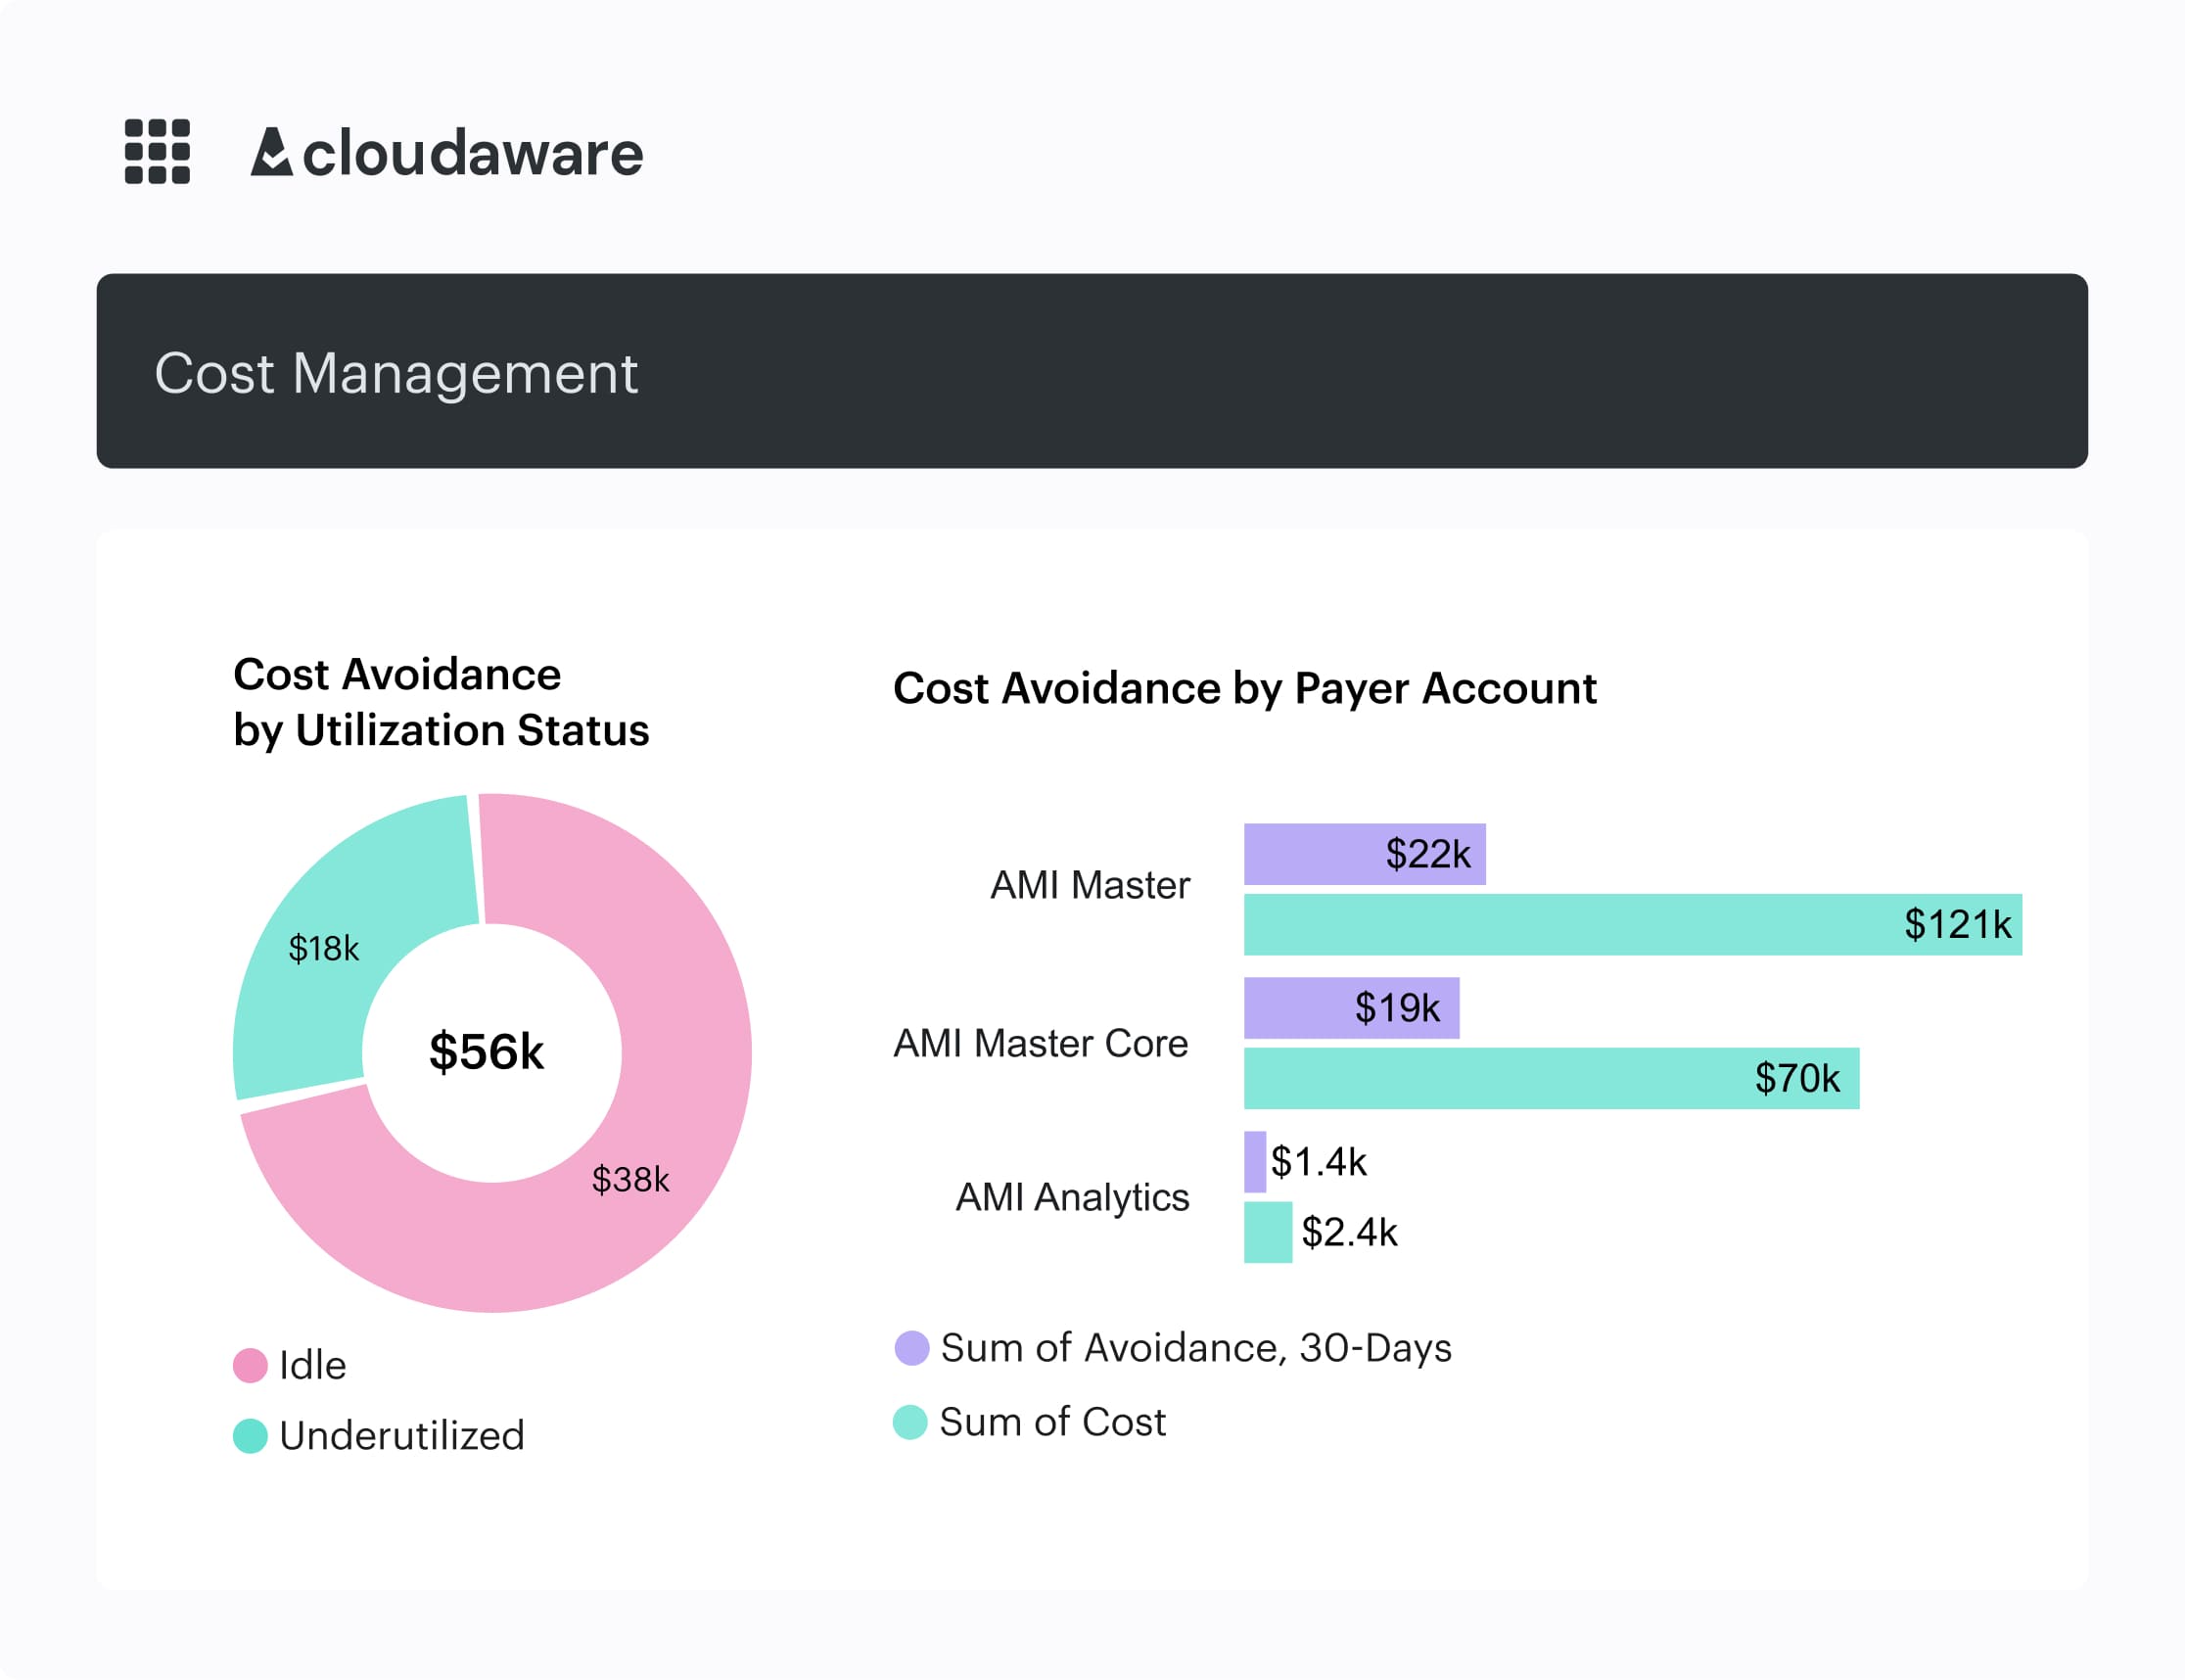
Element of the idle cost report. Schedule a call to see it live.
Engineers get it in Slack and Jira, with context. Everyone aligns before the next traffic bump hits. That’s one of the quiet benefits of cloud cost optimization — your cloud estate grows, but the cost doesn’t spiral with it. Because scale without discipline isn’t growth. It’s just expensive.
Make these cloud cost optimization benefits real with Cloudaware
Cloudaware centralizes cloud billing from AWS, Azure, Oracle, Alibaba, and GCP into one CMDB-enriched view, so every dollar links to real CIs (apps, teams, environments). You get reliable data with fixed tags (including virtual tags and conformance scans) plus cross-cloud dashboards. That foundation enables durable cost control and accountable management of spending.
Core value: full visibility of cloud costs in one place — billing + usage + tagging — mapped to services and owners. The docs explicitly call out daily updates, advanced alerts, and enterprise visibility (“no more spreadsheets”).
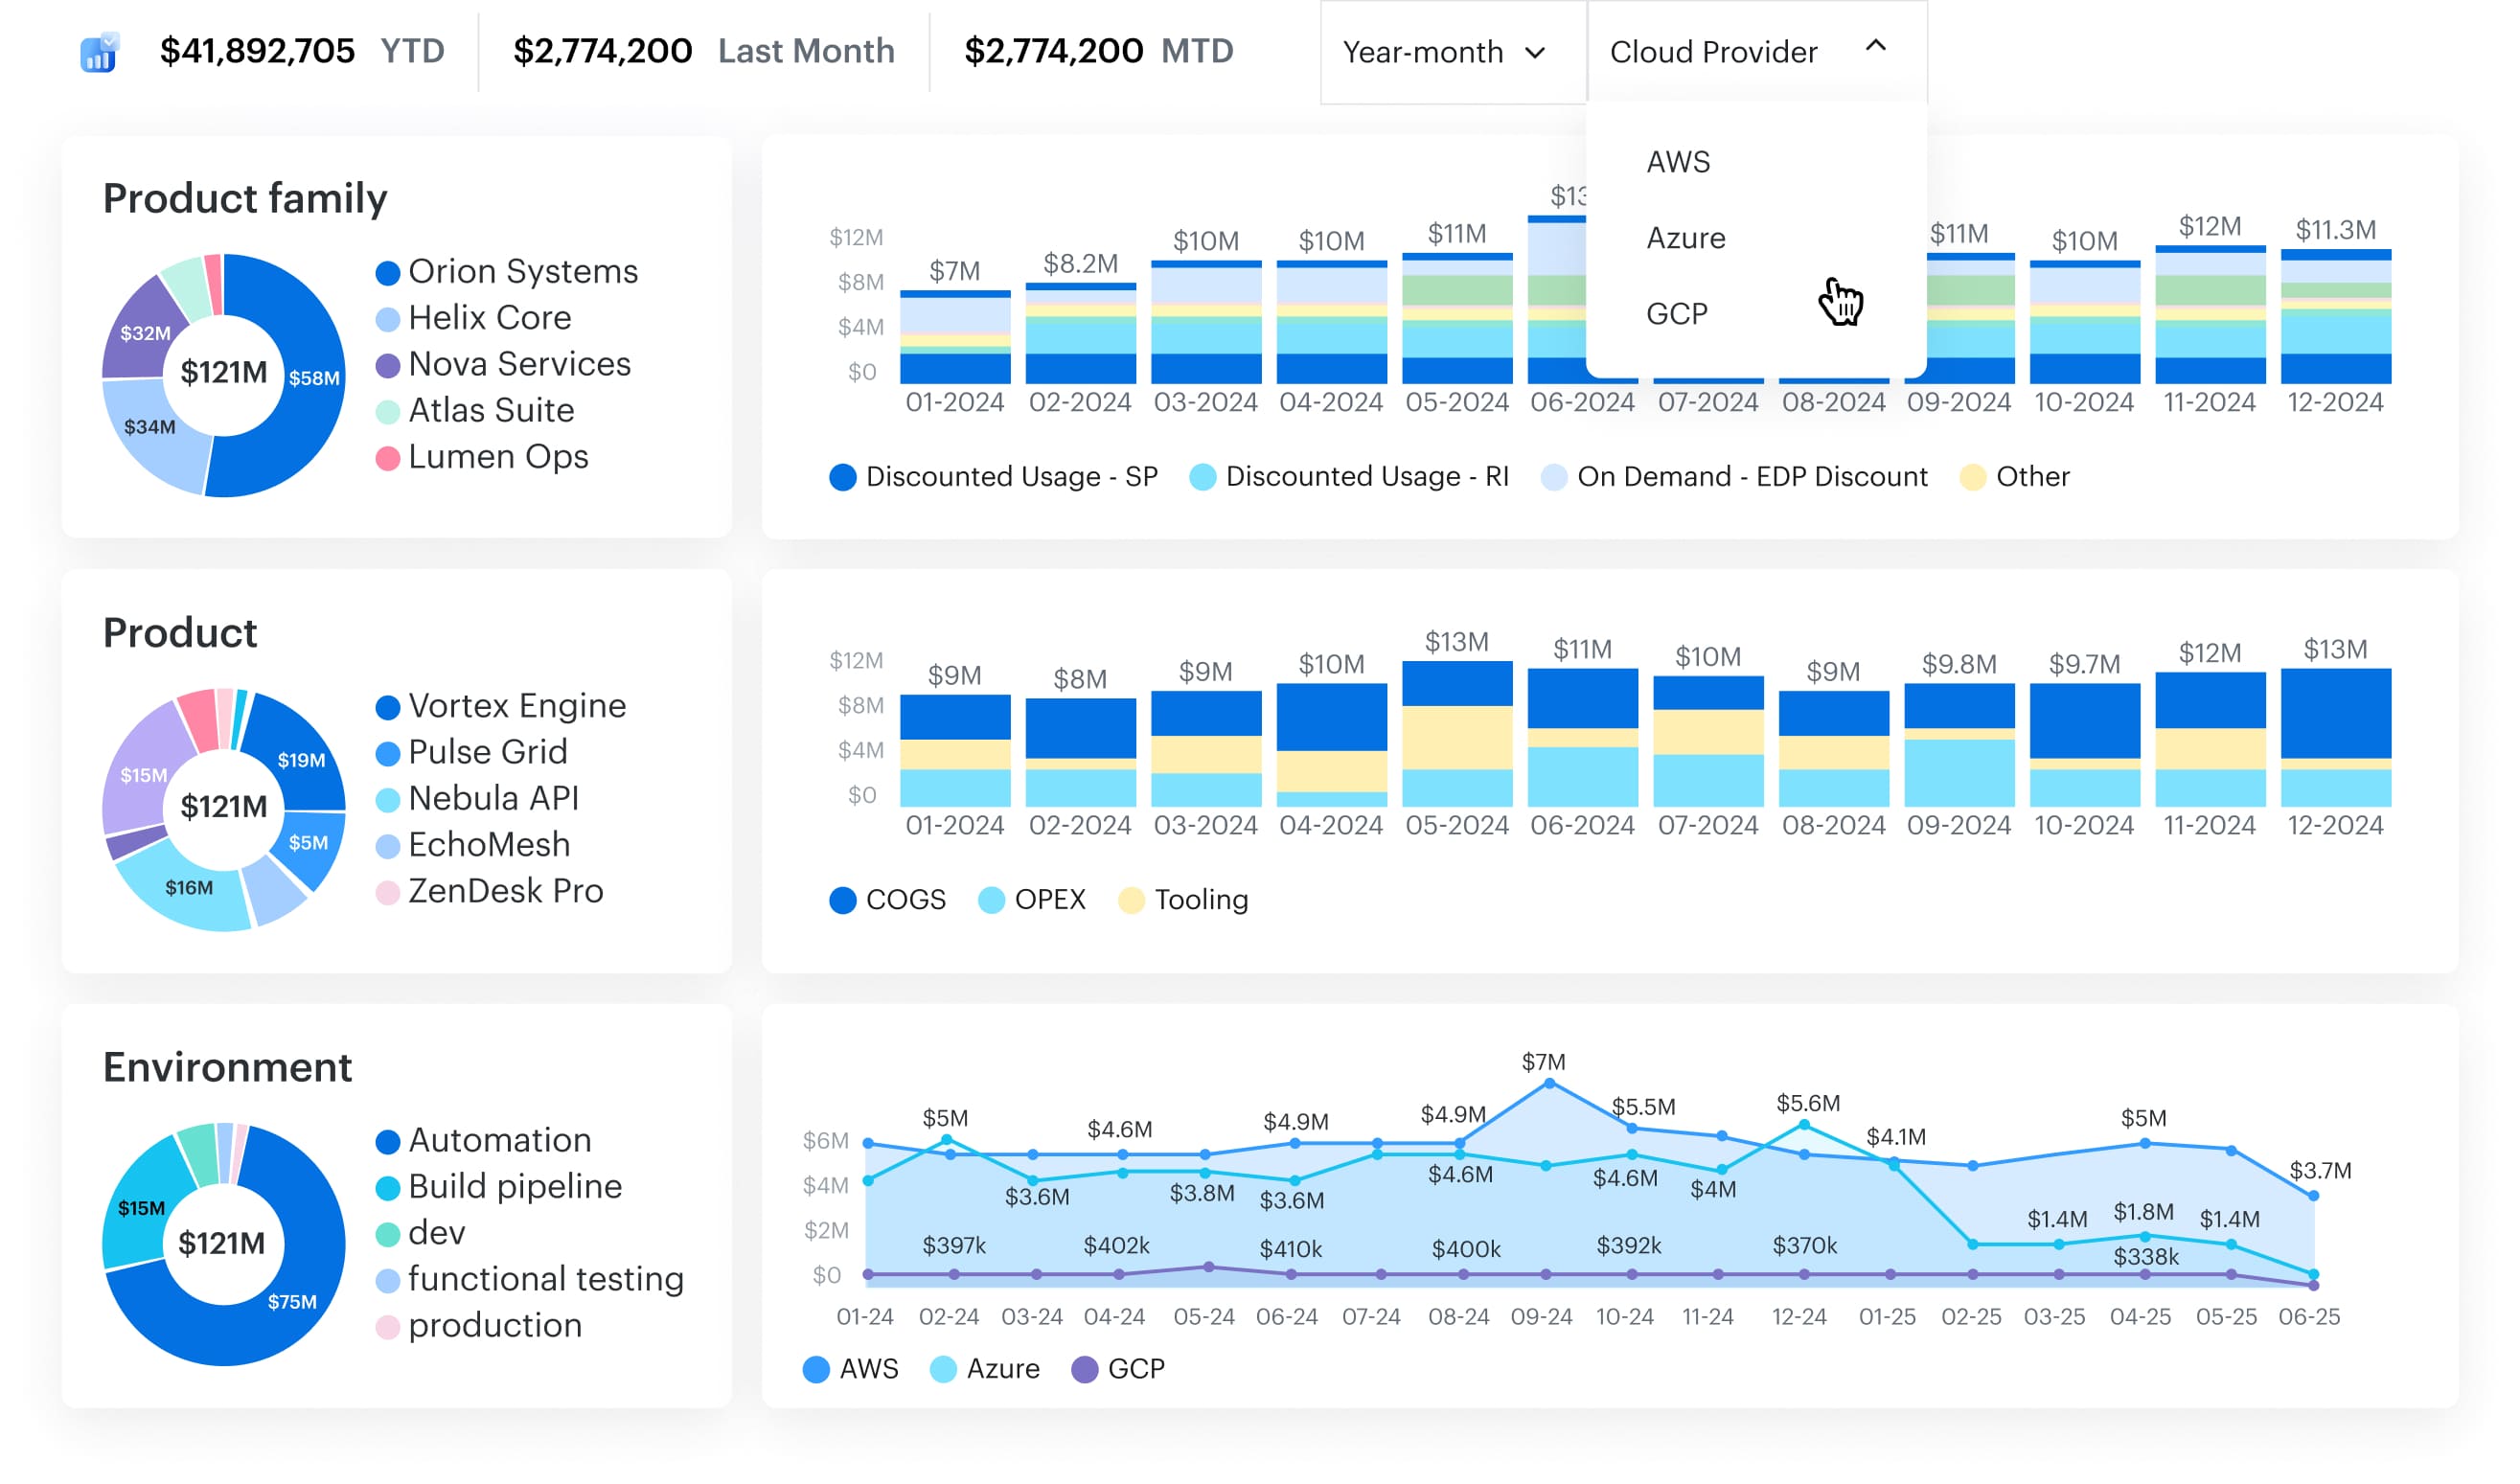
How it turns visibility into outcomes
- Billing → CMDB mapping: Daily pipelines ingest CUR/EA/GCP billing and bind it to CIs in the Salesforce-native CMDB (service/team/env). Cross-cloud cost analysis dashboards are supported.
- Tagging governance: Tag conformance & virtual tags stabilize reports; GCP note — instance-level views require tags because GCP doesn’t split costs per instance by default.
- Dashboards & analytics: Force.com reports/dashboards for spend, RI/SP coverage & utilization, and rightsizing analytics.
- Commitments insight: Native objects for AWS, GCP, Azure reservations and Savings Plans (coverage/utilization) for effective-rate tracking.
- Forecasting: Supported (“Yes” in FAQ) and aligns with the cross-cloud cost model.
- Alerts: Daily updates + advanced alerts help “eliminate surprises” and surface when to dig deeper.
- Unified cost analytics: Cross-cloud dashboards by service/team/environment or any object within CMDB; showback/chargeback supported via reports and allocation.
- Budget alerts & spend breakdowns: Budget alerts, daily email reports, and spending breakdown features.
- Waste & rightsizing analytics: Automatic waste discovery + rightsizing views.
- RI/SP/CUD insights: Coverage/utilization tracking across providers to inform purchases and renewals.
- Forecasts & effective cost: Forecasting + “effective cost” (amortized RI/Savings Plans) on instances.
- Enterprise sharing & RBAC: Share dashboards, restrict who sees billing; open API access.
With clean ownership and reliable mappings, cost optimization becomes routine and safe. You get actionable insights that Engineering trusts and Finance can book. That is the practical side of cloud cost optimization — evidence first, action second.
