


Have your spend jumped? EC2 burst, BigQuery queries multiplied or Azure SQL I/O spiked? NAT egress doubled, a fresh GPU node pool came online, and Budgets stayed quiet. Slack erupted, Jira waited for an owner, Finance wanted numbers.
That’s when cost anomaly detection can save you — fast detection, clear root cause, routed to the right team.
Everything here comes from my crew — FinOps experts with 10+ years in the weeds. They work with teams living in AWS CUR/Athena, Azure Cost Management exports, and GCP Billing BigQuery.
In this post we’ll dig into:
- What signals separate a real cost anomaly from noise in CUR, exports, and BigQuery?
- How does anomaly detection baseline seasonality and handle deploy windows and Kubernetes namespaces?
- How do AWS, Google Cloud, and Azure wire alerts into Slack/Jira with ownership?
- Which tools justify their cost with hard benefits you can measure?
- How to run a low-noise, owner-routed program with Cloudaware — thresholds, suppressions, learning loops.
First, let’s check if we’re on the same page about definition 👇
What is cost anomaly detection?
Think of cloud cost anomaly detection as a nonstop, laser-focused guard for your bill. We baseline normal spending per service, account, region, tag — even Kubernetes namespace — using AWS CUR/Athena, Azure Cost Management exports, and GCP Billing BigQuery.
The engine learns patterns, scores any anomaly, and fires alerts with who/what/where so you can monitor and act inside Slack or Jira without losing the thread.
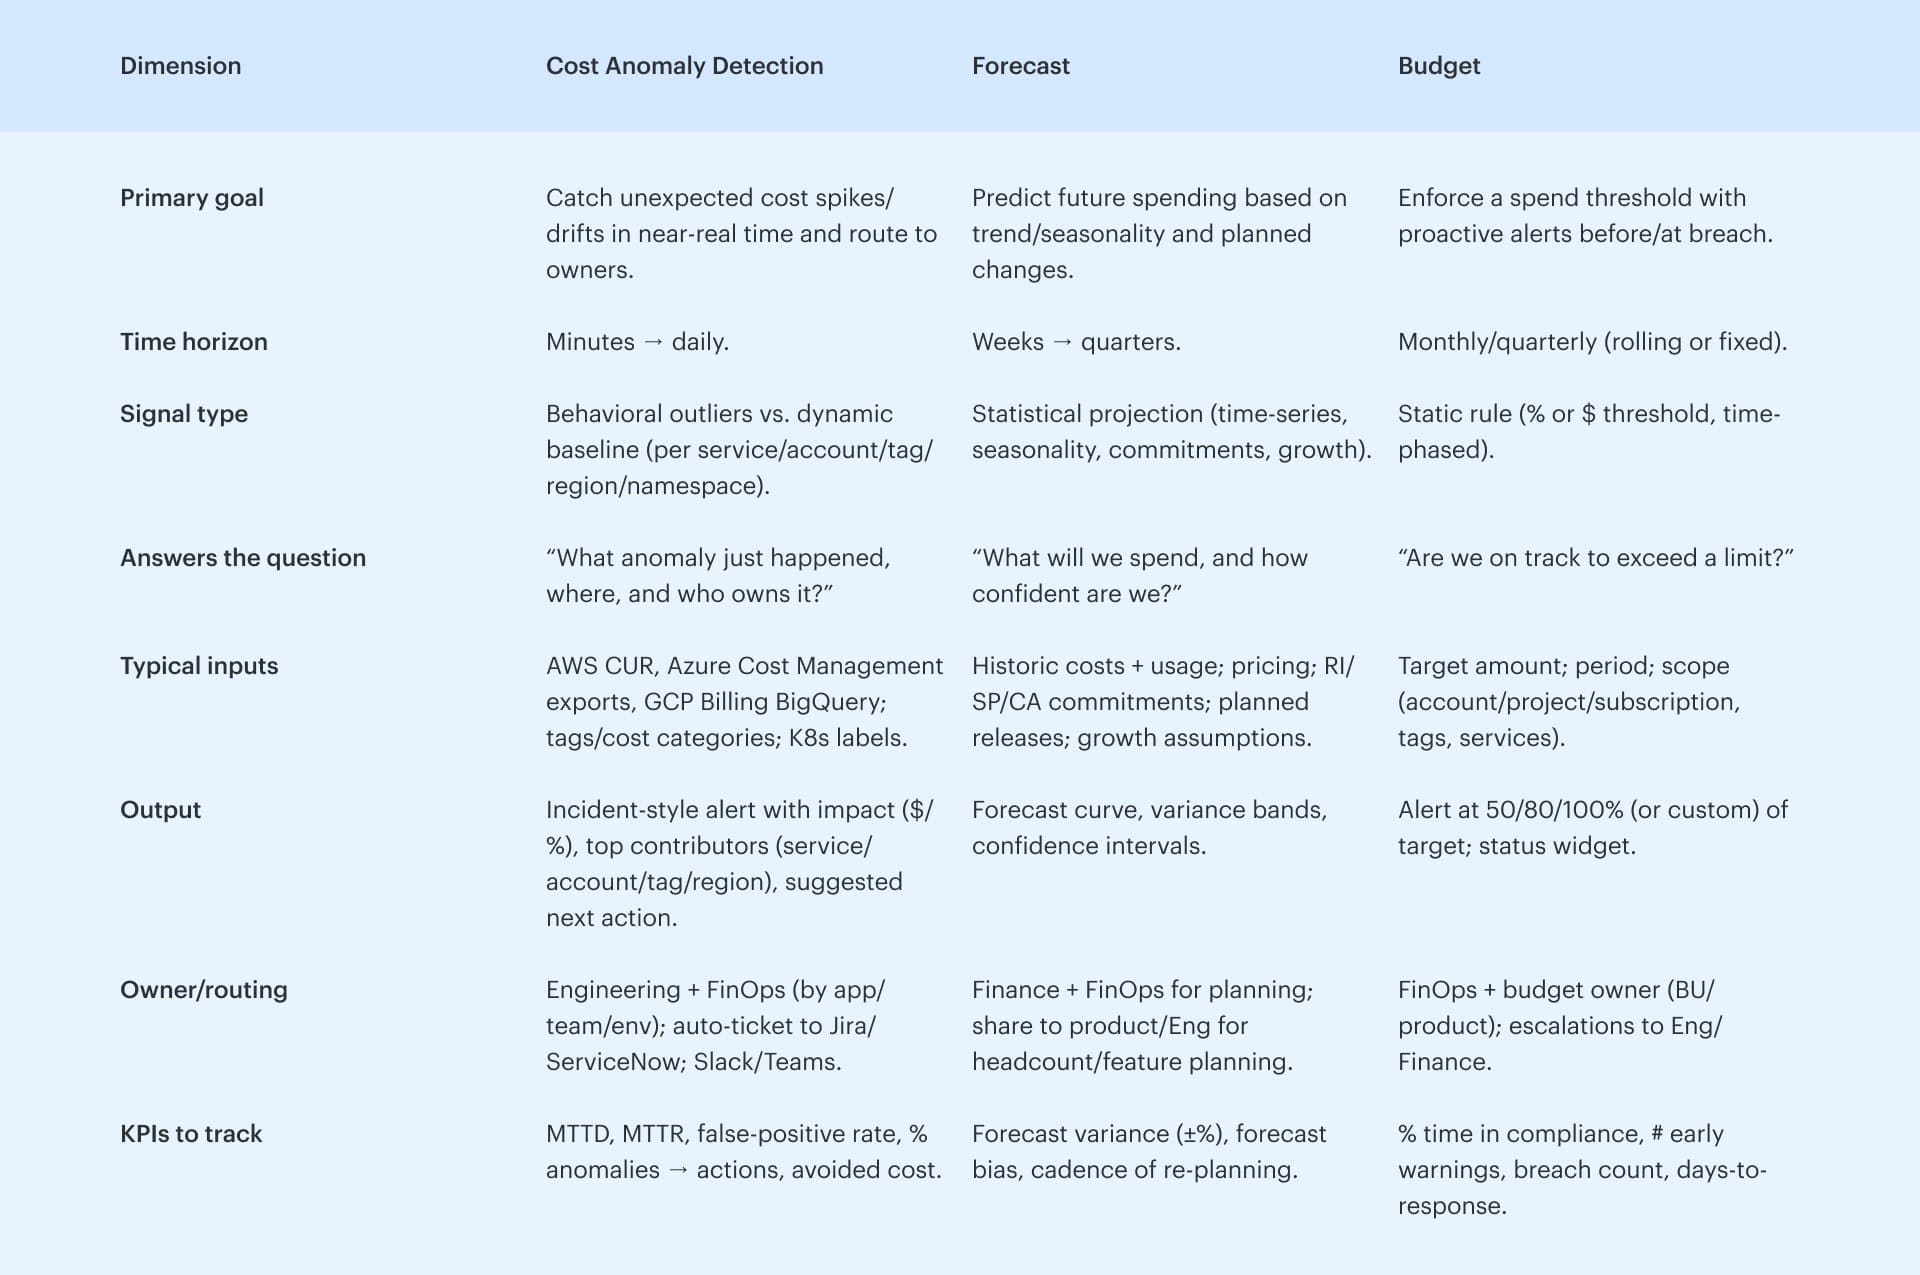
👉 Avoid mixing it with forecasting or budgeting — those are separate practices.
Budgets set thresholds you declare. Forecasts project expected costs based on seasonality. Anomaly detection listens to live cloud spend, adapts baselines, and spots unexpected movements you didn’t script in advance — linking them to the dimensions you care about: service, tag, account, region, and workload.
Cloud cost anomaly detection is a must-have process within your FinOps workflow.
And fewer surprise invoices and shorter investigations are just a small part of the arguments to impellent it. Find more below 👇
Why anomaly detection is vital for your FinOps
Wondering if cost anomaly detection worth your time and budget?
Fair. You’ll need to set best practices, tune baselines and thresholds, wire owner routing, and coach the team.
But the upside is solid. Industry research points to faster MTTD/MTTR and fewer bill shocks; meanwhile, Cloudaware customers see it in FinOps dashboards every week.
So, before you defer, consider the arguments below — the why, the how, and the outcomes you can actually bank.
- Same-day visibility (MTTD moves from days → hours). FinOps platforms monitor costs hourly and raise alerts in real/near-real time, so spikes surface today — not on the invoice. In production data, single anomalies routinely represent 18%–200% of a monthly bill; catching them the same day is the difference between a blip and a budget issue.
- Lower MTTR on high-impact spikes (hour-scale, not war rooms). Platforms package RCA context (service/account/project/region/tag) right inside the alert, which compresses triage loops. Industry incident-ops benchmarks show targeted routing/automation driving ~30% reductions in MTTA/MTTR — the same operational pattern your cost anomalies follow. Expect a double-digit MTTR improvement once alerts land with the on-call owner.
- Budget risk pulled forward. Near-real-time detection turns unplanned spend into same-day owner action, which reduces the overrun tail and stabilizes monthly reviews.
- Material waste reclaimed — from a large, proven pool. Enterprises estimate ~27% of cloud spend is wasted. Anomaly-driven triage finds the runaways (GPU bursts, NAT egress, stuck jobs) and converts them into savings tickets with dollar impact.
- Accountability improves; “who owns this?” goes away. Owner-mapped alerts (app/team/env) mean the first ping reaches the responsible engineer, not a shared inbox. With cost visibility still the top pain (84% of orgs), routing to the accountable owner shortens the time from “what changed?” to action and raises allocation coverage toward “minimal unallocated” spend — an explicit FinOps maturity goal.
- Lower noise → higher signal (target false-positive rate <10%). Platforms let you set impact thresholds and feedback loops, so only meaningful anomalies page people. FinOps treats Anomaly Management as a measured practice; teams that tune sensitivity and suppress known events consistently hold FP-rates in single digits — an operational SLO you can enforce.
- Faster savings conversion (alerts → backlog → booked impact). When every cost anomaly auto-creates a tracked work item with owner and $ impact, closure rates rise — and Finance sees avoided spend in the same dashboard as actuals. Public platform data shows thousands of anomalies captured and meaningful dollars per hour at risk, validating the pipeline from alert to booked benefit.
Impressed? Here is the behind the scenes process making it real 👇
How it works: cost anomaly detention lifecycle
Cloud cost anomaly detection works like this: baseline your typical spending, track it across dimensions like service, account, region, and tag, then trigger alerts when the model spots unusual costs. Each monitor runs on fresh billing data and feeds into your cost management flow. But here’s where it gets interesting — Google tracks anomalies hourly, AWS links root cause directly to Cost Explorer, and Azure runs it inside their native management views.
Let’s break down how each cloud handles it.
AWS Cost Anomaly Detection
AWS Cost Anomaly Detection builds a behavioral baseline per dimension — service, linked account/OU, region, usage type, tag/Cost Category — then scores new spend against that baseline and computes impact in $ and %.
You define monitors (AWS Services, Linked Accounts, Cost Categories/Tags) and subscriptions (immediate/daily/weekly) so when an outlier pops, the alert includes ranked top contributors (e.g., EC2 in acct A, us-east-1, DataTransfer-Out).
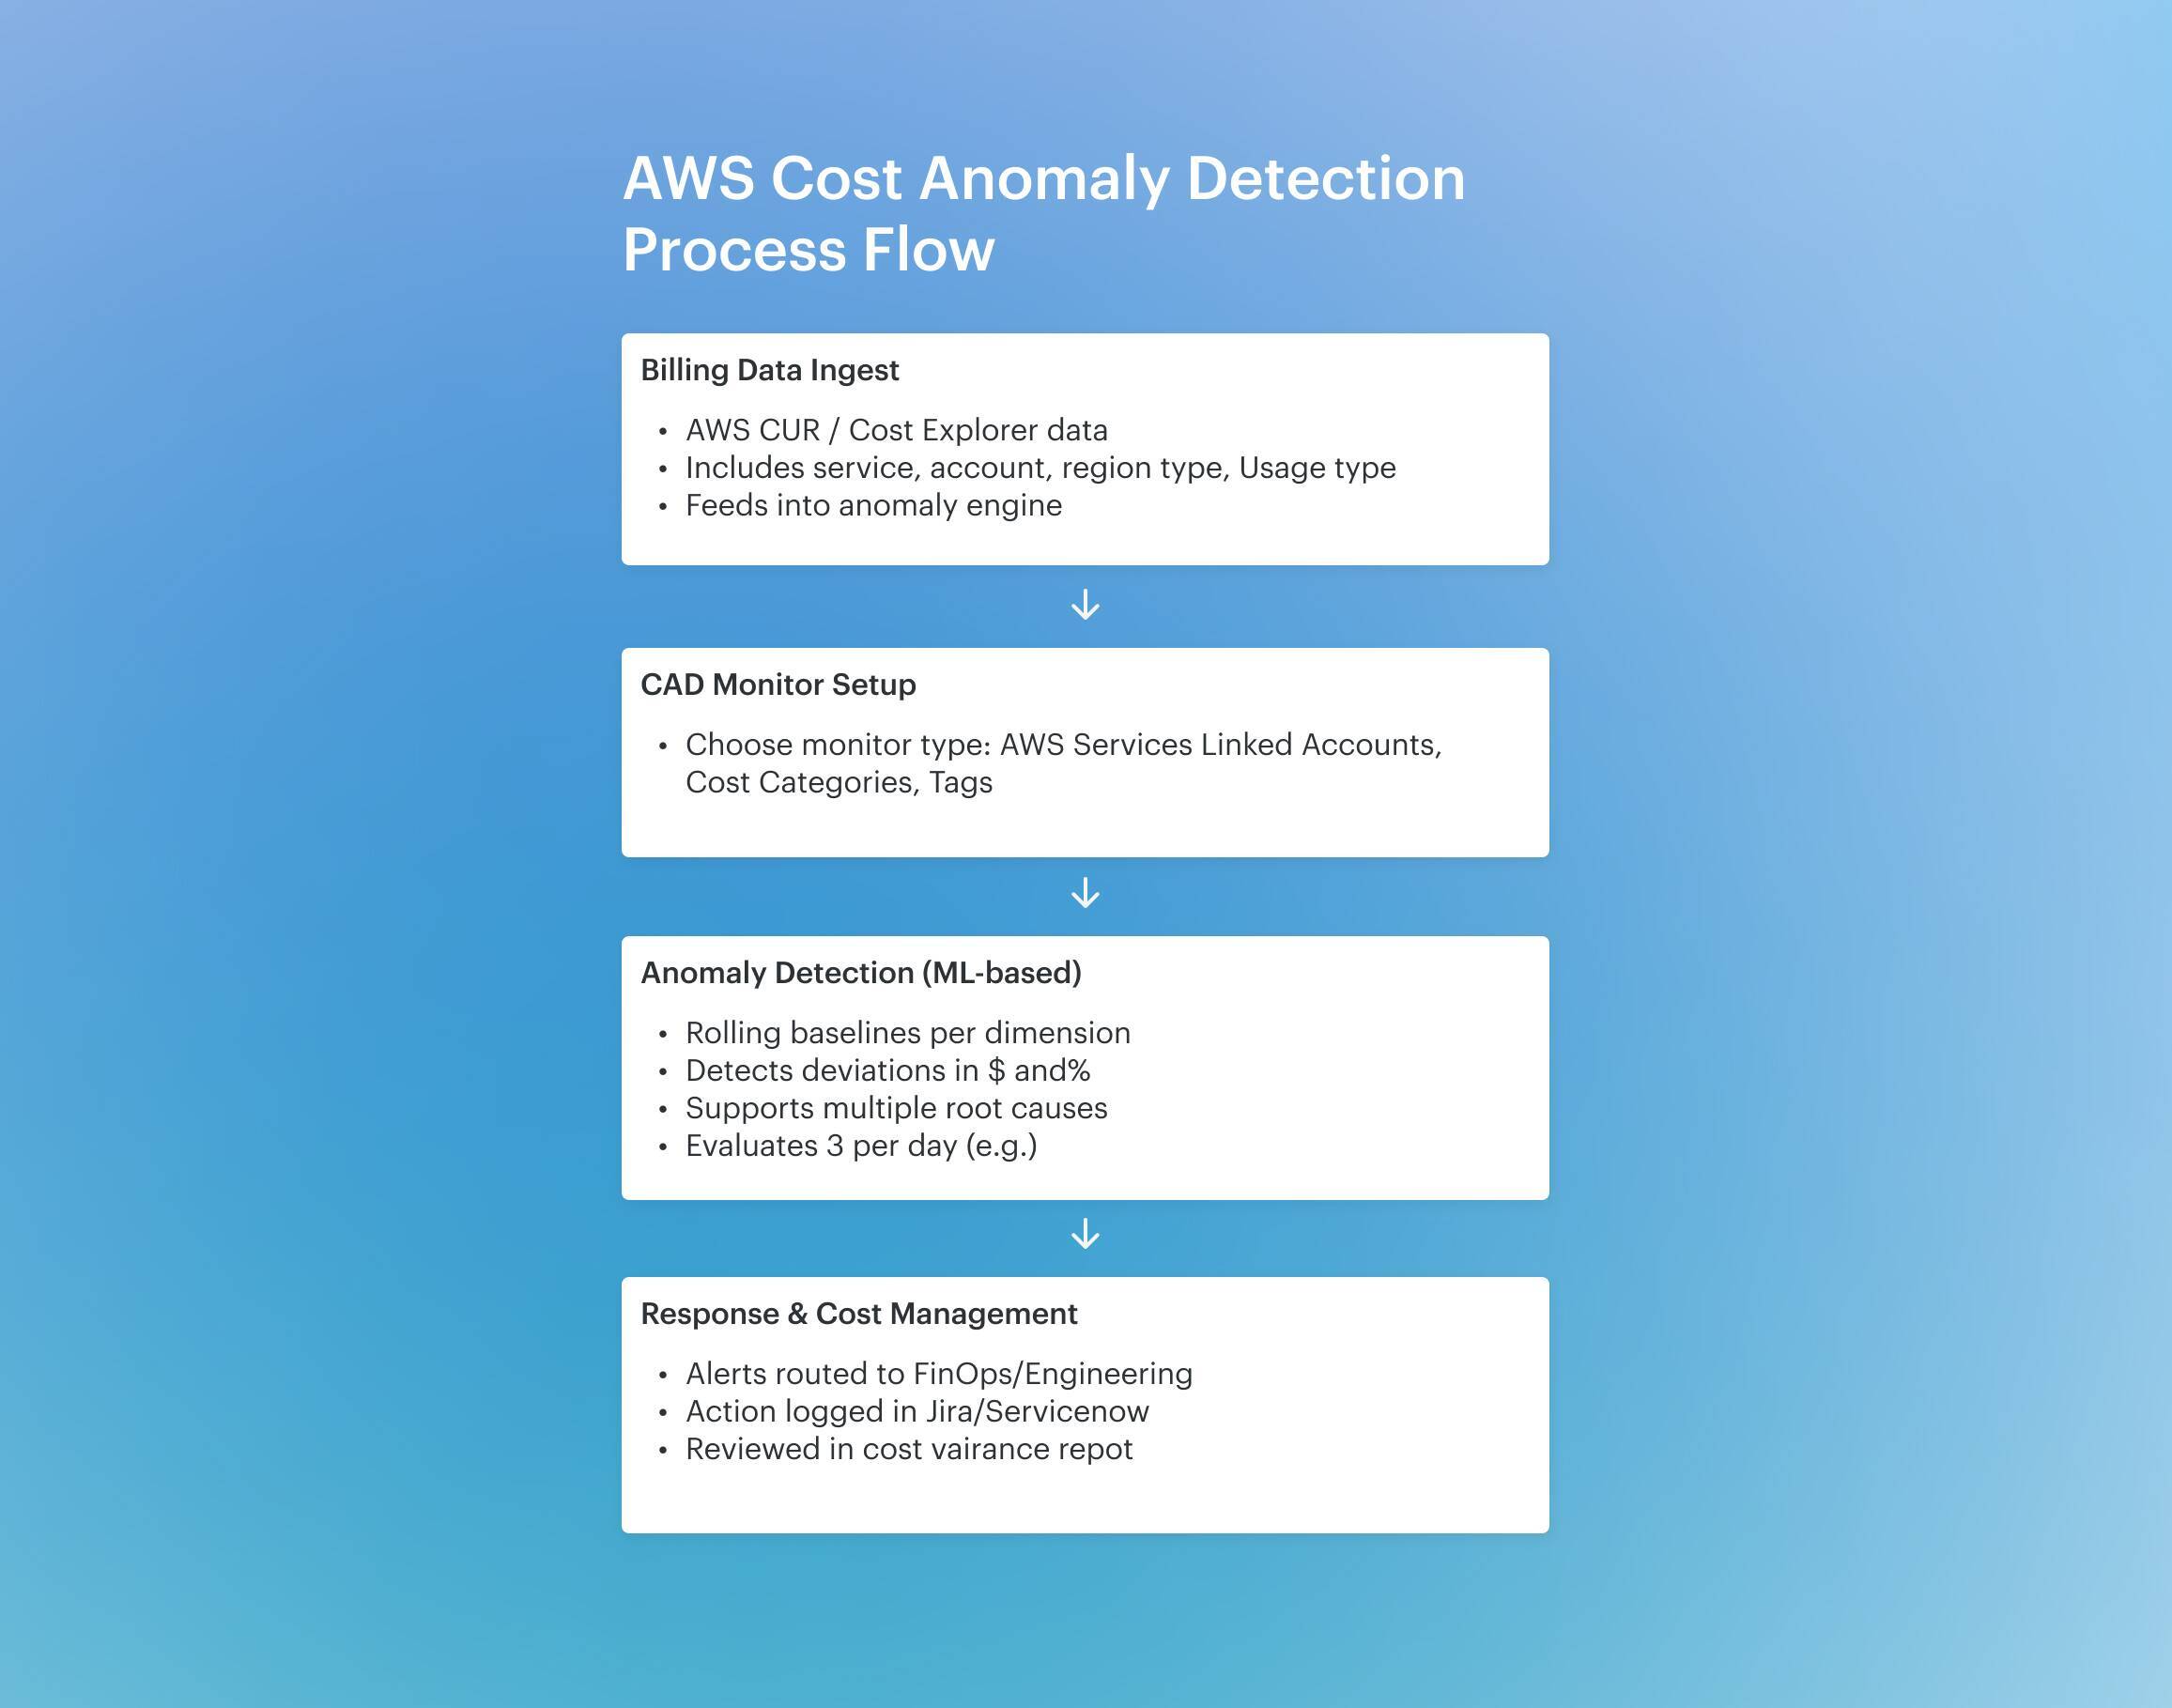
It ships through email/SNS and can fire EventBridge to automate first response (open Jira/ServiceNow via your webhook, cap an ASG, disable a leaky key). Cadence follows billing data refreshes; multiple passes per day refine the signal as more line items land.
How this differs from other platforms:
- Scope modeling: AWS uniquely lets you monitor by Cost Categories (your business groupings), not just tags/projects.
- Root-cause payload: Alerts carry a pre-ranked contributor stack tied to Cost Explorer drillbacks, so engineers land on the noisy dimension fast.
- Native automation path: EventBridge events off anomalies are first-class, making “detect → act” wiring straightforward.
- Where others go further: FinOps platforms add multi-cloud parity, Kubernetes/unit economics, owner enrichment (app/team/env), dedupe/feedback loops, and opinionated workflows. Use AWS CAD for precise AWS spend signals; layer a platform when you need cross-cloud context and routed accountability.
How it works in Google Cloud
Here’s what makes Google Cloud’s cost anomaly detection stand out: it’s zero-config, near-real-time, and fully embedded in your billing stack.
The engine runs hourly on your linked billing accounts and auto-generates baselines using project, service, SKU, and labels — no manual setup, no tagging prerequisites. When it detects a cost anomaly, it flags the deviation by actual vs. expected spending, ranks top contributors, and pushes alerts via email or Pub/Sub. You can send those straight into your pipeline — Slack, Jira, whatever.
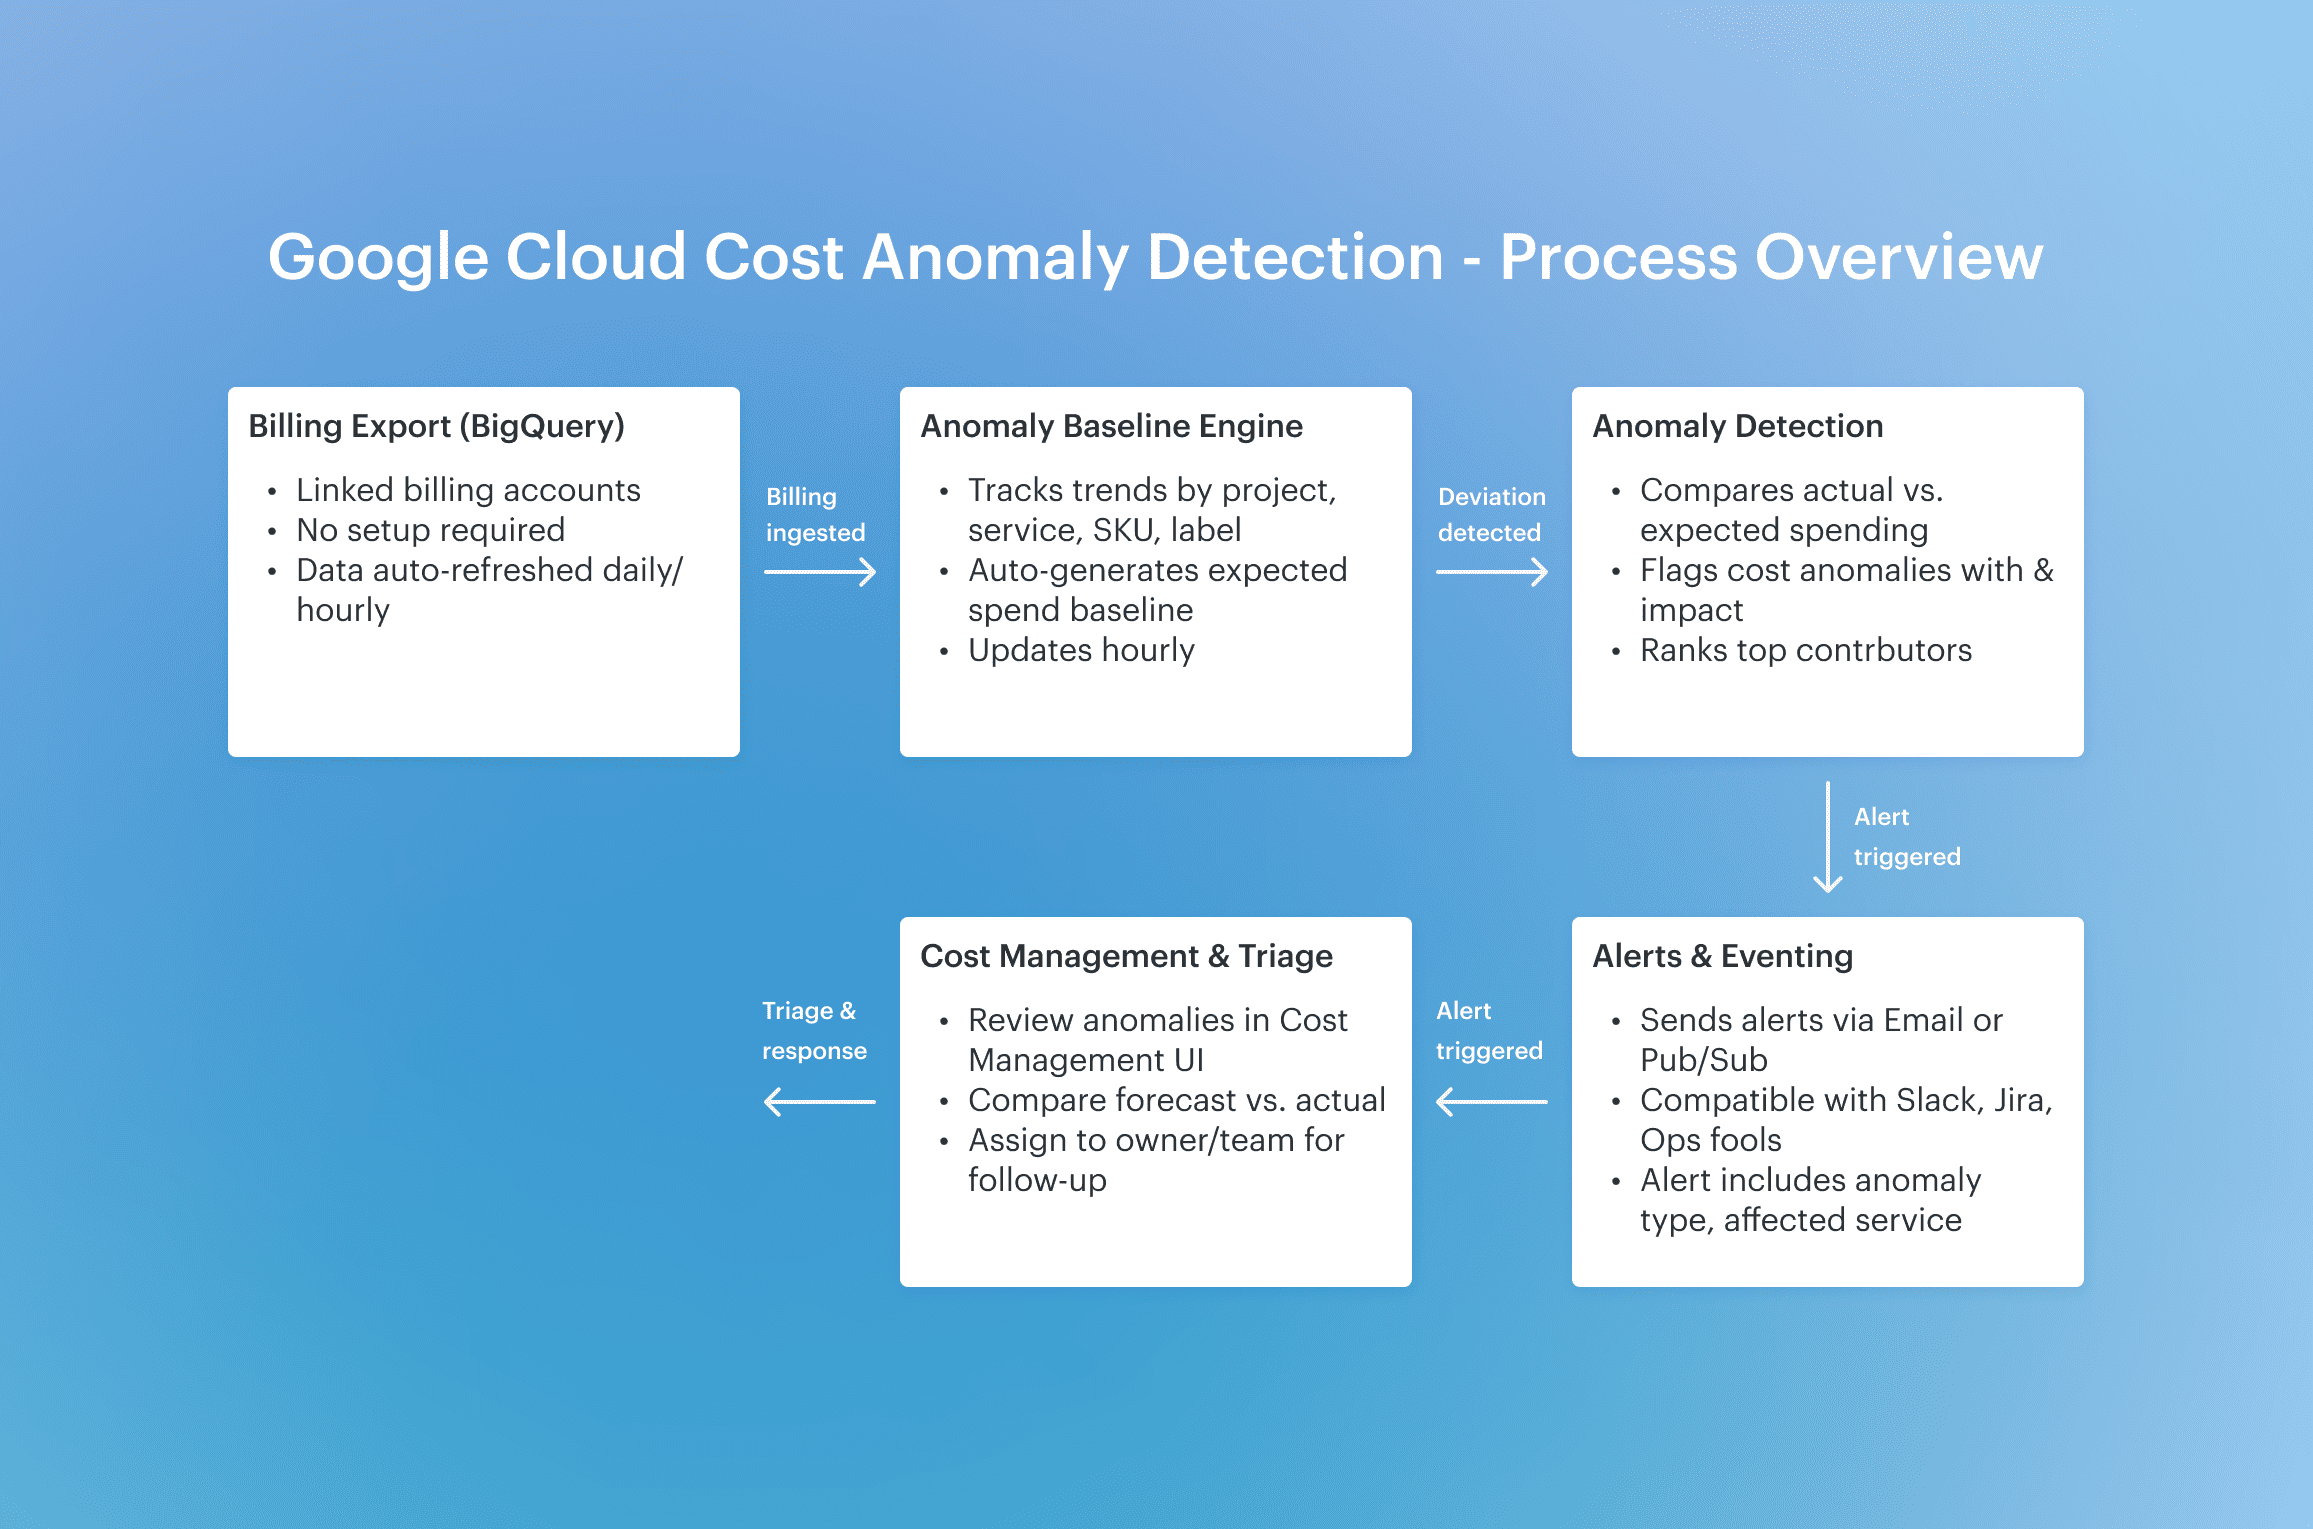
Now the real differentiator? Impact thresholds. You decide the minimum $ amount for what gets flagged. That keeps false positives low without hacking around custom suppression logic. Most platforms don't give you that kind of native threshold tuning.
Also — Google tracks anomalies at the SKU level, which is sharper than most other cloud vendors that group at a broader service or usage-type level.
How it works in Azure
When you use only one cloud, and it is Azure, you have the whole things baked right into Azure Cost Management, so you don’t need to set up a separate monitor or service. As soon as your cloud billing data flows in, it starts analyzing spending trends across subscriptions, resource groups, services, and even pricing models.
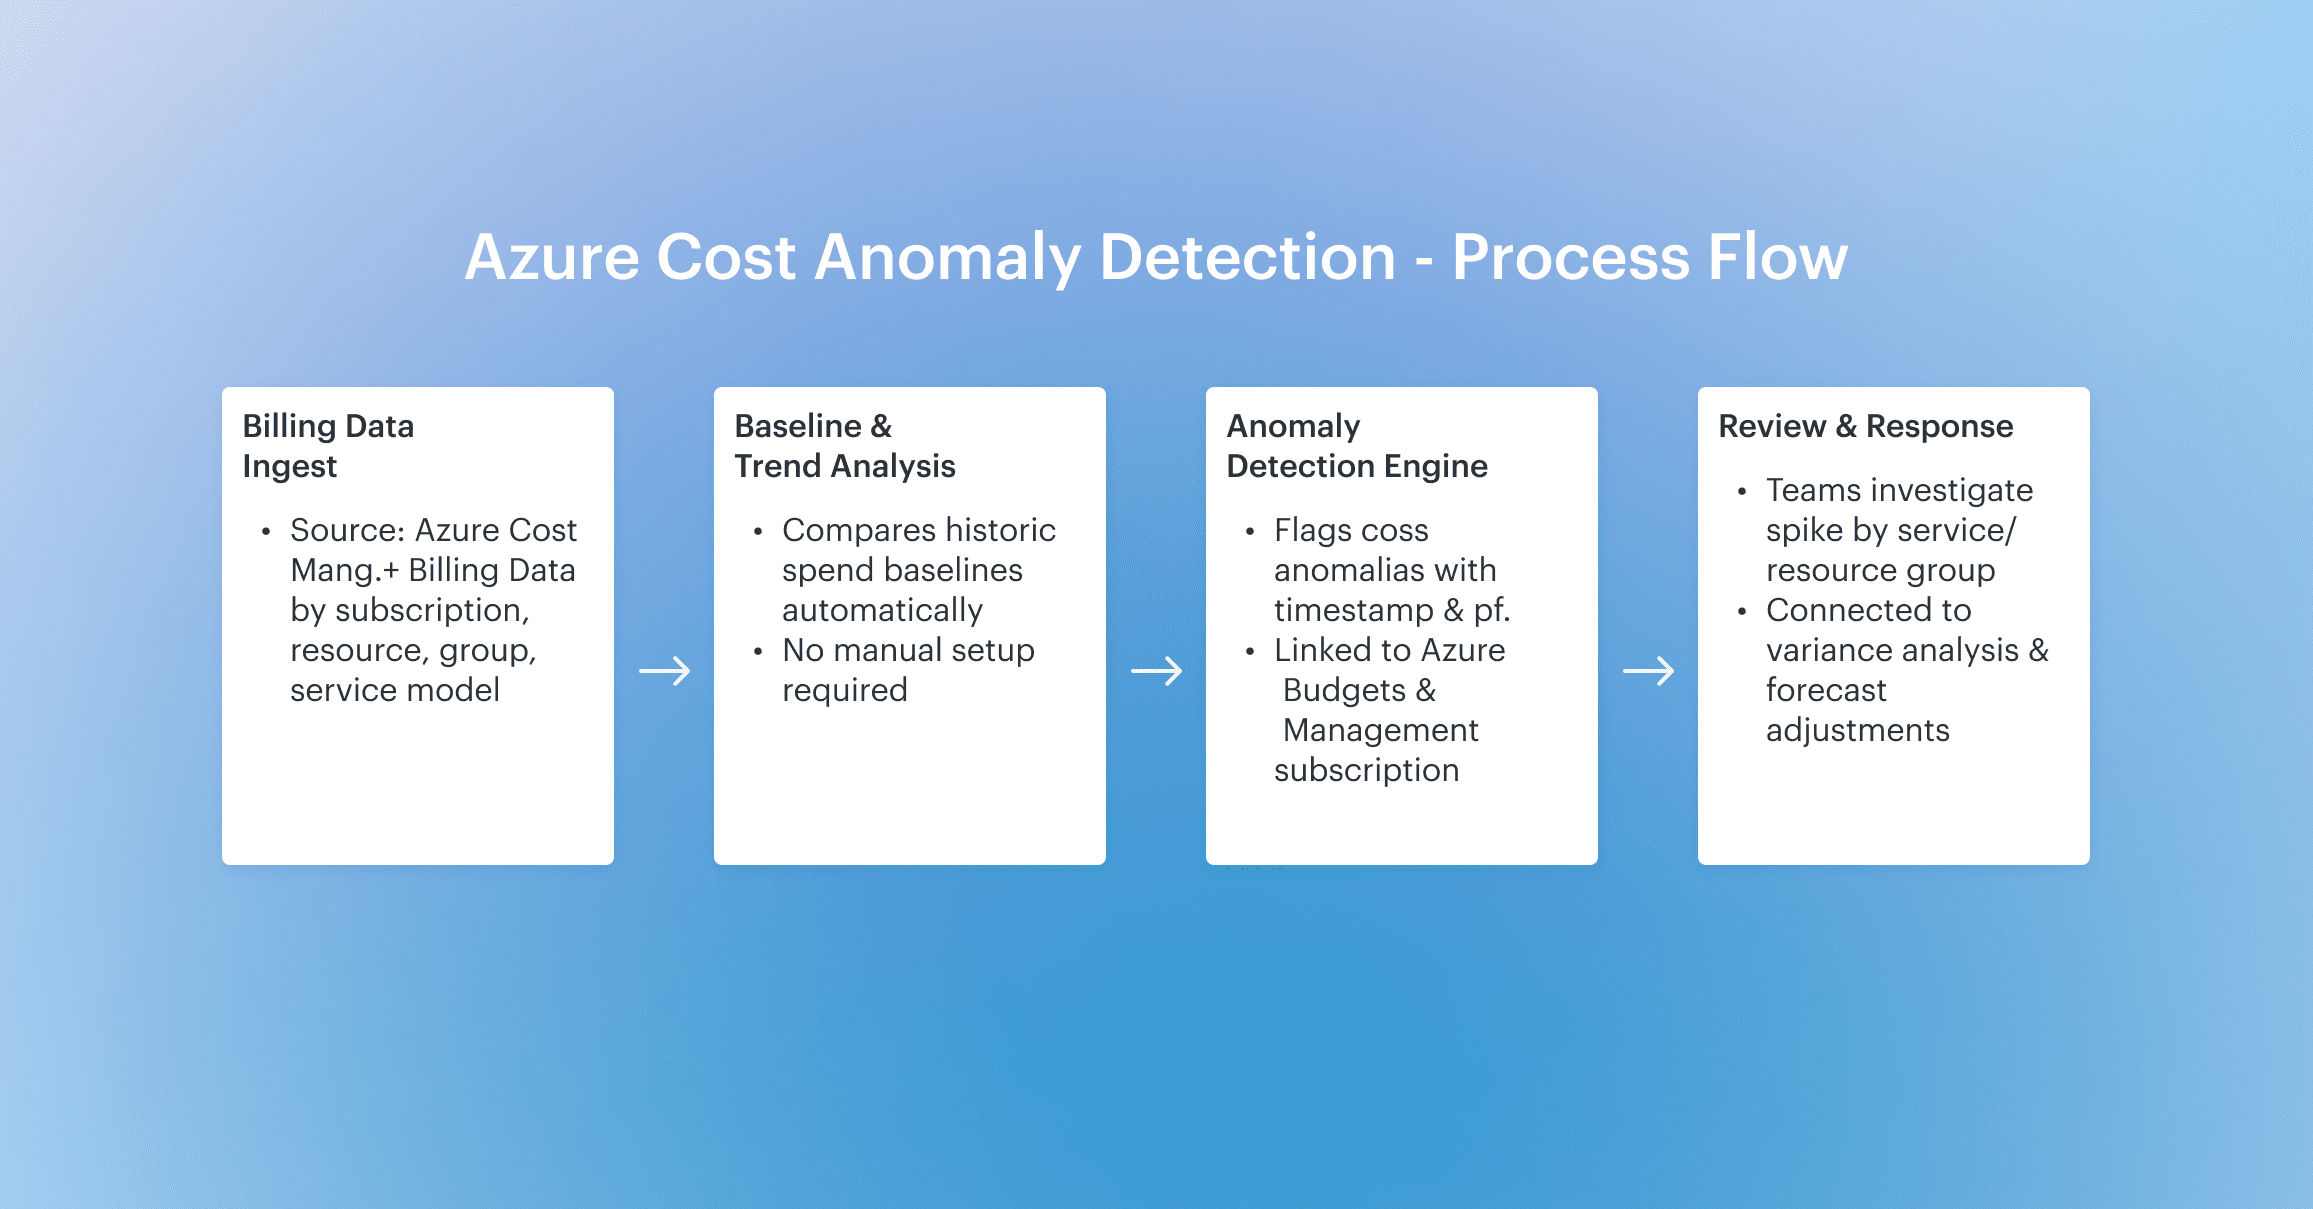
It looks for unusual spikes or drifts — those are your anomalies — then highlights them as a cost anomaly right inside the cost analysis view.
Here’s what’s unique: Azure groups each anomaly detection event by subscription, shows the forecast vs. actual, and links it directly to your alerts and budgets — so Finance, Engineering, and Product all work off the same delta.
It’s not just a heads-up; it’s part of the same place where you set guardrails, check historical costs, and manage allocations.
That integration makes it super efficient to resolve anomalies without jumping between tools.
But all it is different when you work with multiple cloud providers…
How things-party platforms like Cloudaware detect cost anomalies
Imagine you’re managing millions in cloud spend across AWS, Azure, and GCP — but visibility’s fragmented. Three clouds, three datasets, three versions of the truth. Anomalies slip through until Finance sends the invoice.
That’s where third-party FinOps platforms like Cloudaware kick in.
They pull raw billing data from AWS CUR (via Athena), Azure Cost Management exports (via EA API or CSV), and GCP Billing BigQuery datasets. Then comes the heavy lifting: all records are normalized into a common schema, enriched with metadata like cost category, commitment coverage, and virtual tags.
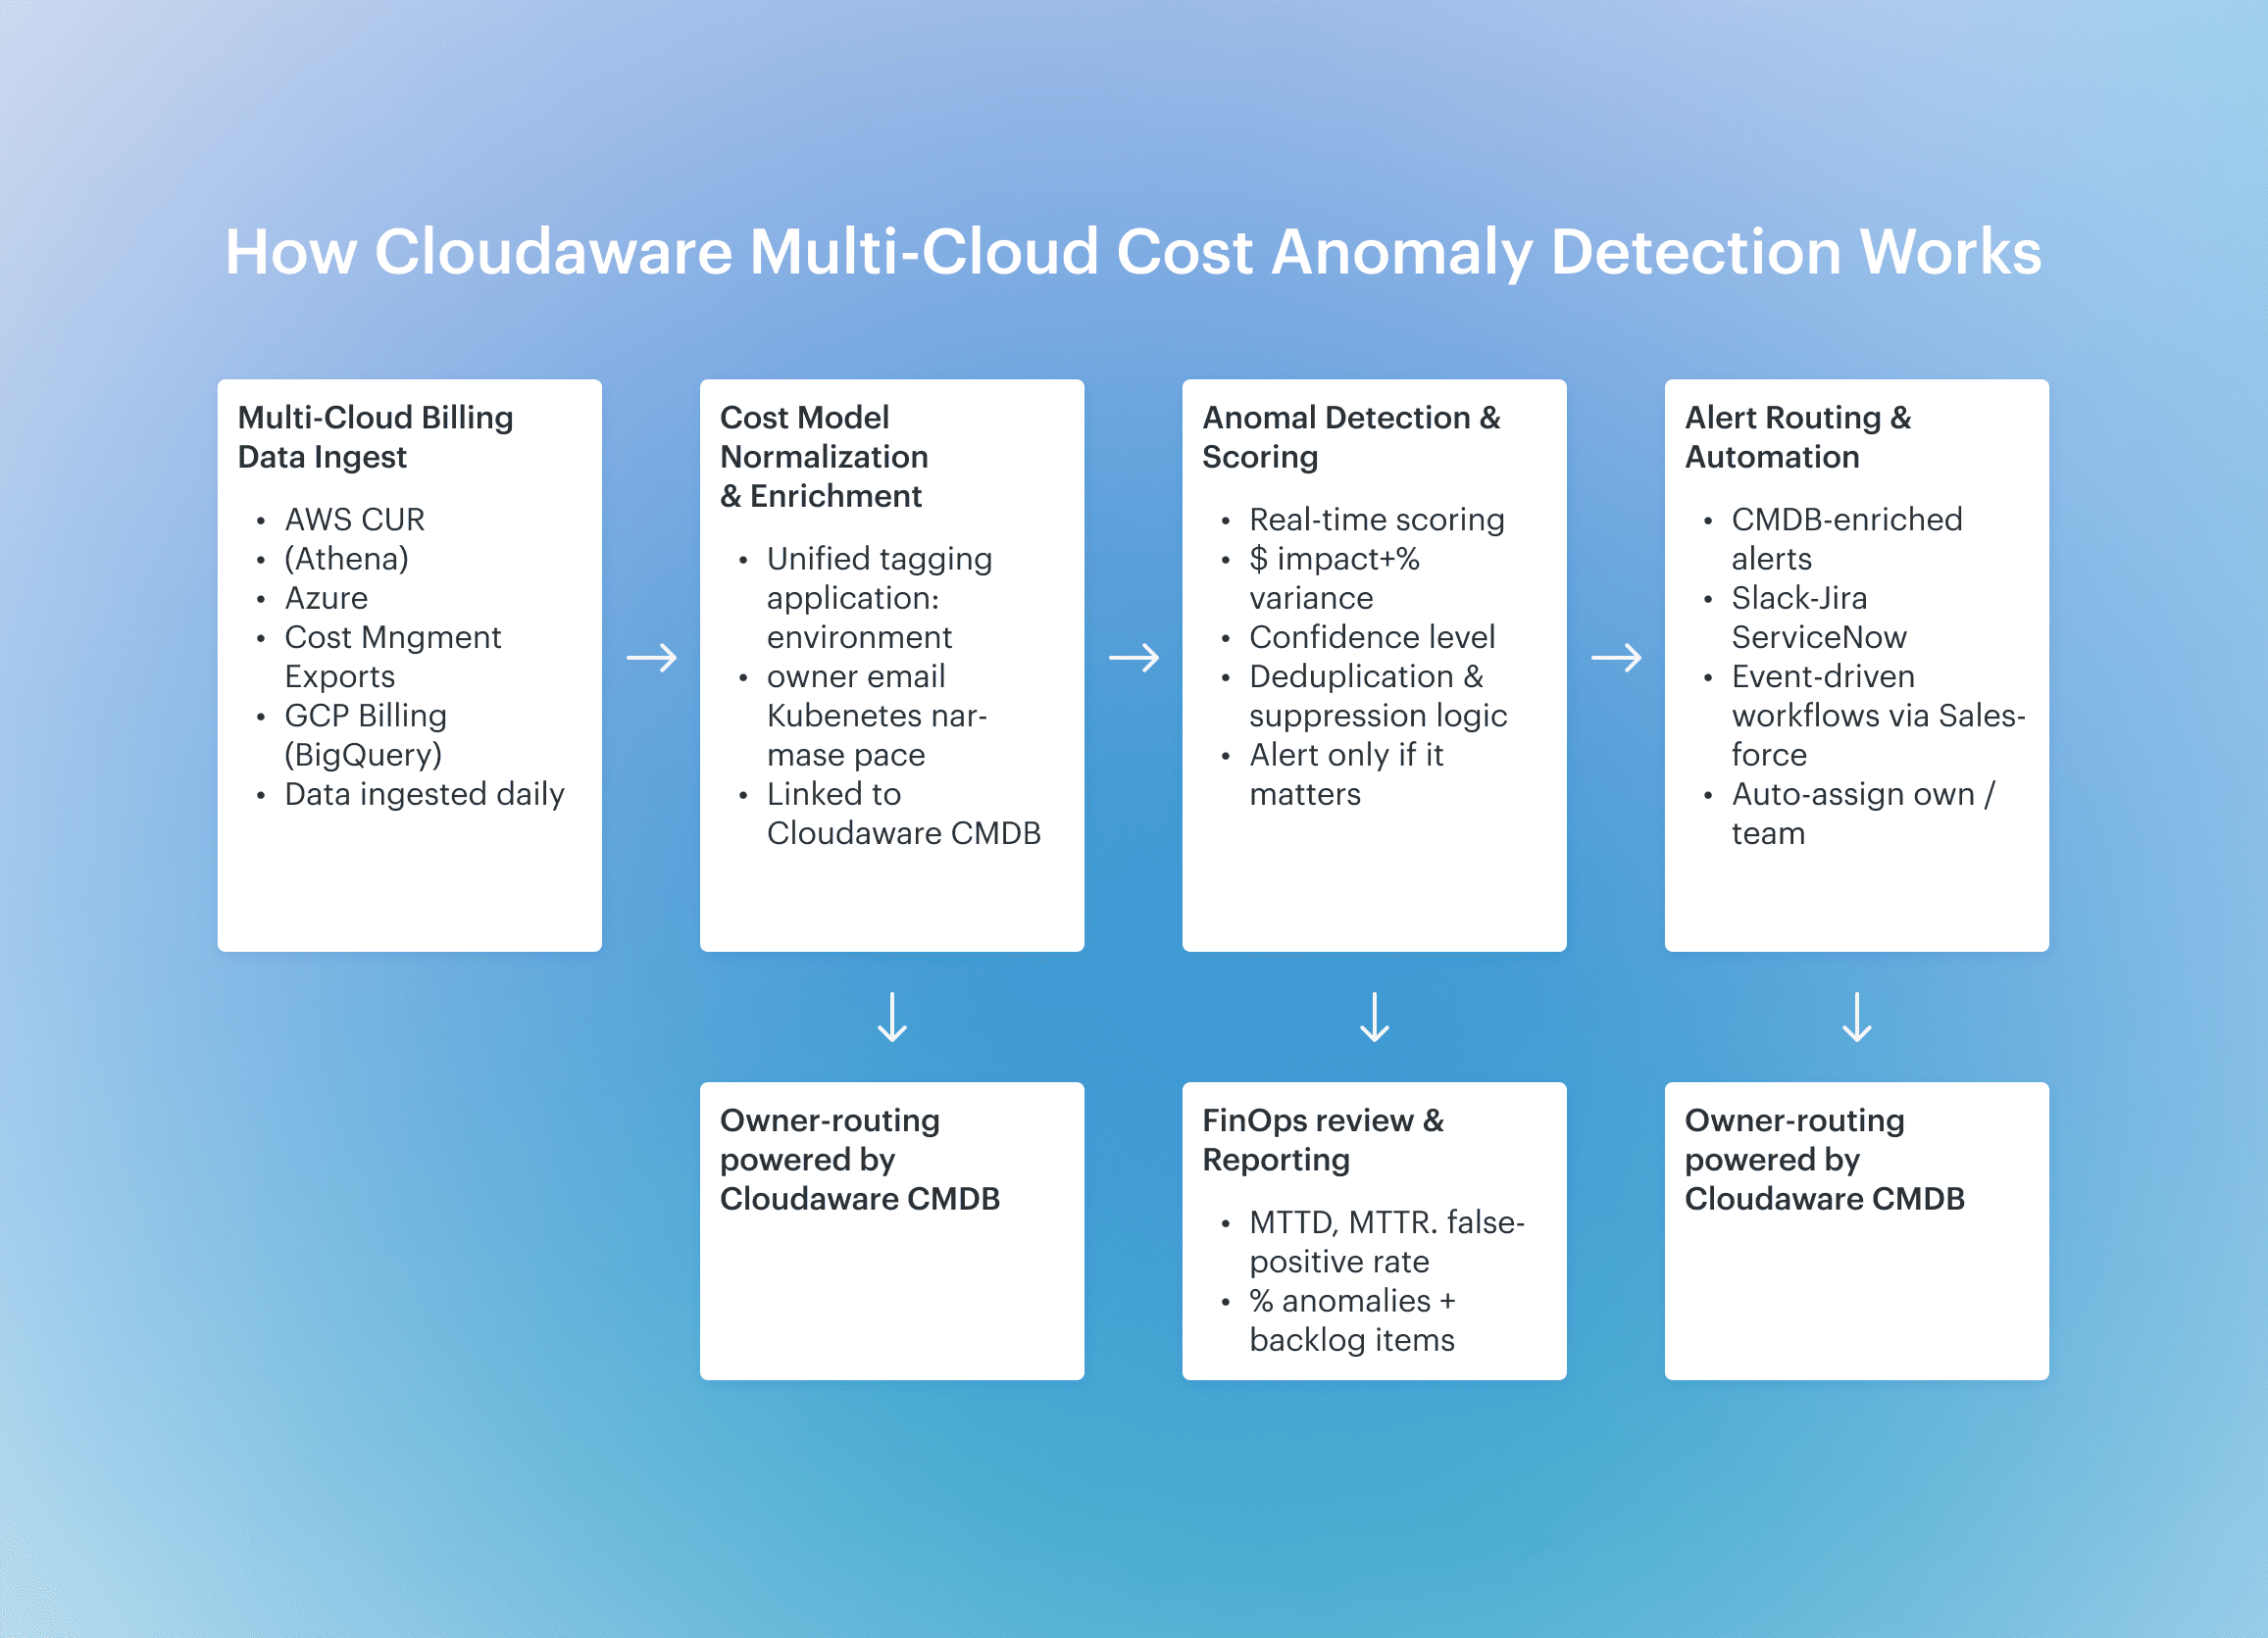
That’s how Cloudaware builds a cross-cloud cost graph — so EC2, Azure VM, and GKE workloads can be grouped under the same business app, BU, or product.
From there, the cost anomaly detection engine kicks in. It calculates dynamic rolling baselines per combination of dimensions: service, linked account, region, tag, Kubernetes namespace, and even custom fields like environment or cost_center. The engine scores new data with absolute $ impact and % variance and only surfaces anomalies that breach confidence thresholds you control.
Each cost anomaly is then resolved to ownership using the CMDB — mapping to application, environment, and owner_email. Alerts are enriched with RCA (top contributors by cost, region, tag), routed to Jira/ServiceNow via Salesforce-native workflows, and logged with required fields like reason code and action taken.
It’s not just “spike detected” — it’s detection → owner → task → fix, across clouds, in your workflow, with every ticket traceable to a real dollar amount.
There are many options to track cost anomalies, it is clear. But what’s the difference? This is exactly what we’ll discuss below👇
Compare existing cost anomaly detection solutions: features & pricing
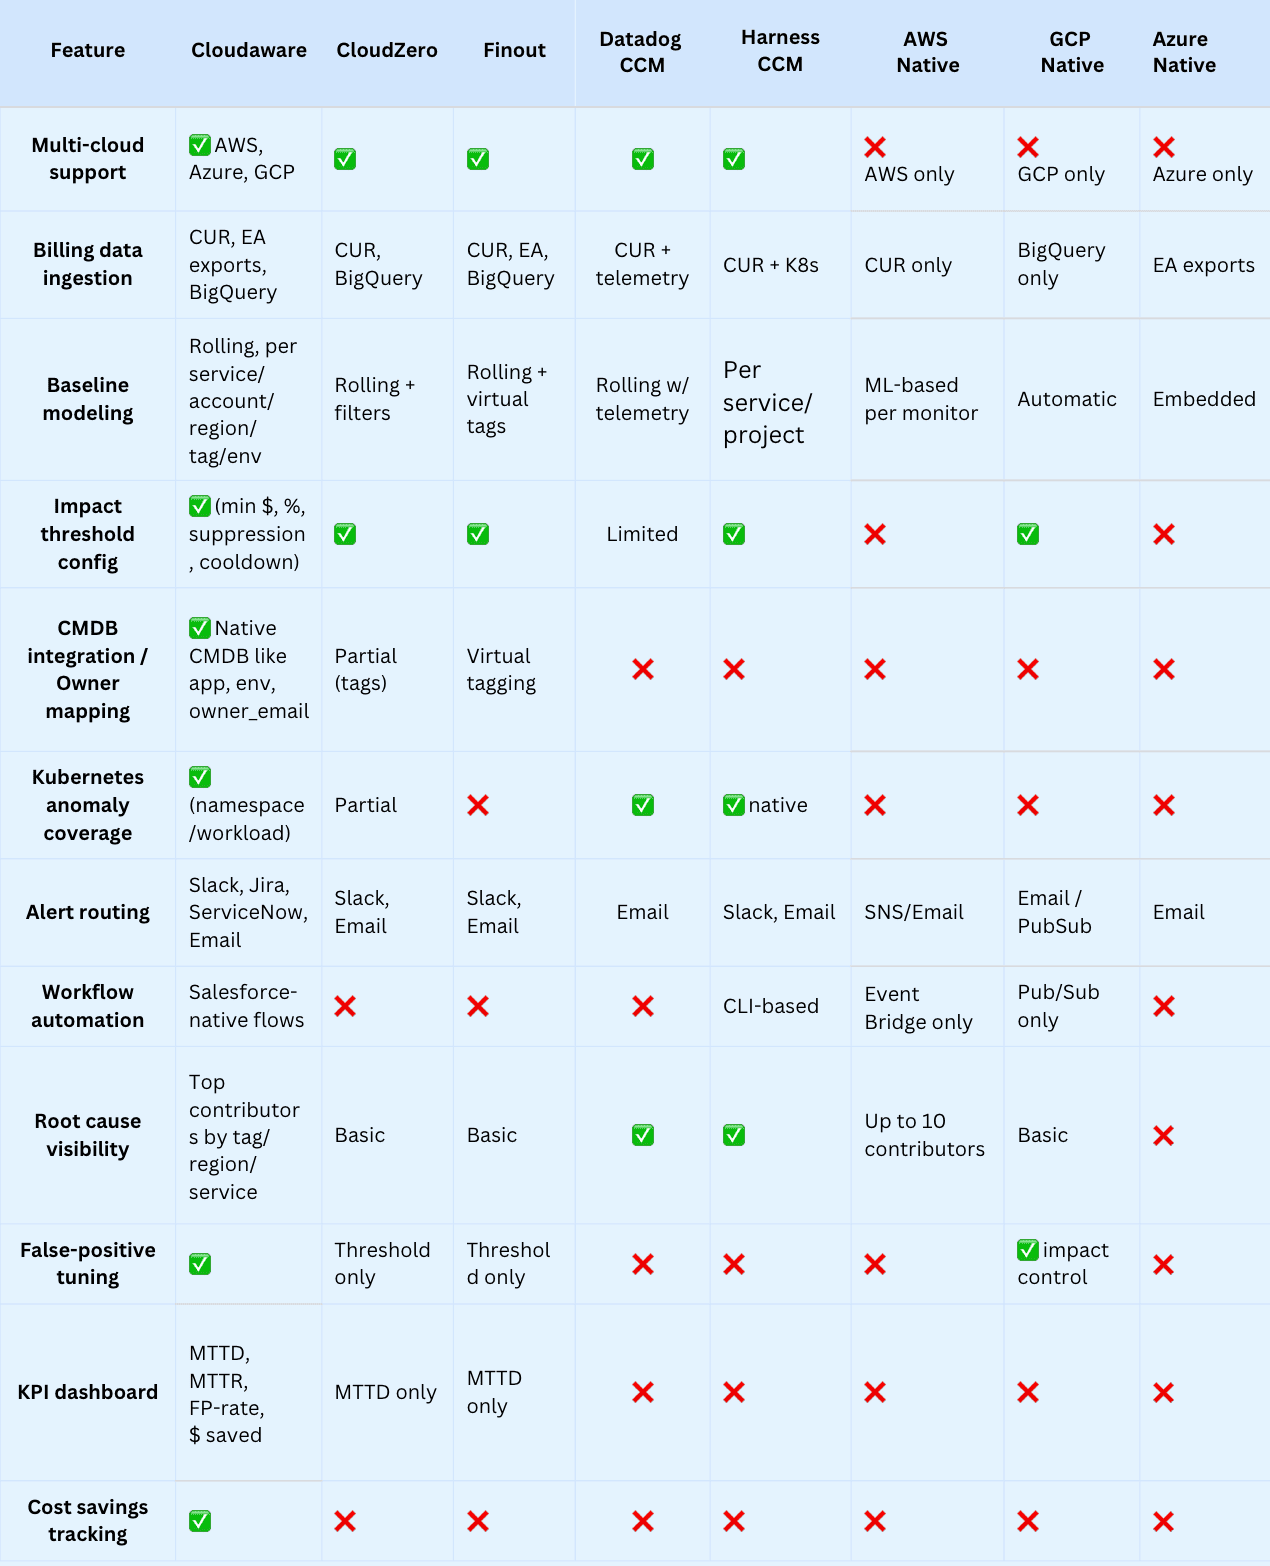
When companies run workloads across AWS, Azure, and GCP, native tools fall short fast. They show costs — but only in slices. That’s why multi-cloud teams turn to dedicated FinOps platforms. These tools pull raw billing data from all providers, normalize it, run cost anomaly detection, and route alerts to the right owners. One place. One language. One source of truth.
But with so many tools out there, how do you choose the right one?
Here’s what to look for in a cost anomaly detection solution:
- Multi-cloud ingestion. Must support AWS CUR, Azure exports, and GCP BigQuery. The cost view should be unified, not stitched together manually.
- Baseline + behavior modeling. A good monitor builds rolling baselines for each service, account, tag, or region. It tracks expected spending and flags real anomalies.
- Threshold logic. You control when detection kicks in: by $ impact, % variance, or recurrence. No noise.
- Ownership mapping. Every cost anomaly should resolve to an app, environment, and team. That’s the only way to route alerts that get resolved.
- Workflows, not pings. Native integration with tools like Jira or ServiceNow. An anomaly detection platform should turn spikes into tracked work.
- Noise control. Suppress routine changes, apply cool-down windows, and tune out false positives.
- KPIs that matter. A mature tool tracks MTTD, MTTR, FP-rate, and $ saved — so cost management becomes measurable.
Next, let’s compare the most popular cost management platforms on the market — and see how they deliver on these anomaly detection must-haves👇
Pricing comparison
| Platform | Pricing Model Details | Min Price / Structure | Trial / Free Tier |
|---|---|---|---|
| Cloudaware | CMDB base, plus ~20% of CMDB pricing added for FinOps capabilities. CMDB is priced by number of servers (starting at 50 servers, 1 user). Example: 100 servers ≈ $400/month base. FinOps add-on ≈ +20%. | ~ $480/month for 100-server setup | 30‑day free trial |
| CloudZero | Usage-based: tied to AWS spend. Charges per $1,000 of AWS spend. Also has custom enterprise structure. | Variable — starts based on tiered $ per $1,000 spend | “See ROI in under 14 days,” demo required |
| Finout | SaaS subscription covering FinOps + anomaly detection; pricing volume‑based (Cloud spend tier). | No published fixed minimum; contact for quote | Pricing page does not mention trial |
| Datadog CCM | Add-on to Datadog platform; pricing based on host count + modules. Anomaly detection included in higher tiers. | Infrastructure Pro: $15/host/mo; enterprisey Tier adds features | Free trial available via Datadog standard signup |
| Harness CCM | Free Forever plan if cloud spend < $250K/yr; else requires Enterprise license. Anomaly detection included. | $0 if < $250K spend; Enterprise pricing varies | Free Forever plan available ﹘ no trial needed |
Whether you have already chosen the tool or thinking about it, here are the process all cost anomaly detection tools users do to make it work 👇
How to implement cloud cost anomaly detection
Here is a step-by-step instruction companies follow for implementing cost anomaly detection for their clouds in Cloudaware platform.
1. Connect your clouds
Cloudaware makes this super quick. You integrate AWS, Azure, Alibaba, Oracle, and GCP right into the platform using your existing billing export paths. It honestly takes just a few minutes per cloud. No agents. No scripts. Just connect, authenticate, and go.
Once that’s done, the platform starts pulling data in real or near-real time, straight from your cloud management layer. It grabs everything — usage, pricing, tags — so you’re not waiting days to see what’s going on.
Here’s the key part: when enabling anomaly detection, you’ll want to double-check your billing data settings. Make sure you’ve got hourly or monthly granularity enabled, and that resource IDs are included. That gives the engine full visibility to track patterns, find anomalies, and map every line item to the right team or service.
Clean data means better cost management, faster detection, and fewer questions like “where did this spike come from?” later.
2. Let the system normalize & enrich the cost model
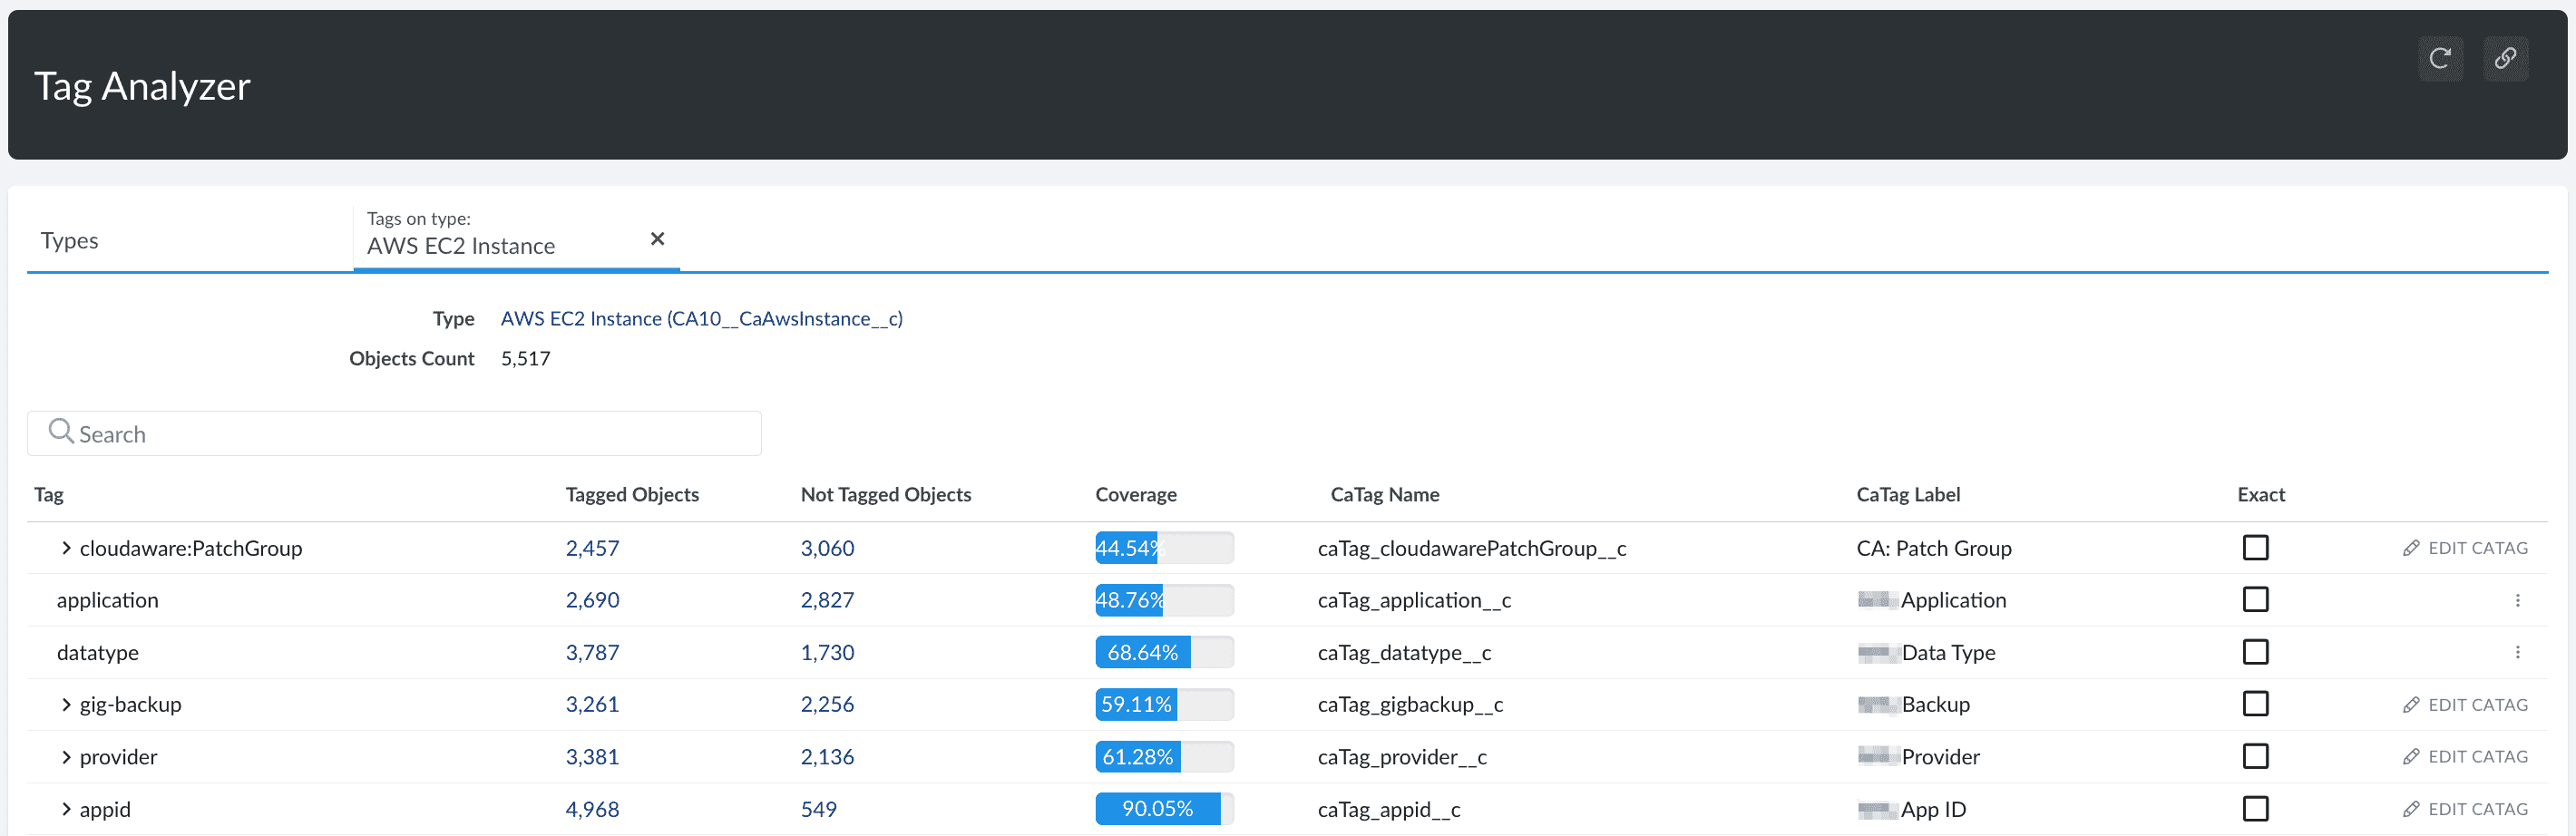
Okay, your data’s flowing in — now Cloudaware’s Cost Engine takes over. It automatically normalizes spend data across AWS, Azure, GCP, Oracle, and Alibaba. That means no more second-guessing which tag means what.
Messy native tags? It cleans them. Missing context? It fills the gaps. Cloudaware even creates virtual tags when the originals are inconsistent, using rules from the CMDB. Every cost line is enriched with application, environment, business_unit, and owner_email — so later, when anomalies show up, you’ll know exactly who owns what.
It doesn’t stop at compute, either. Kubernetes costs get pulled in by namespace, workload, and container, and tied to CMDB entries too. This way, anomaly detection doesn’t miss what’s running inside clusters.
All of this happens automatically — visible in your logs, tracked in dashboards, and ready for audits. That’s how Cloudaware turns raw cost data into a clean, actionable management layer that your whole team can trust.
3. Enable budget & alerting policies
Once your cost data is normalized and enriched, the next move is setting clear rules around when Cloudaware should detect and raise a cost anomaly — and that starts with budgets and alerting policies.
First, define your impact thresholds. These are the boundaries that tell Cloudaware: “Only flag this if it really matters.” For example, you might want to be alerted if daily spending exceeds $1,000 in a single AWS linked account or if costs jump more than 25% from the usual baseline on a specific tag or service. You can apply thresholds globally, or tailor them per cloud, region, business unit, or environment.
Next, add suppression windows. These are periods you expect high spend — like release nights, scale tests, or billing cycle close outs — so the system won’t raise false positives. Just define the window and the scope, and Cloudaware temporarily mutes the noise.
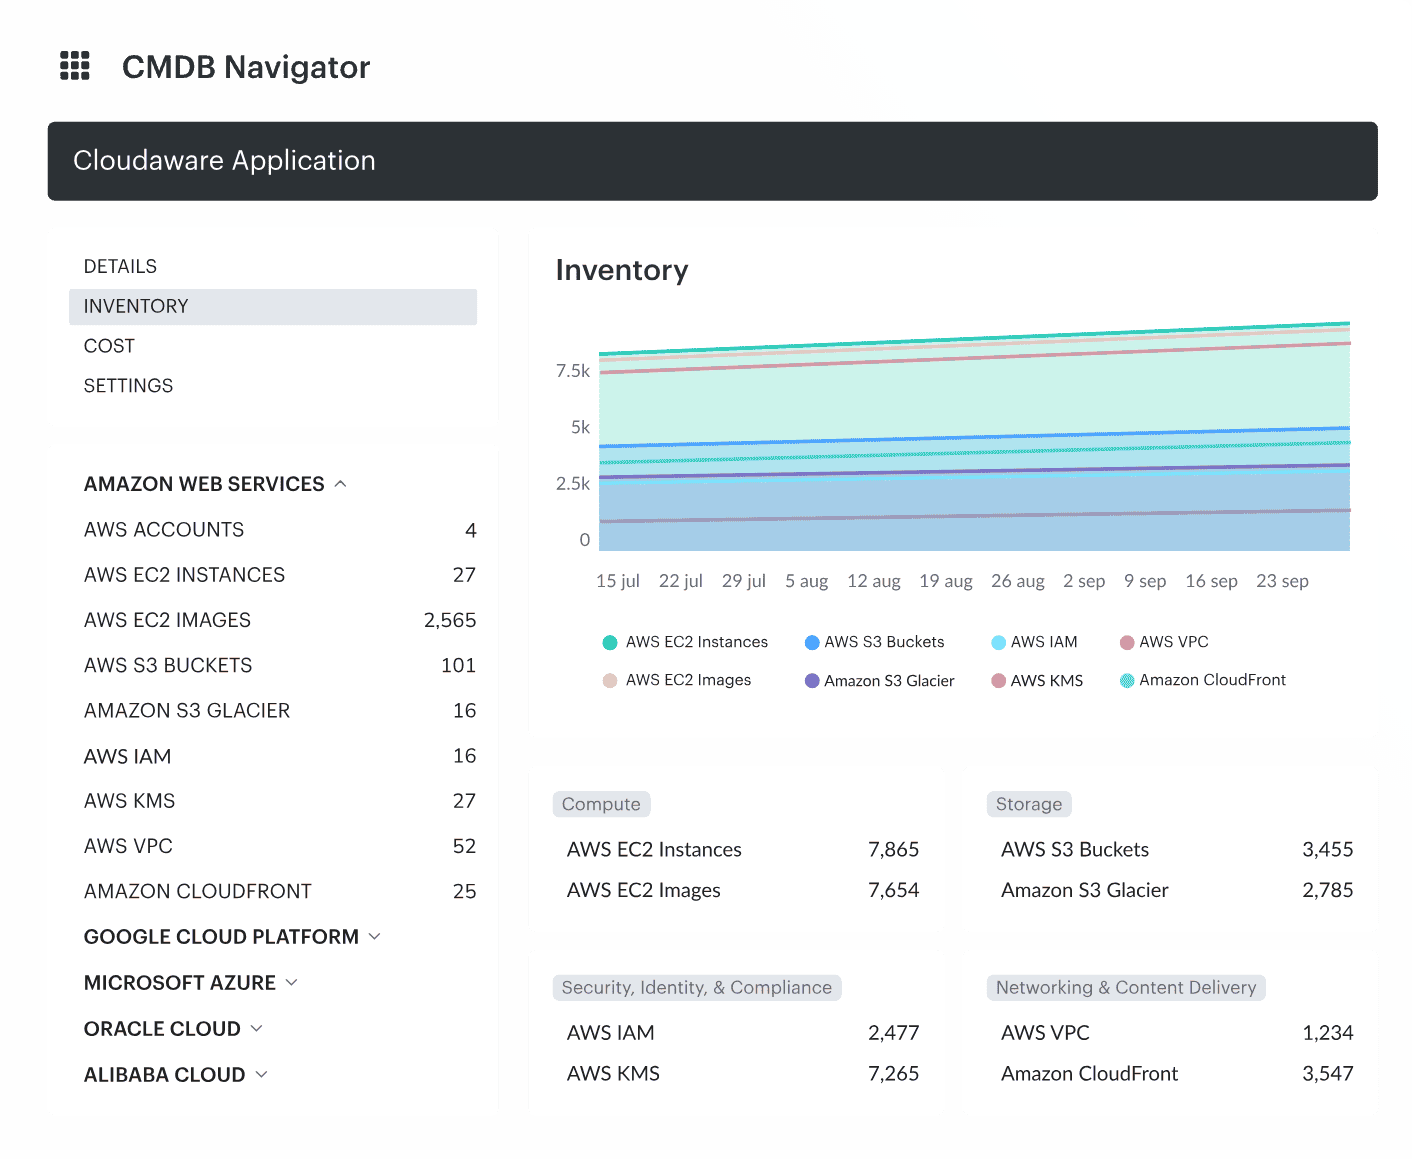
4. Analyze Cost Anomalies in Dashboards and Reports
Once cost anomalies start flowing in, Cloudaware gives you full visibility through dynamic, customizable dashboards. You’re not stuck with static charts — you can build views using any logic from the Cloudaware CMDB, including tags, virtual tags, applications, owners, environments, or business units.
Want to review all high-impact anomalies from dev accounts tagged env:prod last month? Easy. Filter by cloud, tag, service, and impacted spend — then drill into each event with RCA details and dollar impact.
Dashboards include metrics like:
- Total anomalies detected. It tells you how many cost anomalies the system flagged in a given time frame — usually weekly or monthly.
- $ flagged vs. $ resolved. Dollars flagged = the total cost impact of all detected anomalies (based on baseline vs. actual spend). Dollars resolved = the portion of that cost where action was taken — like rightsizing, shutdowns, or reclassifying legitimate spend. The gap between the two helps you evaluate FinOps maturity. Big delta? You’re finding issues but not fixing them fast enough.
- % of anomalies converted to action. It shows what percentage of anomalies were turned into tasks — like Jira tickets, ServiceNow incidents, or documented exceptions.
- Owner or BU-level breakdowns. It slices anomaly volume and dollars by application, business unit, or owner_email — based on CMDB mappings. Thus, you can identify which teams consistently trigger anomalies (and which ones resolve them fast), so you can target training or adjust policies.
- MTTD (Mean Time to Detect). How long it takes the system to detect a cost anomaly after the underlying spend occurs. Lower is better. Under 60 minutes is a strong target.
- MTTR (Mean Time to Resolve). The average time from anomaly detection to confirmed resolution (rollback, scale-down, or documented exception). Helps you measure how quickly teams react and fix.
- False Positive Rate. The percentage of alerts flagged as anomalies that turn out to be expected or non-actionable. Ideally below 10%, this keeps trust in the signal high.
- % Anomalies Converted to Backlog Items. How many anomalies were turned into trackable tasks in Jira, ServiceNow, etc. — proof that detection drives real action.
- Avoided Cost from Actions Taken. The estimated savings from resolving the anomaly (e.g., killing idle GPUs, fixing a config, capping autoscaling). This is your headline metric for ROI.
You can export reports to PDF or Excel for finance reviews, leadership decks, or audits. Every anomaly is traceable, attributed, and measurable — so cost management isn’t just a spreadsheet anymore. It’s a visible process your whole team can align on.
And if you're not sure how to structure your dashboards? Just ping our FinOps experts — we’ll help you set it up, no extra cost.
5. Map alerts to owners via CMDB
If you don’t have time to check dashboards every day, you can automate the whole thing with alerts that go straight to the right owner — automatically.
Here’s how it works in Cloudaware:
When a cost anomaly is detected, it’s enriched using the metadata from your CMDB. Each anomaly is linked to contextual fields like application, environment, service, owner_email, business_unit, and even Slack usernames — so the platform knows who owns what.
From there, you can define Force.com workflows to send notifications via:
- Slack (direct to person or channel)
- Email (with full anomaly context)
- Jira (auto-create tickets with severity and RCA)
- ServiceNow or Salesforce flows (native integration)
You decide the policy logic — threshold, frequency, filters — and Cloudaware handles the routing. No manual triage. No shared inboxes. Just actionable, cost-aware alerts landing exactly where they should. Every time.