


Ever feel like you’ve got your hands full juggling billing dashboards, commitment discounts, and a mountain of usage data — only to still miss a cost spike in some obscure dev account from three quarters ago? Yeah, same here. One moment you’re updating your RI/SP strategy for AWS, the next you’re untangling Azure subscription scopes while trying to justify a forecast that doesn’t yet account for that surprise GCP expansion. Cloud cost management isn’t just complex — it’s a moving target wearing camouflage.
But here’s the good news. I didn’t write this article alone. These FinOps best practices come straight from my teammates — seasoned FinOps and ITAM professionals who’ve spent over a decade helping multi-cloud enterprises track, allocate, and optimize their spend across thousands of accounts and hybrid environments.
What you’ll find inside?
✅ Tagging and visibility playbooks
✅ Commitment lifecycle tuning
✅ Rightsizing tactics
✅ Automation triggers
✅ Forecasting frameworks
Let’s make cloud costs make sense.
Create tag-driven financial management visibility from day one

You ever open a cloud billing report and see thousands of dollars filed under “No Tag”? That’s not a line item — it’s a blind spot. One that makes forecasting useless, chargebacks impossible, and cost optimization feel like you’re chasing shadows. We had a case where a production GKE cluster was scaling aggressively, chewing through GPUs and persistent volumes — but without a single tag. Finance saw the spend. Nobody could tell them why.
This is one of those FinOps best practices that sounds simple but cuts deep: your cost visibility lives and dies by your tags.
At Cloudaware, we bake tagging into everything. From day one, we define a minimum viable tag set:
- 'cost_center' – links usage to budget holders
- 'application' – maps to CIs and app portfolios
- 'environment' – separates prod from test/noise
- owner_email – assigns responsibility
- lifecycle_status – flags workloads that shouldn't receive RI/SP coverage
Every new resource is checked via the Compliance Engine. If it’s missing a required tag — or worse, has drifted from its original configuration — we raise a Tagging Violation. That gets pushed to the owning team through Jira or ServiceNow. You don’t need to chase them down in Slack anymore.
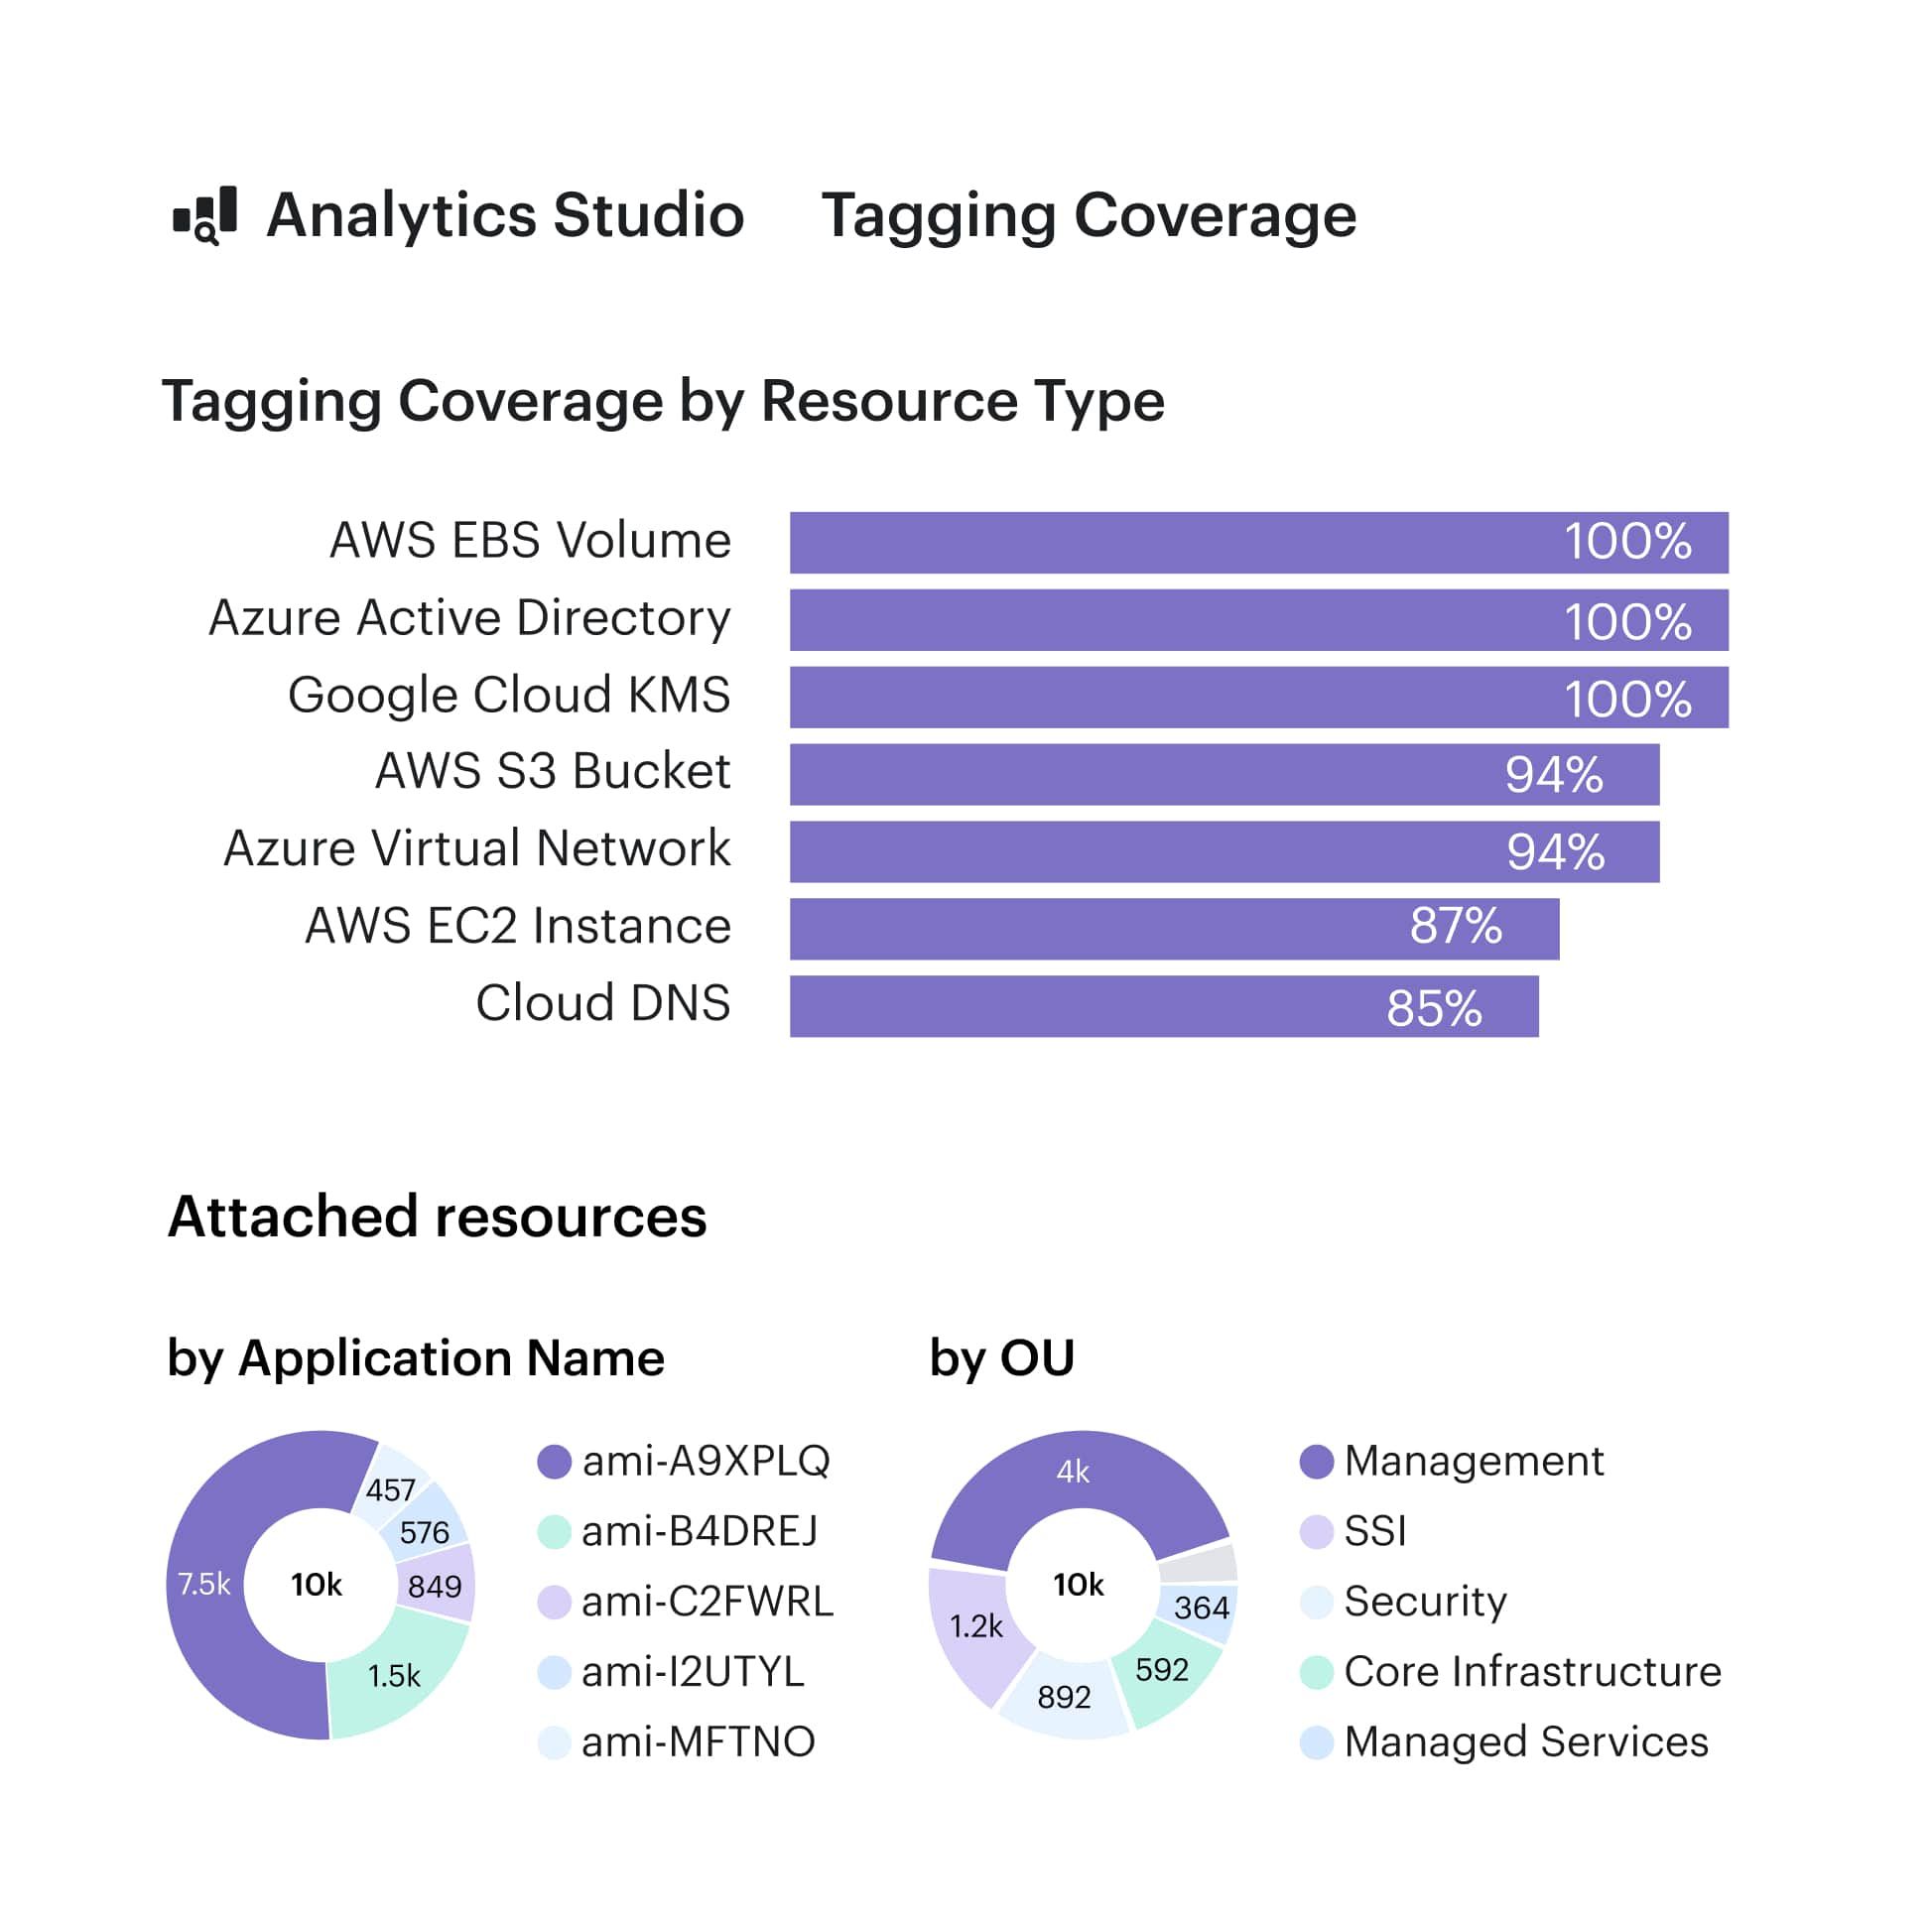
Tagging coverage dashboard in Cloudaware. Schedule demo to see it live.
Even better? Our tag completeness dashboards slice this by cloud, team, or region. That means if your Azure Kubernetes costs are out of control, you can immediately check whether it’s a tagging failure or a real scaling problem.
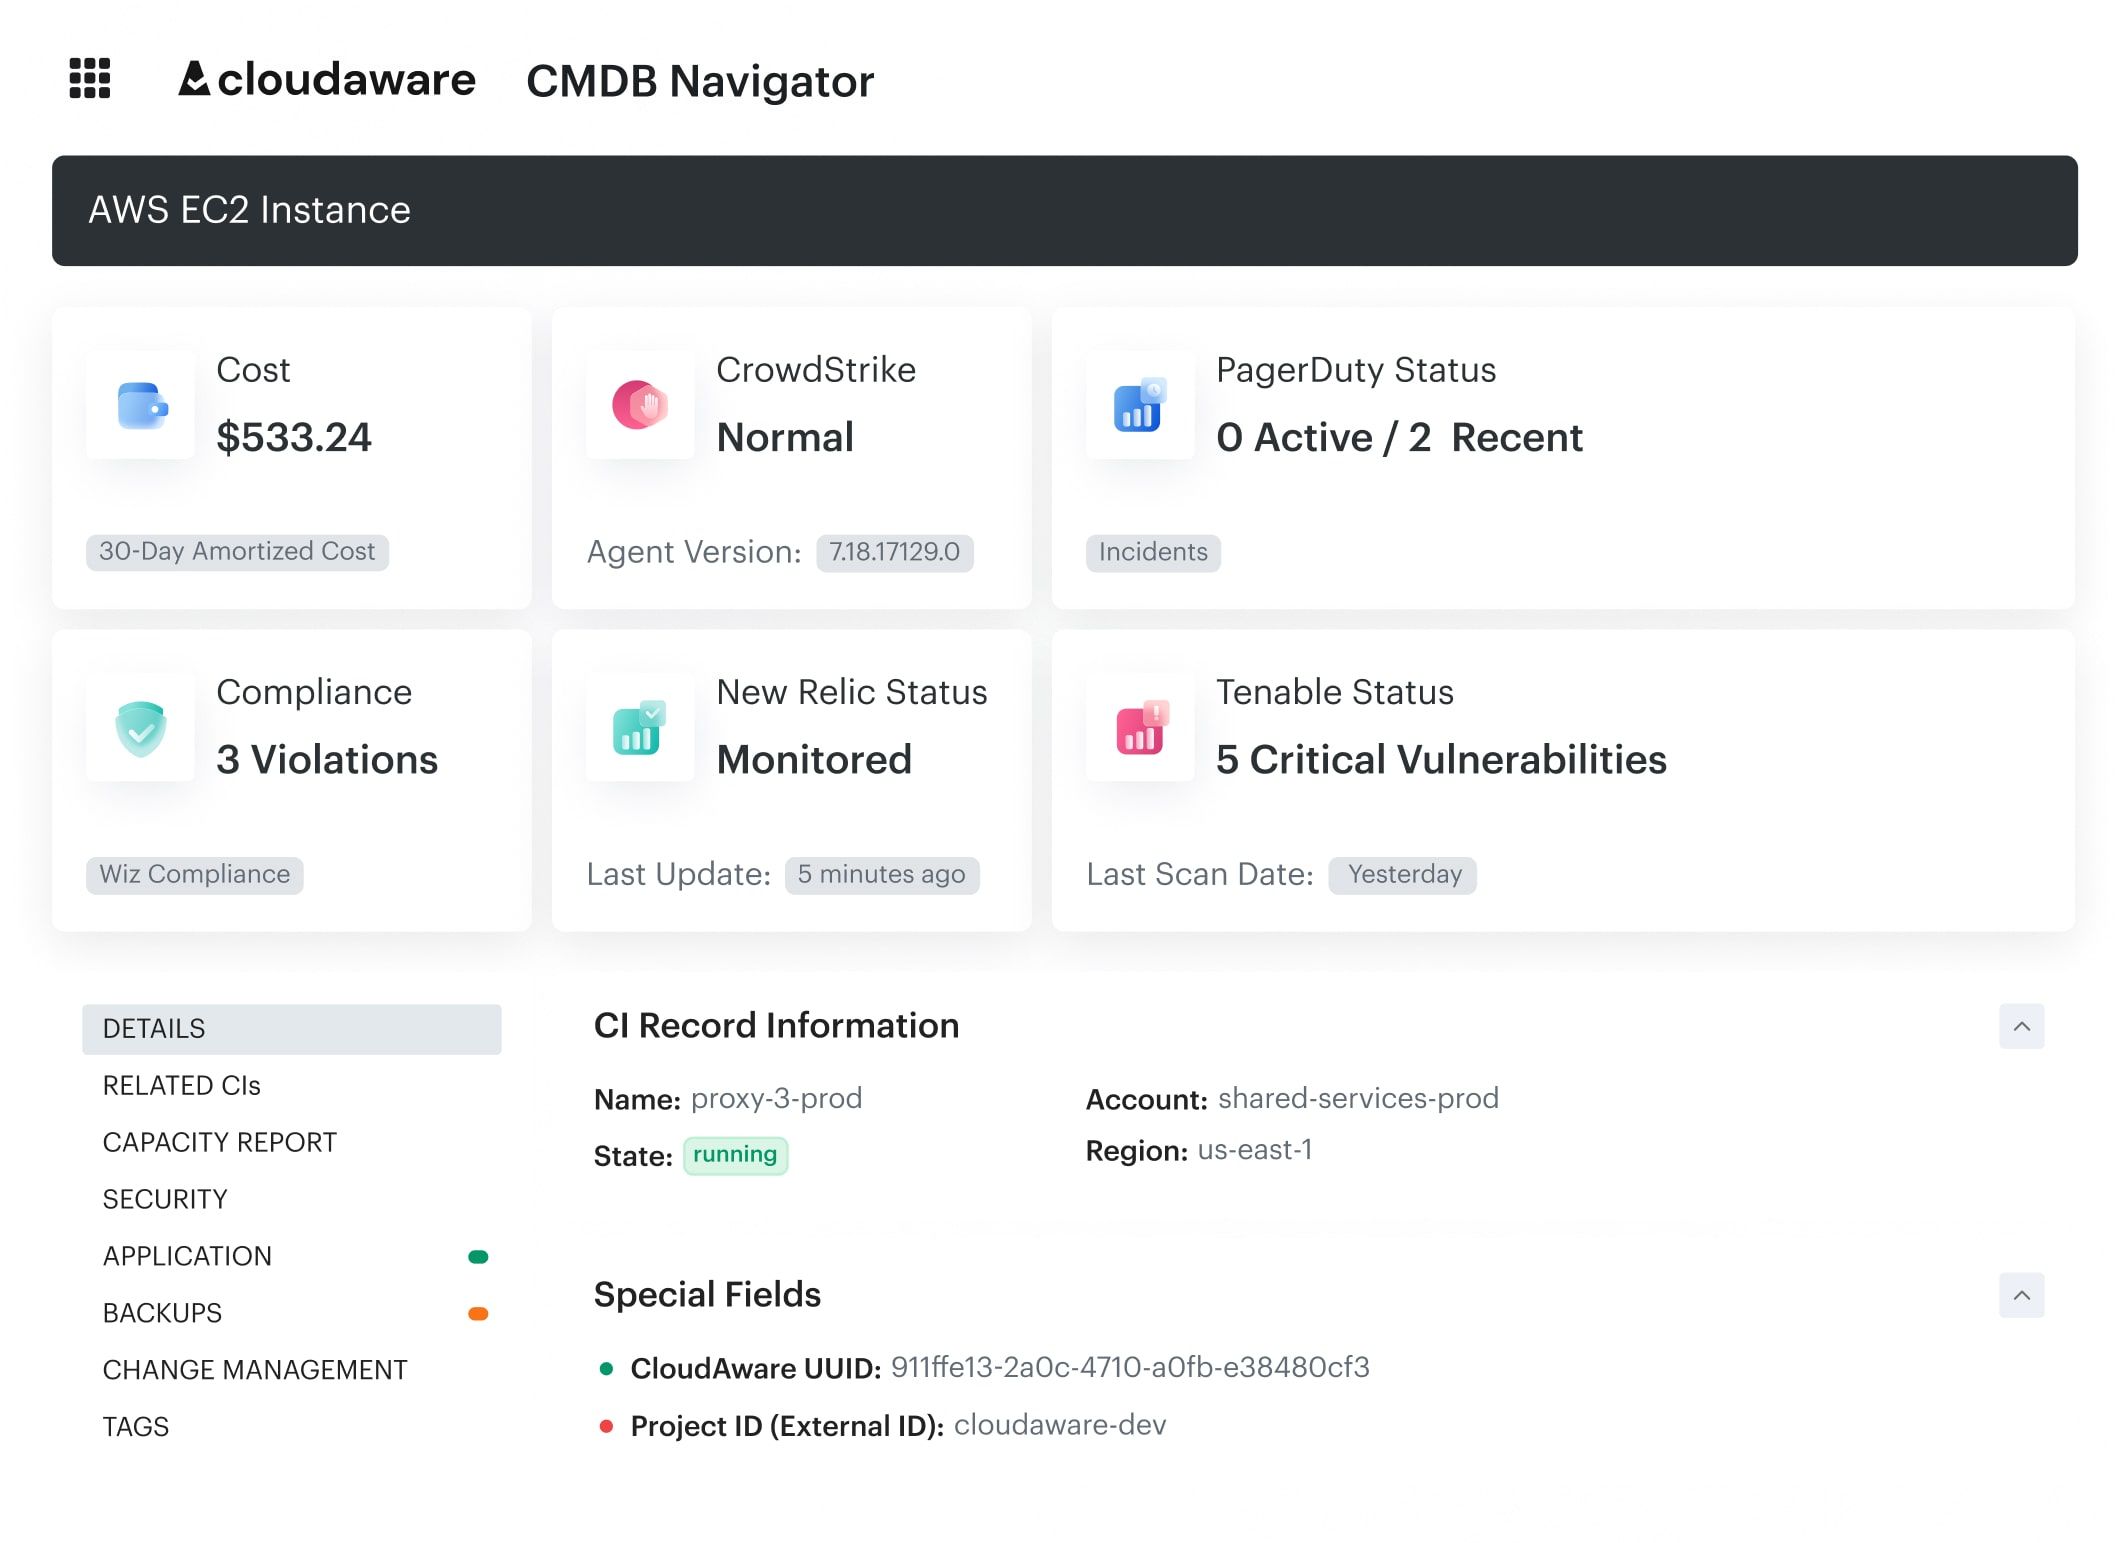
We also link tags to CIs in the CMDB. So when a resource gets rebuilt, we maintain the relationship and don’t lose traceability. No more broken lineage or “mystery EC2 instances.”
This is foundational Inform phase work in the FinOps lifecycle. Without clean tagging, your cloud costs might as well be Monopoly money. You can’t allocate, optimize, or even explain them. And that makes your finance team nervous — and your forecasting dead on arrival.
Start here:
- Define and publish your tag policy across all providers.
- Run a tag compliance scan in Cloudaware and review baseline coverage.
- Set weekly audits and automate violation alerts for drift detection.
Because visibility isn’t a dashboard — it’s discipline. And it starts with a tag.
Read also: Cloud Cost Optimization Framework - 11 Steps to reducing spend in 2026
Link commitments to workload lifecycles — not just usage trends

Let me tell you what not to do. We once had a team go all-in on 3-year reserved instances for a fleet of EC2 workloads supporting a sales enablement app. Looked solid on paper: stable usage, steady region, high daily uptime. The catch? The app was being phased out and quietly replaced by a SaaS tool two quarters later. Those RIs? Still burning through $1,200 a month. Finance was... thrilled.
This is why one of the most overlooked FinOps best practices is aligning commitments with workload lifecycles, not just historical usage.
Here’s how we do it in real life:
Before making any RI or SP decision, we run a lifecycle readiness check on each workload:
- Is it marked as active in the CMDB? (deployment_status__c)
- Is it assigned to a staffed team with roadmap ownership?
- Any migration flags (e.g. to EKS, Lambda, another provider)?
- Is it tagged properly with environment, region, cost_center?
- Is there volatility in usage or billing patterns?
In Cloudaware, we use a combo of CI-level metadata, tagging, and related-item mapping to track which workloads are safe to commit and which ones should be left on-demand. RI/SP planners pull in this context automatically. Anything marked as trial, retiring, or archived is excluded by default.
We also bake in pre-expiry alerts and lifecycle-based filters in our RI dashboards. That way, we’re not just forecasting usage — we’re forecasting intent.
This isn’t about being cautious. It’s about being precise. When you link your commitment strategy to real-world lifecycle data — tracked in your CMDB, enriched with cost allocation tags, and surfaced through FinOps workflows — you unlock true optimization. No more gambling with someone else’s budget.
Once you start using lifecycle status as a gating factor for commitments, your future self will thank you every single month.
Read also: Choose an ideal ITAM software: Top 15 asset management tools
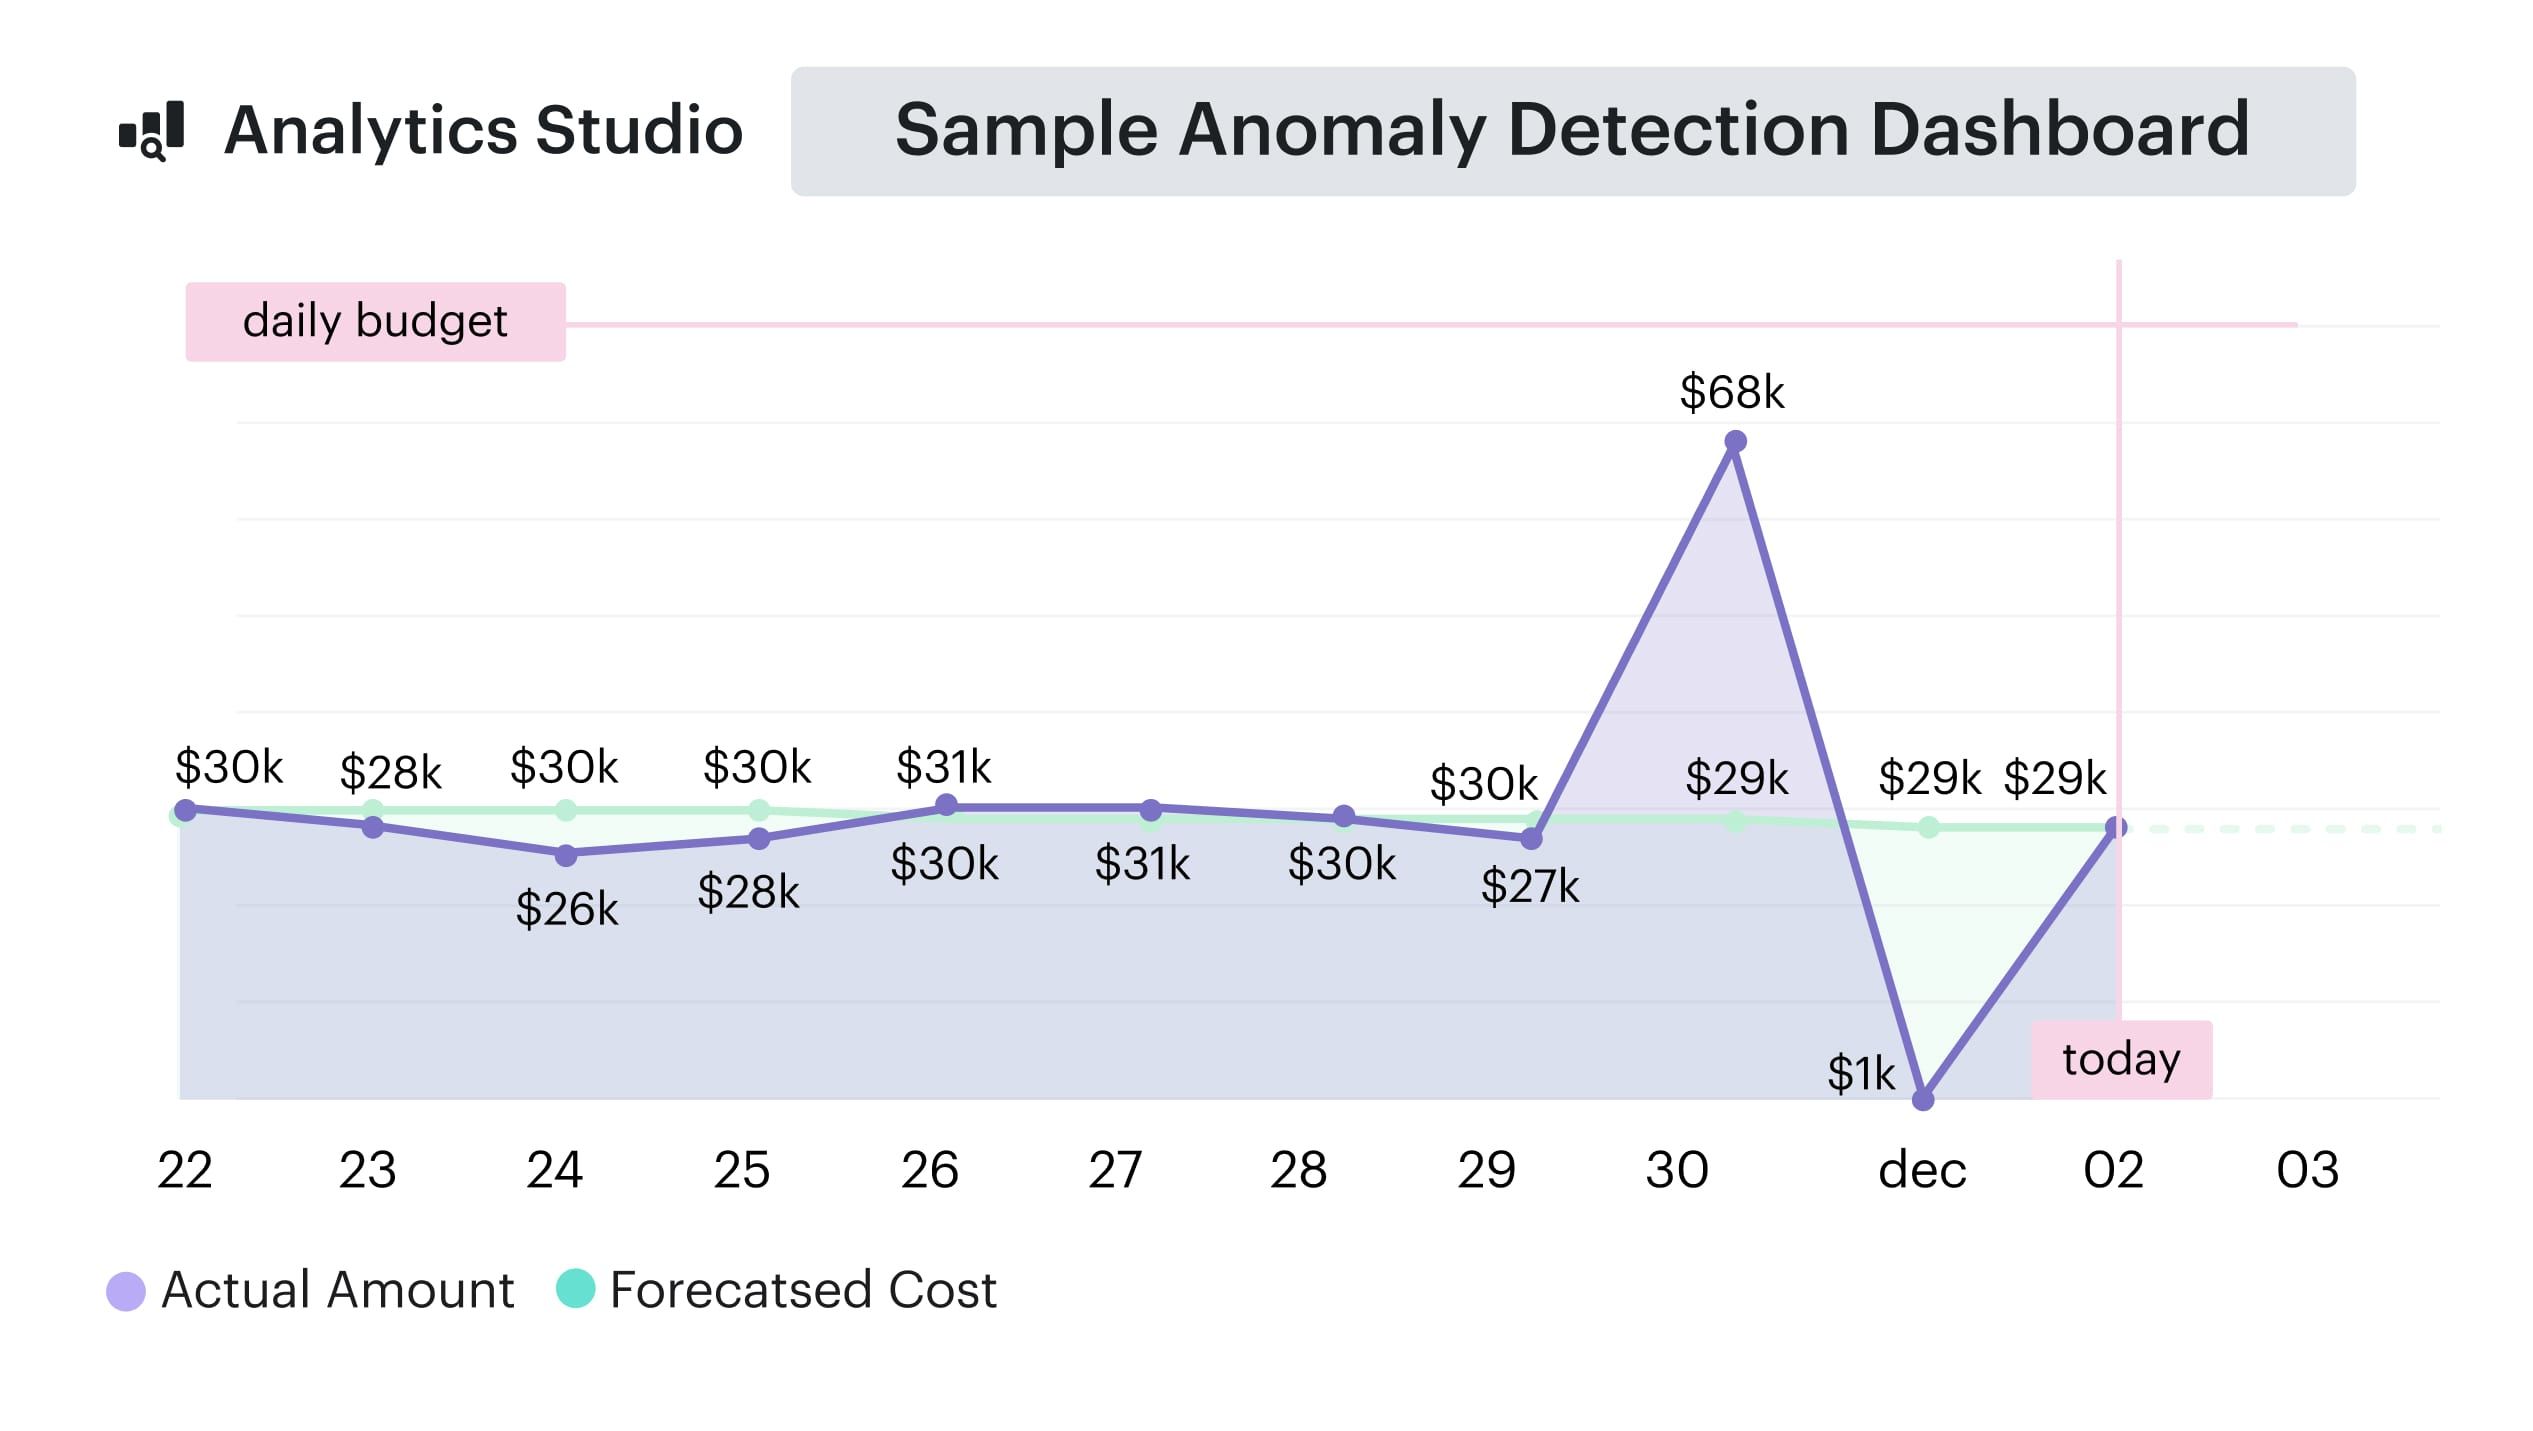
Track spend daily and set real-time alerts for anomalies

One morning, I opened a daily report and saw a GCP project had jumped by $6,300 overnight — with no corresponding bump in usage. No new containers. No pipeline runs. Just cost. Turns out a service account had been quietly pushing data to BigQuery non-stop after a config flag was flipped in staging. Dev team didn’t even know until Finance flagged it — two days late.
This is why daily cloud spend tracking and real-time anomaly alerts aren’t optional — they’re a core FinOps best practice for sustainable spend management.
In Cloudaware, we track daily_cost__c, cost_change_percent__c, and unblended_cost__c across all cloud providers, broken down by cmdb_ci__c, tag_completeness__c, and cloud_account__c. That gives us a full picture of what’s being spent, by whom, and how fast it’s changing.
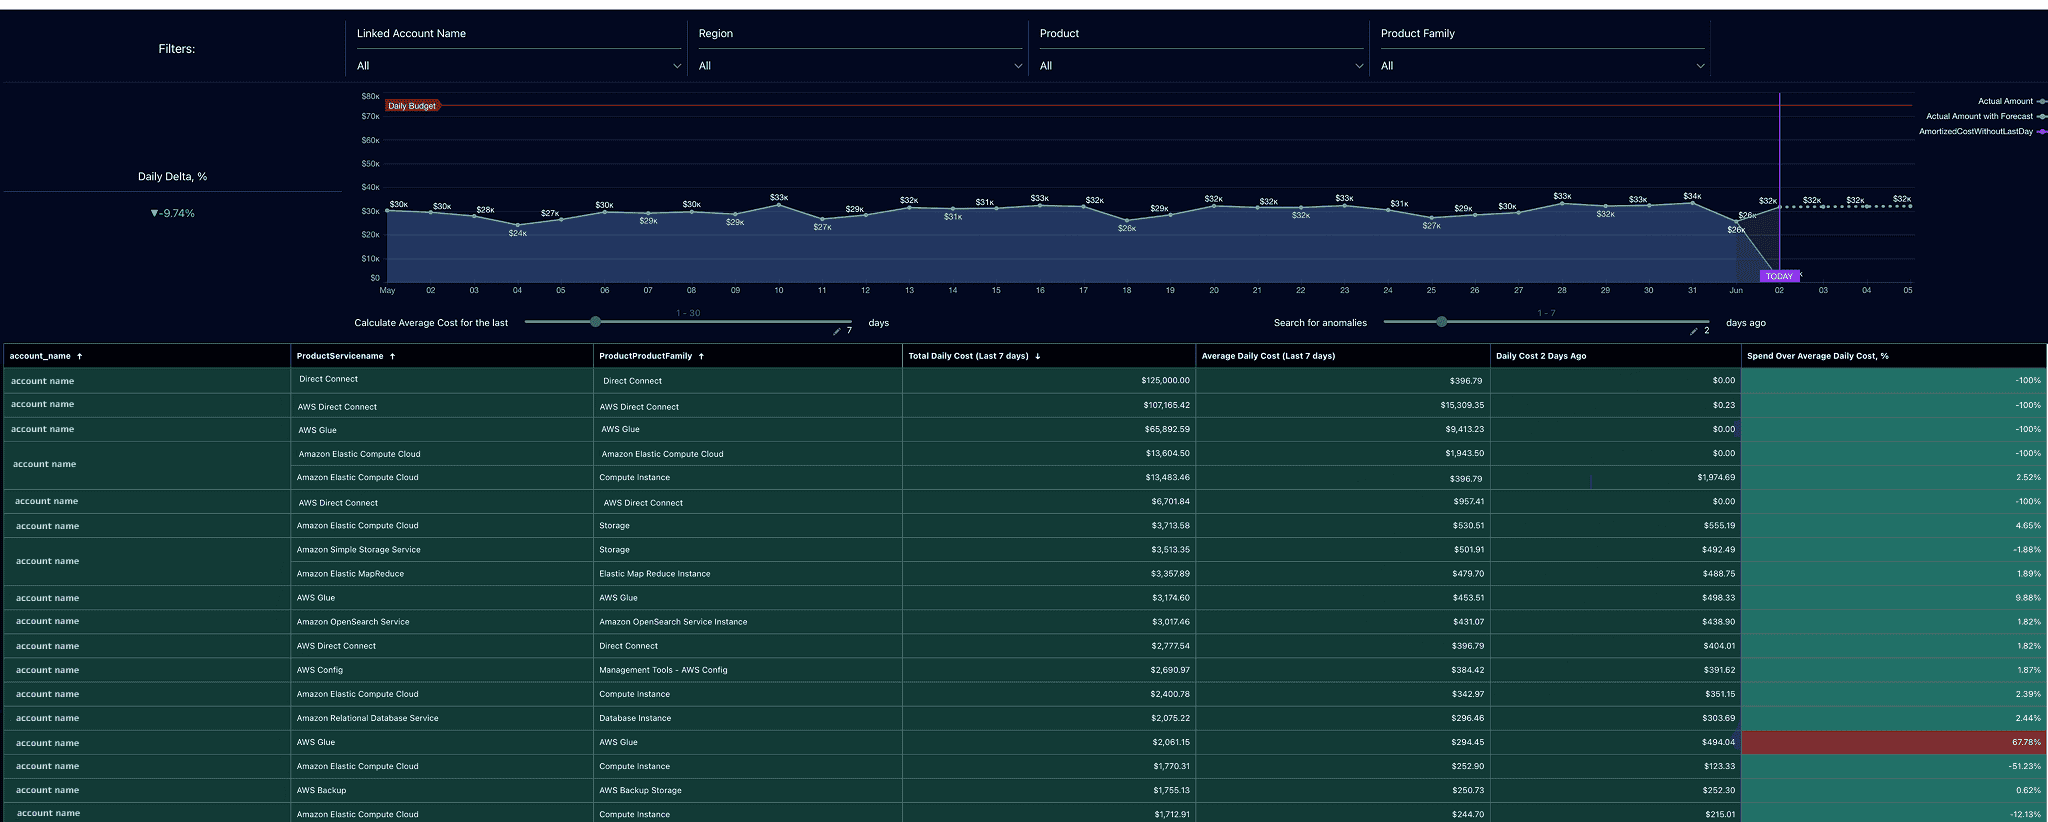
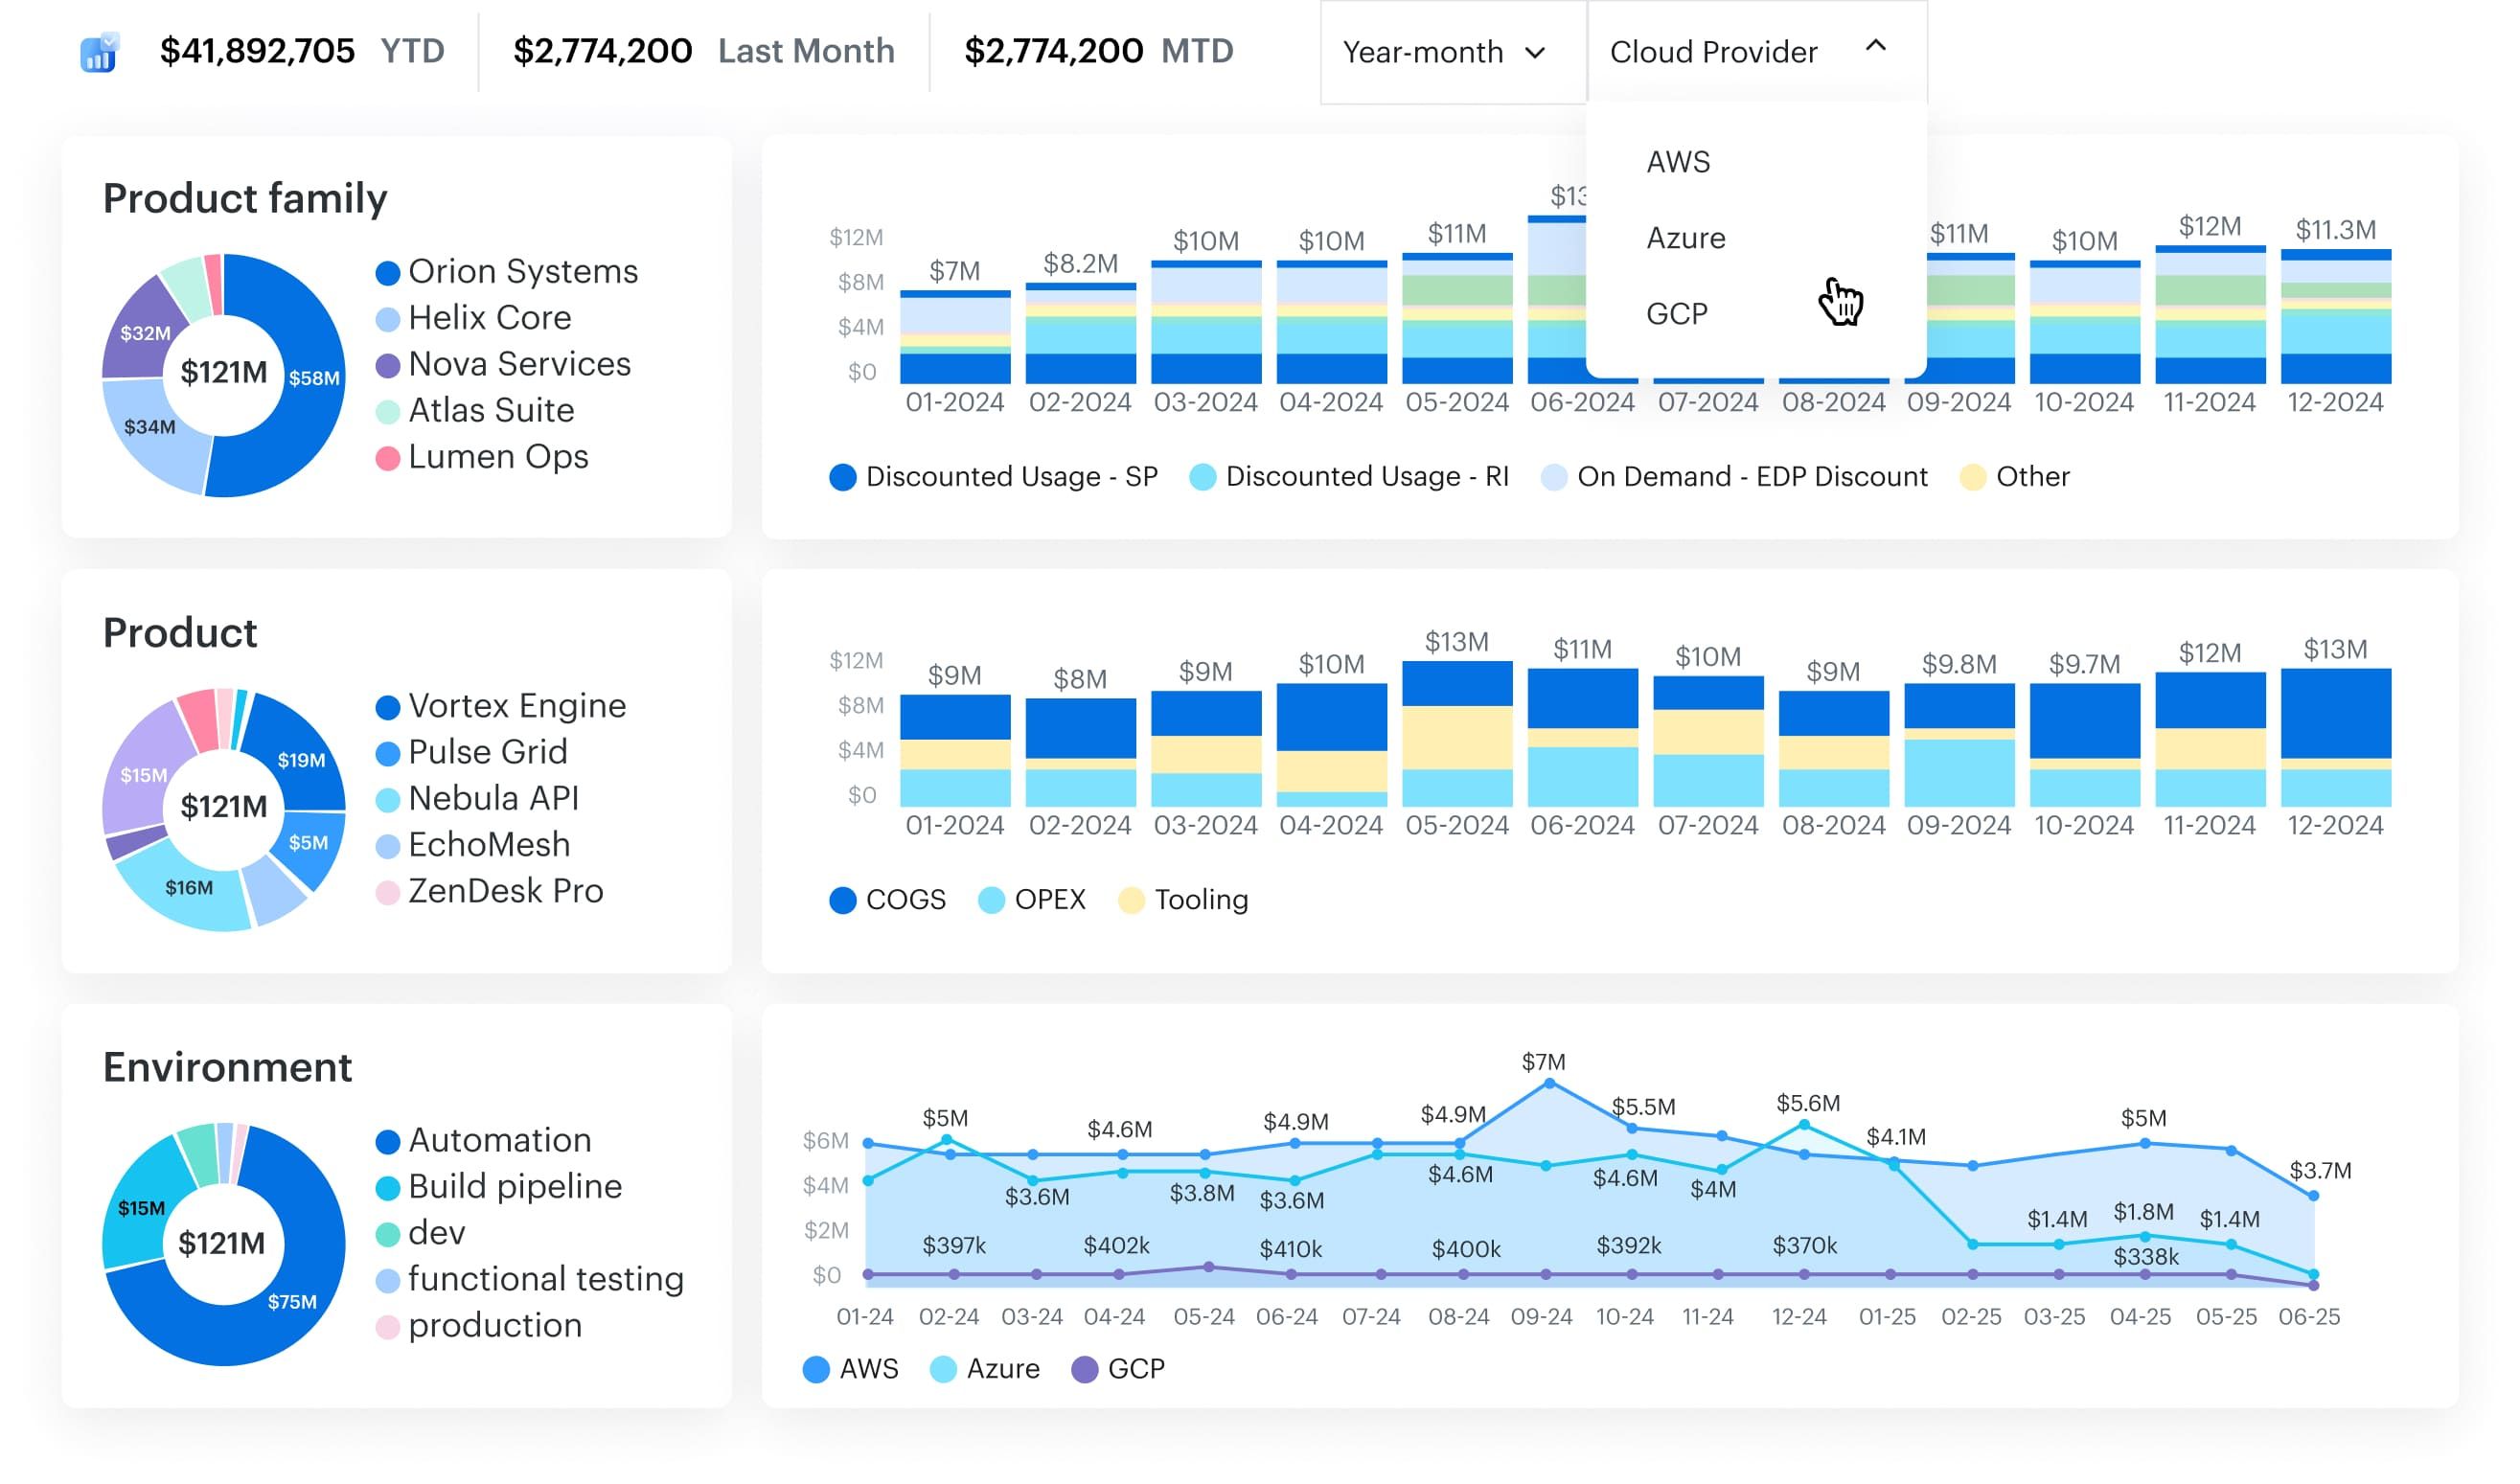
Element of the FinOps dashboard at Cloudaware. Schedule a demo to see how it works.
But it’s not just about detecting raw spend spikes — we also flag spend-to-usage drift. If cost rises without an increase in CPU hours, container instances, or API calls, we look at:
- A dropped RI/SP discount (e.g.
effective_cost__cmisalignment) - Pricing changes from the cloud provider
- Resources running on-demand after a commitment expired
- Unscheduled cross-region usage (e.g. data egress)
We build alerts on these patterns using Cloudaware's Compliance Engine:
- S3 storage growth exceeding 20% over 3 days
- Compute usage tagged as
environment:prodwithout anycost_center - GKE nodes that exceed $300/day but show no deployment updates in CI history
- Cloud SQL instances that double in cost without scaling activity
Alerts are routed based on context:
- Finance teams get budget threshold violations by
cost_center__c - DevOps teams see usage drift alerts mapped to
application__cand resource IDs - FinOps receives weekly anomaly summaries plus missed discount alerts (e.g. RI/SP underutilization)
Each alert links back to the CI and owner via tags and related objects. That means no one’s hunting through dozens of accounts to figure out who owns the spike or whether it’s real.
Auto-detect and act on waste before it bloats your bill

Cloud waste doesn’t show up all at once — it accumulates. Silently. Across thousands of cloud resources, hiding inside quiet EC2 instances, unattached EBS volumes, unclaimed persistent disks, and oversized RDS clusters that haven’t seen real traffic in weeks.
What makes this worse? Teams don’t notice until it’s too late. A forecasting report looks off. A savings plan isn’t delivering returns. Or Finance pings about a spend spike, and now you’re digging through 30 accounts trying to pinpoint which unused resources tipped the scale.
That’s why we built out a waste classification model to stay ahead of the bloat:
- Idle — EC2, RDS, or GKE with <10% CPU or no active connections.
- Orphaned — EBS volumes, snapshots, or managed disks not linked to any active compute.
- Overprovisioned — Instances running at 5% of provisioned capacity for 7+ days.
- Redundant — Parallel non-prod workloads left online post-release.
- Expired — Trial, demo, or test workloads past their decommission tag.
In Cloudaware, these aren’t just theory. They’re rules. Waste detection policies run continuously across all providers and platforms, powered by the Compliance Engine and CMDB. You can write logic like:
IF (instance.cpu_utilization < 5%)
AND (resource.environment != 'prod')
AND (usage_hours__c > 48)
THEN ALERT
And because every resource is mapped to cmdb_ci__c, cost_center__c, and owner_email__c, the alert doesn’t just say “this thing costs too much.” It tells you who owns it, what it belongs to, how long it’s been idle, and what it’s costing you.
FinOps dashboard in Cloudaware. Schedule demo to see it live.
The best part? Once a resource is flagged, you decide the workflow:
- Route it to the owning team via Jira, ServiceNow, or email.
- Group medium-risk waste into weekly optimization reports for FinOps review.
- Escalate deletable resources (e.g., orphaned volumes in non-prod) to auto-action via API.
- Tie savings opportunities directly into your RI/SP planning board to reduce unnecessary committed capacity.
And because you can connect these findings to spend trends and effective_cost__c metrics, they feed straight into forecasting and cost optimization models.
Here’s how most teams start:
- Identify your top 3 spend-heavy services (like EC2, S3, RDS).
- Define 3–5 waste scenarios that apply across your org.
- In Cloudaware, configure those as Compliance Engine rules and set routing workflows by
cost_center__corapplication__c.
Waste doesn’t announce itself. It just keeps running. Until someone sets up a system smart enough to notice that a resource costing $480/month hasn’t been touched since that one test in April.
Read also: What Is FinOps? Framework, Roles, Strategy & Tools in 2026
Build cross-cloud, cross-team dashboards for accountability

Cloud costs don’t go rogue because people are careless. They go rogue because no one’s looking at the same version of reality. Finance sees monthly spikes in a blended spend report. DevOps sees hourly usage trends in Grafana. Engineering sees… nothing until someone forwards them a PDF. Meanwhile, AWS, Azure, and GCP are all speaking slightly different languages — and the only person trying to translate it all is you.
That’s where accountability starts to fall apart.
So we built dashboards that don’t just show spend — they clarify it. Across clouds, across teams, and across every type of resource in flight.
Here’s how we structure it:
- Data sources: AWS CUR files (daily), Azure EA APIs, GCP BigQuery billing exports
- Normalization: We unify fields like
cloud_account__c,cmdb_ci__c,resource_id,usage_type, andeffective_cost__c - Core metrics:
- Total and daily
unblended_cost__c - RI/SP utilization by account and region
- Tag completeness scores per
application__c - Idle resource costs flagged by
usage_hours__c - Forecast vs. actual spend variances by
cost_center__c
- Total and daily
Each dashboard is role-aware — not just in content but in how it’s used:
- Finance tracks real-time budget pacing by cost center, with drilldowns into services and SKUs driving anomalies.
- Cloud architects use reservation coverage overlays and regional cost heatmaps to spot missed commitment opportunities.
- DevOps gets daily optimization reports showing underutilized compute, tag violations, and anomalous growth in
storage_cost__c. - Engineering leads see application-level cost breakdowns tied directly to their services in the CMDB.
And the dashboards don’t just sit there. Alerts and triggers are wired in:
- Missed tagging on high-cost resources? Creates a Jira ticket.
- Forecast deviation >15%? Kicks an email to Finance.
- RDS instance over $500 with <5% CPU for 7 days? Slack ping to DevOps.
The result isn’t just better reporting — it’s operational alignment. Everyone sees the same data, filtered by their role, scoped to their resources, and backed by shared context.
Want to build this into your FinOps program? Start here:
- Identify your top 3 stakeholder groups and what cost visibility they need to take action.
- Build dashboards grouped by
application__c,cost_center__c,environment__c, and provider. - Set up alert rules for key metrics like tag violations, underutilization, and budget drift — and route them to the people who can act on them.
Accountability isn’t just a matter of policy. It’s a function of clarity. And when your dashboards tell a story that’s clear, contextual, and real-time, your teams don’t just monitor usage — they manage it.
Integrate FinOps reviews into change management workflows

Most cloud cost overruns don’t come from a single mistake. They come from change. A new deployment. An urgent patch. A team launching a containerized rewrite in a new region because it “just worked faster over there.” What starts as a sprint ticket becomes a long-term drain — and no one questions the spend until the bill lands.
And here’s the problem: change management and cost reviews rarely speak the same language. Engineering pushes changes. FinOps analyzes usage trends. Finance reconciles cloud costs against forecasts. But without a shared checkpoint, no one catches the cost impact before it hits production.
So we changed that. Inside Cloudaware, we embedded FinOps checks into the actual change workflow.
We start by linking every deployment pipeline and change ticket to the CMDB, where resources are classified by application__c, environment__c, and deployment_status__c. Then, every time a team submits a planned infrastructure change — whether that’s a new EKS node group in AWS, a VM scale set expansion in Azure, or even a networking update — we run a policy evaluation that considers:
- Projected increase in
unblended_cost__cbased on historical usage (usage_type,avg_hourly_cost.) - Whether the target resource type is covered by RI/SP or would default to on-demand.
- If the region or service matches preferred pricing agreements (e.g., Azure enterprise discounts or AWS EDP rates).
- Tag compliance and ownership mapping — because an untagged resource mid-change is almost guaranteed to get lost in cost reports.
If the projected cost increase crosses a certain threshold, Cloudaware automatically flags the change for FinOps review. That could mean tagging a Jira ticket, adding a ServiceNow workflow approval, or routing the context straight to a Slack channel with the affected cost_center__c owner looped in.
The beauty of this model? No post-mortems. No guessing games. No mystery spike from “some change last sprint.” Teams know their proposed change triggers a cost visibility checkpoint — and FinOps knows exactly what’s coming, from which team, and why.
This works across providers. We’ve embedded Azure FinOps best practices (like reviewing scope overlap and EA tiering before committing new regions), and AWS FinOps best practices (like catching bursty usage going outside RI/SP coverage mid-deployment).
Forecast using amortized costs and scenario modeling
Cloud forecasting gets messy fast. Finance wants a clean number. Product wants wiggle room. Engineering keeps saying “don’t worry, it autoscaled.” But when your AWS RI commitment expires next quarter, your Azure EA tier shifts, and your GCP project doubles in usage... that monthly spend model built in Sheets won’t hold.
This is where amortized cost forecasting becomes your anchor — and scenario modeling becomes your radar.
Here’s how we handle it inside Cloudaware.
We start with clean input data, pulled from actual usage and structured cost signals:
effective_cost__cfor amortized cost per resource, so we avoid distorted spikes from RI/SP purchases.usage_hours__c, CPU metrics, and API call volume to model service-level growth.cmdb_ci__candcost_center__cfor cost allocation granularity.- RI/SP utilization history across accounts, including coverage gaps and expiration timelines.
Then we define forecastable baselines for every team, app, and cloud provider. This means we’re not predicting future usage based on raw bills — we’re projecting based on usage trends and how pricing mechanics will change over time.
Take a real-world scenario we run quarterly:
What’s the projected cost if we move 40% of our on-demand EC2 fleet in us-east-1 to 1-year RIs, and simultaneously launch a new AI workload in Azure West Europe?
In Cloudaware, we clone a baseline report grouped by cloud_account__c, application__c, and service type. Then we simulate RI impact using previous unblended_cost__c vs. effective_cost__c ratios, map expected AI compute growth using prior usage_hours__c, and track total delta in projected monthly cloud costs.
But we don’t stop there. Each forecast is linked to a forecast model that can be selected or adjusted in Salesforce, depending on what best fits the use case. Forecasts can be broken down by any dimension — so individual teams can track projections for their own areas, while executives see consolidated totals. Salesforce can also extend these forecasts as far into the future as needed.
This forecast data feeds directly into:
- RI/SP purchasing decisions
- Quarterly budget alignment by business unit
- Application-specific growth planning
- Reallocation strategies when we spot underutilized commitments
We also use forecast modeling to simulate pricing shifts: “What if GCP increases storage rates 8% next quarter?” “What happens if our Azure discount tier drops due to missed thresholds?”
This isn’t about guesswork. It’s about using real cloud usage to simulate multiple futures — and making strategic choices before those futures show up on your invoice.
So when leadership asks for a 6-month forecast by region, environment, and service type? You’ve already got three versions — each one mapped to a real scenario and backed by the data your teams already trust.
That’s FinOps forecasting done right: not just predicting spend, but guiding the program forward with both eyes open.
Read also: Cloudaware vs. CloudZero – Choose the Right FinOps Partner
Use cost per unit metrics to drive engineering behavior
You can’t optimize what you can’t contextualize. A $75,000 monthly bill for compute might raise eyebrows — but it won’t change behavior. That’s because engineering doesn’t build services in dollars. They build them in calls, queries, deployments, and sessions. If you want to shape cloud usage decisions upstream, you need to speak their language — and that means shifting from total cloud cost to cost per unit.
This is one of those FinOps best practices that sounds simple but changes everything.
In real-world terms, we start by defining units based on resource type:
- Compute (EC2, Azure VMs, GCE): cost per vCPU hour, per deployment, per active container.
- Storage (S3, Blob, GCS): cost per GB stored or per storage request.
- Data platforms (Athena, BigQuery, Azure Synapse): cost per TB scanned or per query.
- Serverless (Lambda, Azure Functions): cost per invocation or per API call.
- SaaS layers or internal apps: cost per user, session, or transaction.
Then we use Cloudaware’s tagging model and CMDB relationships to trace actual cloud resources to the logical services that generate those units. Each resource_id is tied to an application__c, cost_center__c, and cmdb_ci__c, which means we can group all underlying usage and cost data by real product boundaries — not just AWS account or GCP project.
To bring unit economics to life, we either:
- Connect business usage metrics (e.g., number of sessions, API calls) via external data sources.
- Or manually upload them into dashboards as usage fields per app/team.
Once that’s in place, we calculate effective_cost__c or blended_cost__c per unit, and bake it into dashboards that engineers actually use. So instead of saying “your DynamoDB bill jumped 22%,” we say “your cost per user session increased from $0.004 to $0.007.”
That’s when the shift happens. Engineers start asking:
- “What’s causing the regression in cost per request?”
- “Is this Lambda still running too hot for what it’s doing?”
- “Do we need to rightsize this autoscaling group?”
And here’s the kicker: we turn those insights into triggers. If cost_per_transaction exceeds a defined threshold, Cloudaware pushes an alert to the app owner. Teams review these spikes during sprint retros or include them in their release checklists — just like they would with performance or error rates.
Want to build this into your own program? Start here:
- Define key unit metrics per service type (calls, users, deployments, TBs scanned).
- Tie cloud cost data to those metrics using Cloudaware tags, CI links, and external usage feeds.
- Set cost-per-unit alert thresholds and include them in optimization backlogs or sprint planning.
Because in modern FinOps practices, “cost per unit” is where strategy meets engineering. It transforms optimization from a spreadsheet concern into a build-time conversation.
And when teams build with cost-awareness baked into their everyday thinking, you’re not chasing savings. You’re designing for them.
Read also: Expert Review of Top 10 It Inventory Management Software For 2025
Automate reserved instance and SP planning across teams
Commitment discounts are one of the most powerful levers in cloud financial management — but only when they’re applied with surgical accuracy. In practice, though? Many teams still commit based on gut feel, last quarter’s usage reports, or after-the-fact Finance pressure to “lock something in.”
And that’s exactly how organizations end up with $100K worth of unused RIs, orphaned SPs in deprecated regions, and compute workloads burning cash at on-demand rates. Not because anyone made a bad decision — but because no one had a complete view.
Here’s how we’ve automated that view across teams using Cloudaware.
We start by organizing all eligible commitment types across clouds:
- AWS: EC2 Standard/Convertible RIs, Compute Savings Plans, Instance Savings Plans
- Azure: Reserved Instances for VMs, SQL, Cosmos DB
- GCP: Commitment tiers (e.g., BigQuery flat-rate slots, committed use discounts for VMs)
Every instance and resource is tied to a cmdb_ci__c, cost_center__c, and deployment_status__c in the CMDB. That structure lets us classify workloads based on lifecycle stage (active, volatile, retiring), ownership, and commitment eligibility.
From there, Cloudaware automatically maps:
- Current RI/SP coverage per environment and team.
- Utilization rates using
effective_cost__cvs. unblended rates. - Expiration windows for all active commitments.
- Underutilized commitments flagged via policy (e.g. <70% usage for 10+ days).
- Eligible uncovered workloads, prioritized by stability, runtime, and resource type.
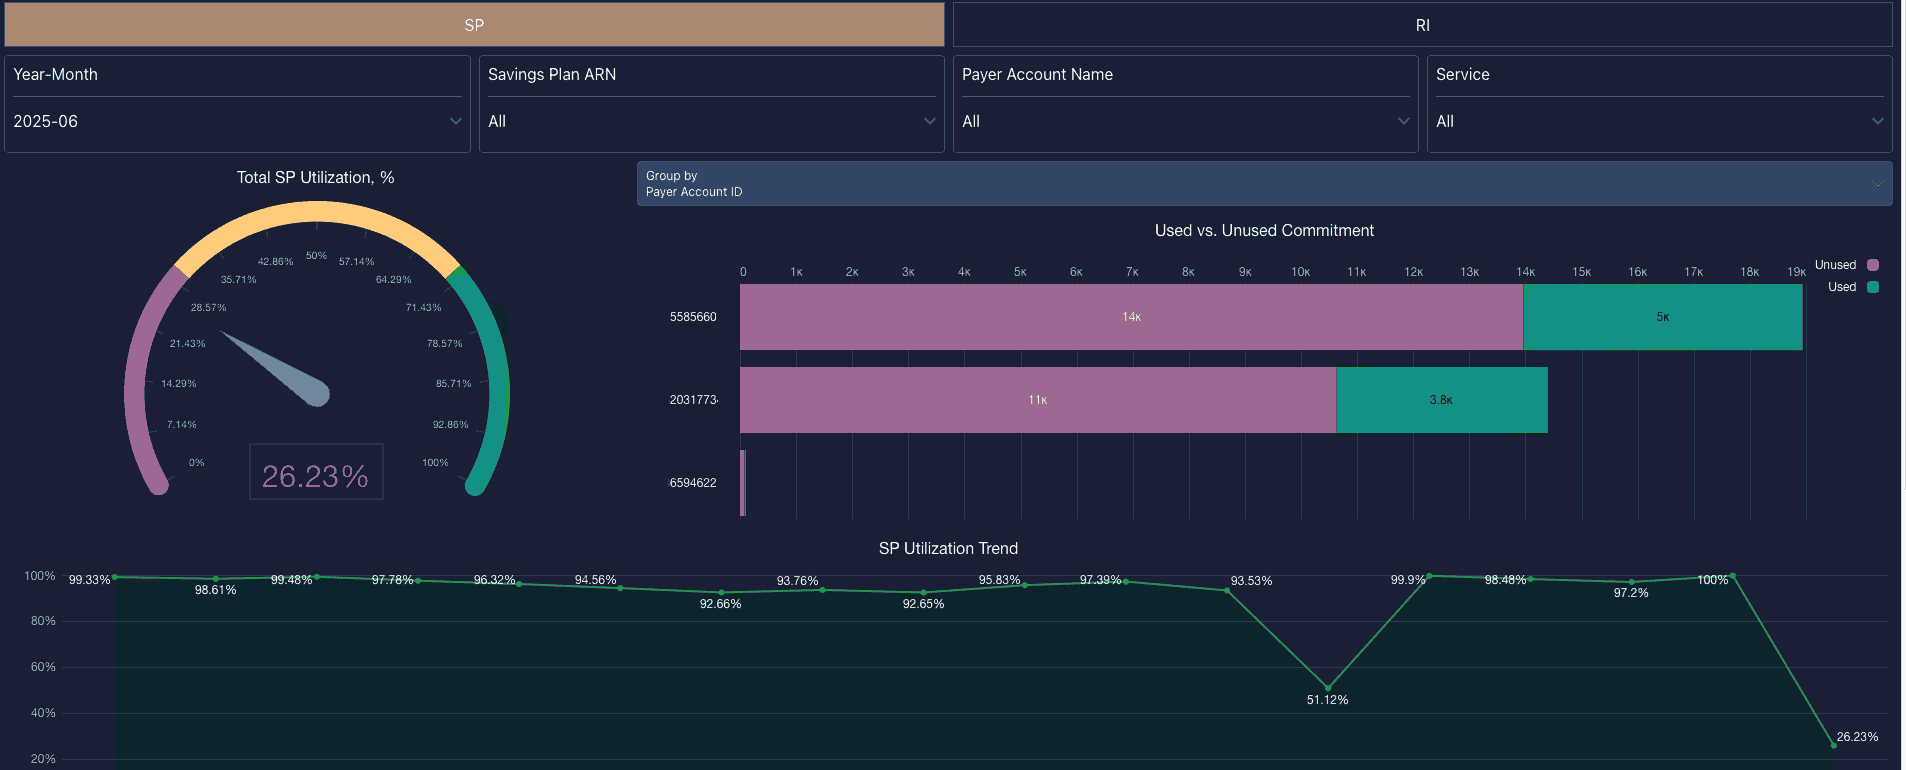
Element of the FinOps dashboard at Cloudaware. Schedule a demo to see how it works.
Dashboards are built at multiple levels:
- Finance sees overall coverage rates, projected amortized savings, and unused commitment waste.
- Engineering sees workload-level recommendations: which VMs, containers, or services should be covered (or not).
- DevOps receives upcoming expiry alerts and commitment suggestions for specific instance families.
- FinOps teams monitor multi-cloud RI/SP utilization and share impact analyses across accounts and cost centers.
Everything is automated using policy logic:
- When utilization drops below a threshold, we trigger a
Commitment Wastealert. - Expiring RIs/SPs within 30 days are routed to owners via ticket or Slack with account- and application-specific impact summaries.
Want to start automating this? Begin here:
- Define your RI/SP eligibility criteria (lifecycle, usage, team ownership).
- Set underutilization thresholds (e.g., <60% RI coverage for stable workloads).
- Create expiration alerts 30–60 days before renewal windows.
- Share team-level dashboards filtered by
application__c,cost_center__c, andcloud_account__c. - Run monthly reviews of unused commitments and recommended purchases.
This is one of those FinOps practices that pays off in both savings and sanity. Because when every team sees what’s covered, what’s not, and why — it’s no longer about guessing.
It’s just good cloud cost management, done on purpose.
Create a cloud cost center of excellence with custom roles & views
FinOps isn't one person’s job. Use Cloudaware’s role-based access control to give tailored dashboards to Finance, Engineering, and Product teams. Everyone sees their slice — without exposing sensitive org-wide data.
Cloud cost data isn’t just complex — it’s layered. One number means five different things to five different teams. Finance wants cost by business unit. DevOps needs real-time usage by region. Engineering cares about container-level spikes. And leadership? They want to know if they’re trending under budget this quarter without scrolling through a CSV.
That disconnect doesn’t mean your reports are broken — it means you haven’t operationalized FinOps visibility by role. Which is exactly why one of the most scalable FinOps practices is to create a Cloud Cost Center of Excellence (CCoE) backed by custom roles and filtered views.
Think of your CCoE as a cross-functional structure that owns:
- The data model for cloud cost governance
- Access policies for reporting, alerts, and dashboards
- FinOps enablement across engineering, finance, and platform teams
- Automation standards for RI/SP planning, anomaly routing, and cost optimization
In Cloudaware, this starts with scoping views by persona:
- Finance sees rolled-up spend by
cost_center__c, across AWS, Azure, and GCP, using bothblended_cost__candeffective_cost__cto monitor savings and amortization. - DevOps gets alert subscriptions for tag compliance violations, resource spikes, and underutilized infrastructure — all filtered by
owner_email__candapplication__c - Cloud architects access RI/SP utilization views by
cloud_account__cand region to guide purchase strategies and adjust commitments. - Product and business leads receive dashboards showing cost-per-feature or per-environment breakdowns, scoped by
cmdb_ci__cand service type.
All of this is enforced through role-based access controls in Cloudaware. We assign users to permission groups based on their scope of accountability, then build dashboards filtered on tag dimensions like cost_center__c, application__c, resource_type, or deployment_status__c. Each view is built to show exactly what the team needs — and nothing more.
Even better, these aren’t static dashboards. You can:
- Automate weekly cost digests sent via email or Slack.
- Push spend anomaly reports to app owners.
- Embed filtered cost views into Confluence or Jira for ongoing planning.
- Set who can edit optimization alerts, commitment plans, or forecast models.
Want to implement this today? Use this starter framework:
- Map your internal roles: Finance, DevOps, Engineering, Cloud Ops, Business.
- Define the cost and usage metrics each role needs (e.g., RI/SP coverage, usage anomalies, cost per unit.)
- Use Cloudaware to build role-specific views filtered by key tags (
application__c,cost_center__c,cloud_account__c). - Set access controls and reporting permissions for each group.
- Embed reporting flows into existing channels: email, Slack, dashboards, sprint rituals.
This isn’t about giving more people access to billing files. It’s about building a structure that makes cloud financial data accessible, relevant, and trusted across the organization.
Because when each team gets a cost view tailored to how they work — they don’t just observe cloud costs. They own them.
Implement FinOps best practices with Cloudaware
All those FinOps best practices we’ve been talking about? The real secret isn’t just knowing what to do. It’s having the right foundation to actually do it at scale — across every region, team, and account, without pulling billing data manually or chasing down resource owners on Slack.
That’s where Cloudaware steps in. It’s the command center for cloud financial management used by some of the most infrastructure-heavy organizations on the planet — where cost, usage, and operational context all live in one place.
It pulls in your daily cloud billing from AWS, Azure, Oracle, Alibaba, and GCP, aligns it with your tag structure, CMDB metadata, and org policies — and turns it into actual FinOps leverage. It ties every cost to the exact app, team, and lifecycle stage — whether that resource’s still humming in production or was spun up for testing and left behind three sprints ago.
Your teams — FinOps, Finance, DevOps, Cloud Platform, Engineering — use Cloudaware to monitor, optimize, and own their piece of the puzzle. And here's what that looks like in practice:
Features that make FinOps real (and actually manageable):
- Daily cost tracking across providers, with support for both
blended_cost__candeffective_cost__cto align spend with RI/SP amortization. - Forecasting models using actual
usage_hours__c, service type, and business unit tags (cost_center__c,application__c). - Cross-cloud RI/SP planner to automate commitment strategy, track underutilization, and flag upcoming expirations.
- Waste detection engine powered by 100+ customizable rules to auto-flag idle, orphaned, or over-provisioned resources.
- Tag compliance monitoring that checks
tag_completeness__cdaily and alerts when governance slips. - Custom dashboards per role, with permissions scoped by
cloud_account__c, team, and business unit. - Embedded change reviews, tying cost impact to infra tickets and deployment workflows.
- Cost-per-unit tracking, so engineers can see real spend in terms of users, queries, API calls, and more.
- Alert automation via email, Slack, Chatter, or ticketing tools — so spend spikes never fly under the radar.
Everything connects through the CMDB, so you’re not just watching resources — you’re managing them in a full operational context.
And here’s the kicker: it works just as well for on-prem environments. So if your team’s juggling hybrid cloud setups, disconnected asset inventories, or compliance requirements that still touch physical servers? You’re covered.
If all this sounds like the kind of structure your cloud cost optimization program’s been missing — good. It is.