


You’re here for a clean, runnable map of FinOps domains — something you can ship between CI checks, not park in a deck.
We know the mess: AWS CUR to Athena half-wired, Azure Cost Management exports late, GCP BigQuery billing fat but unlabeled, tags missing application and owner_email, anomaly alerts screaming into Slack with no owner. On top of that Jira tickets piling up, RI/SP/CUD coverage drifting, Kubernetes requests/limits inflated, forecast variance wrecking budget reviews.
What you’ll read comes from my teammates — FinOps practitioners with 10+ years in the trenches. They help companies run showback/chargeback, stand up Tagging Governance, build Commitment Planning, and tune Anomaly Management for multi-cloud every day.
This is how they work, what breaks, and what actually moves FinOps maturity forward.
In this guide, they’ll answer:
- Where do FinOps domains and capabilities intersect so work flows, not stalls?
- Which FinOps capabilities unlock value first per domain?
- What KPIs prove you’re improving next month?
- How do you route owners, enforce policy in CI/CD, and keep unit economics trusted?
But first, let’s check if we’re on the same page about the basics 👇
What are FinOps domains?
FinOps domains are the outcomes your FinOps practice is trying to deliver. They’re the buckets that describe what “good” looks like at the business level: clear usage and cost visibility, measurable business value, continuous optimization, and a FinOps practice that runs like a system instead of a series of heroics.
In the field, teams often break these outcomes into smaller operational domains so work routes cleanly to owners.
That’s why your day-to-day work tends to cluster into areas like:
- Cloud usage and cost allocation
- Anomaly detection and response
- Budget management and forecasting
- Commitment planning
- Tagging governance
- Chargeback/showback operations
- Sustainability and carbon tracking
If you’re running multi-cloud with 200+ linked accounts, multiple business units, and hybrid architectures, this breakdown is how you scale without drowning in alerts, missed savings, or chargeback disputes. It turns “FinOps” from a vague responsibility into a set of owned motions with metrics you can improve.
But knowing your domains is just the beginning. To move the needle, you need to understand what happens inside each one — and that’s where FinOps capabilities come in 👇
What are FinOps capabilities?
FinOps capabilities are the building blocks — the specific things your team does to run, scale, and improve your FinOps processes. If your FinOps domain is the category (like Cost Allocation or Forecasting), then the capabilities are the operational moves inside it. They define what you’re responsible for, what you can measure, and how mature your process is. Each domain describes a set of capabilities; you mature capabilities based on value and need.
So when you’re setting up a process to track idle resources, that’s a capability. When you're automating tag conformance checks in CI/CD, that’s another one.
Building chargeback logic into your CMDB? Yep — capability.
Here’s how FinOps capabilities show up across domains:
- In Cloud Usage & Cost Allocation, you’ll have capabilities like cost allocation by tag, shared cost splitting, and unit economics tracking.
- In Forecasting & Budgeting, it’s things like variance analysis, top-down forecasting, and budget alerts.
- In Anomaly Detection, it’s threshold configuration, ownership routing, and false positive control.
FinOps teams maturing their capabilities using the maturity model should evaluate each one independently — because no two capabilities grow at the same pace. You might be at “run” for commitment planning but still “crawl” in anomaly alert routing. That’s normal.
The key? Knowing which capabilities sit inside each domain — and where you need to level up next.
Let’s break it down — starting with Domain 1: Measuring Cloud Usage and Cost. Because if you can’t measure accurately, nothing else in FinOps stands a chance.
4 FinOps domains in the FinOps Framework
These four domains come straight from the FinOps Foundation’s FinOps Framework. They’re the official, top-level outcomes the framework uses to organize everything a FinOps practice does. No rewording, no “close enough” synonyms, because these names are how the Foundation maps capabilities, maturity, and guidance across the ecosystem.
So when we say “FinOps domains in the FinOps Framework,” we mean exactly these four:
- Understand Usage & Cost
- Quantify Business Value
- Optimize Usage & Cost
- Manage the FinOps Practice
Domain 1. Understand usage & cost
This domain is all about capturing, normalizing, and enriching cloud usage and cost data so it fuels every downstream FinOps process — allocation, forecasting, anomaly detection, and more.
You know how it is — every provider has a different export format. Tags are inconsistent. SKUs don’t align. And by the time Finance flags a cost spike, Engineering’s already moved on. That’s why this domain matters.
It’s where you get a unified view of usage, across clouds, cleaned up and ready for action.
Key FinOps capabilities in this domain include:
- Normalizing usage and cost records across AWS, Azure, GCP, Oracle, and Alibaba
- Mapping usage to service, account, region, tag, and resource ID
- Ingesting Kubernetes usage by namespace, workload, and cluster
- Ensuring hourly or daily granularity for cost breakdowns
- Validating and enriching tags — managing gaps with CMDB-driven virtual tagging
Let’s say your AWS costs spike due to an unthrottled EC2 auto-scaler. If you’ve got hourly granularity and CMDB-linked tags, that anomaly will surface the same day — attributed to the app and owner, with full context. If not? That spike just becomes another line item in your month-end surprise.
Here is one of the dashboards showing cost avoidance by utilization status:
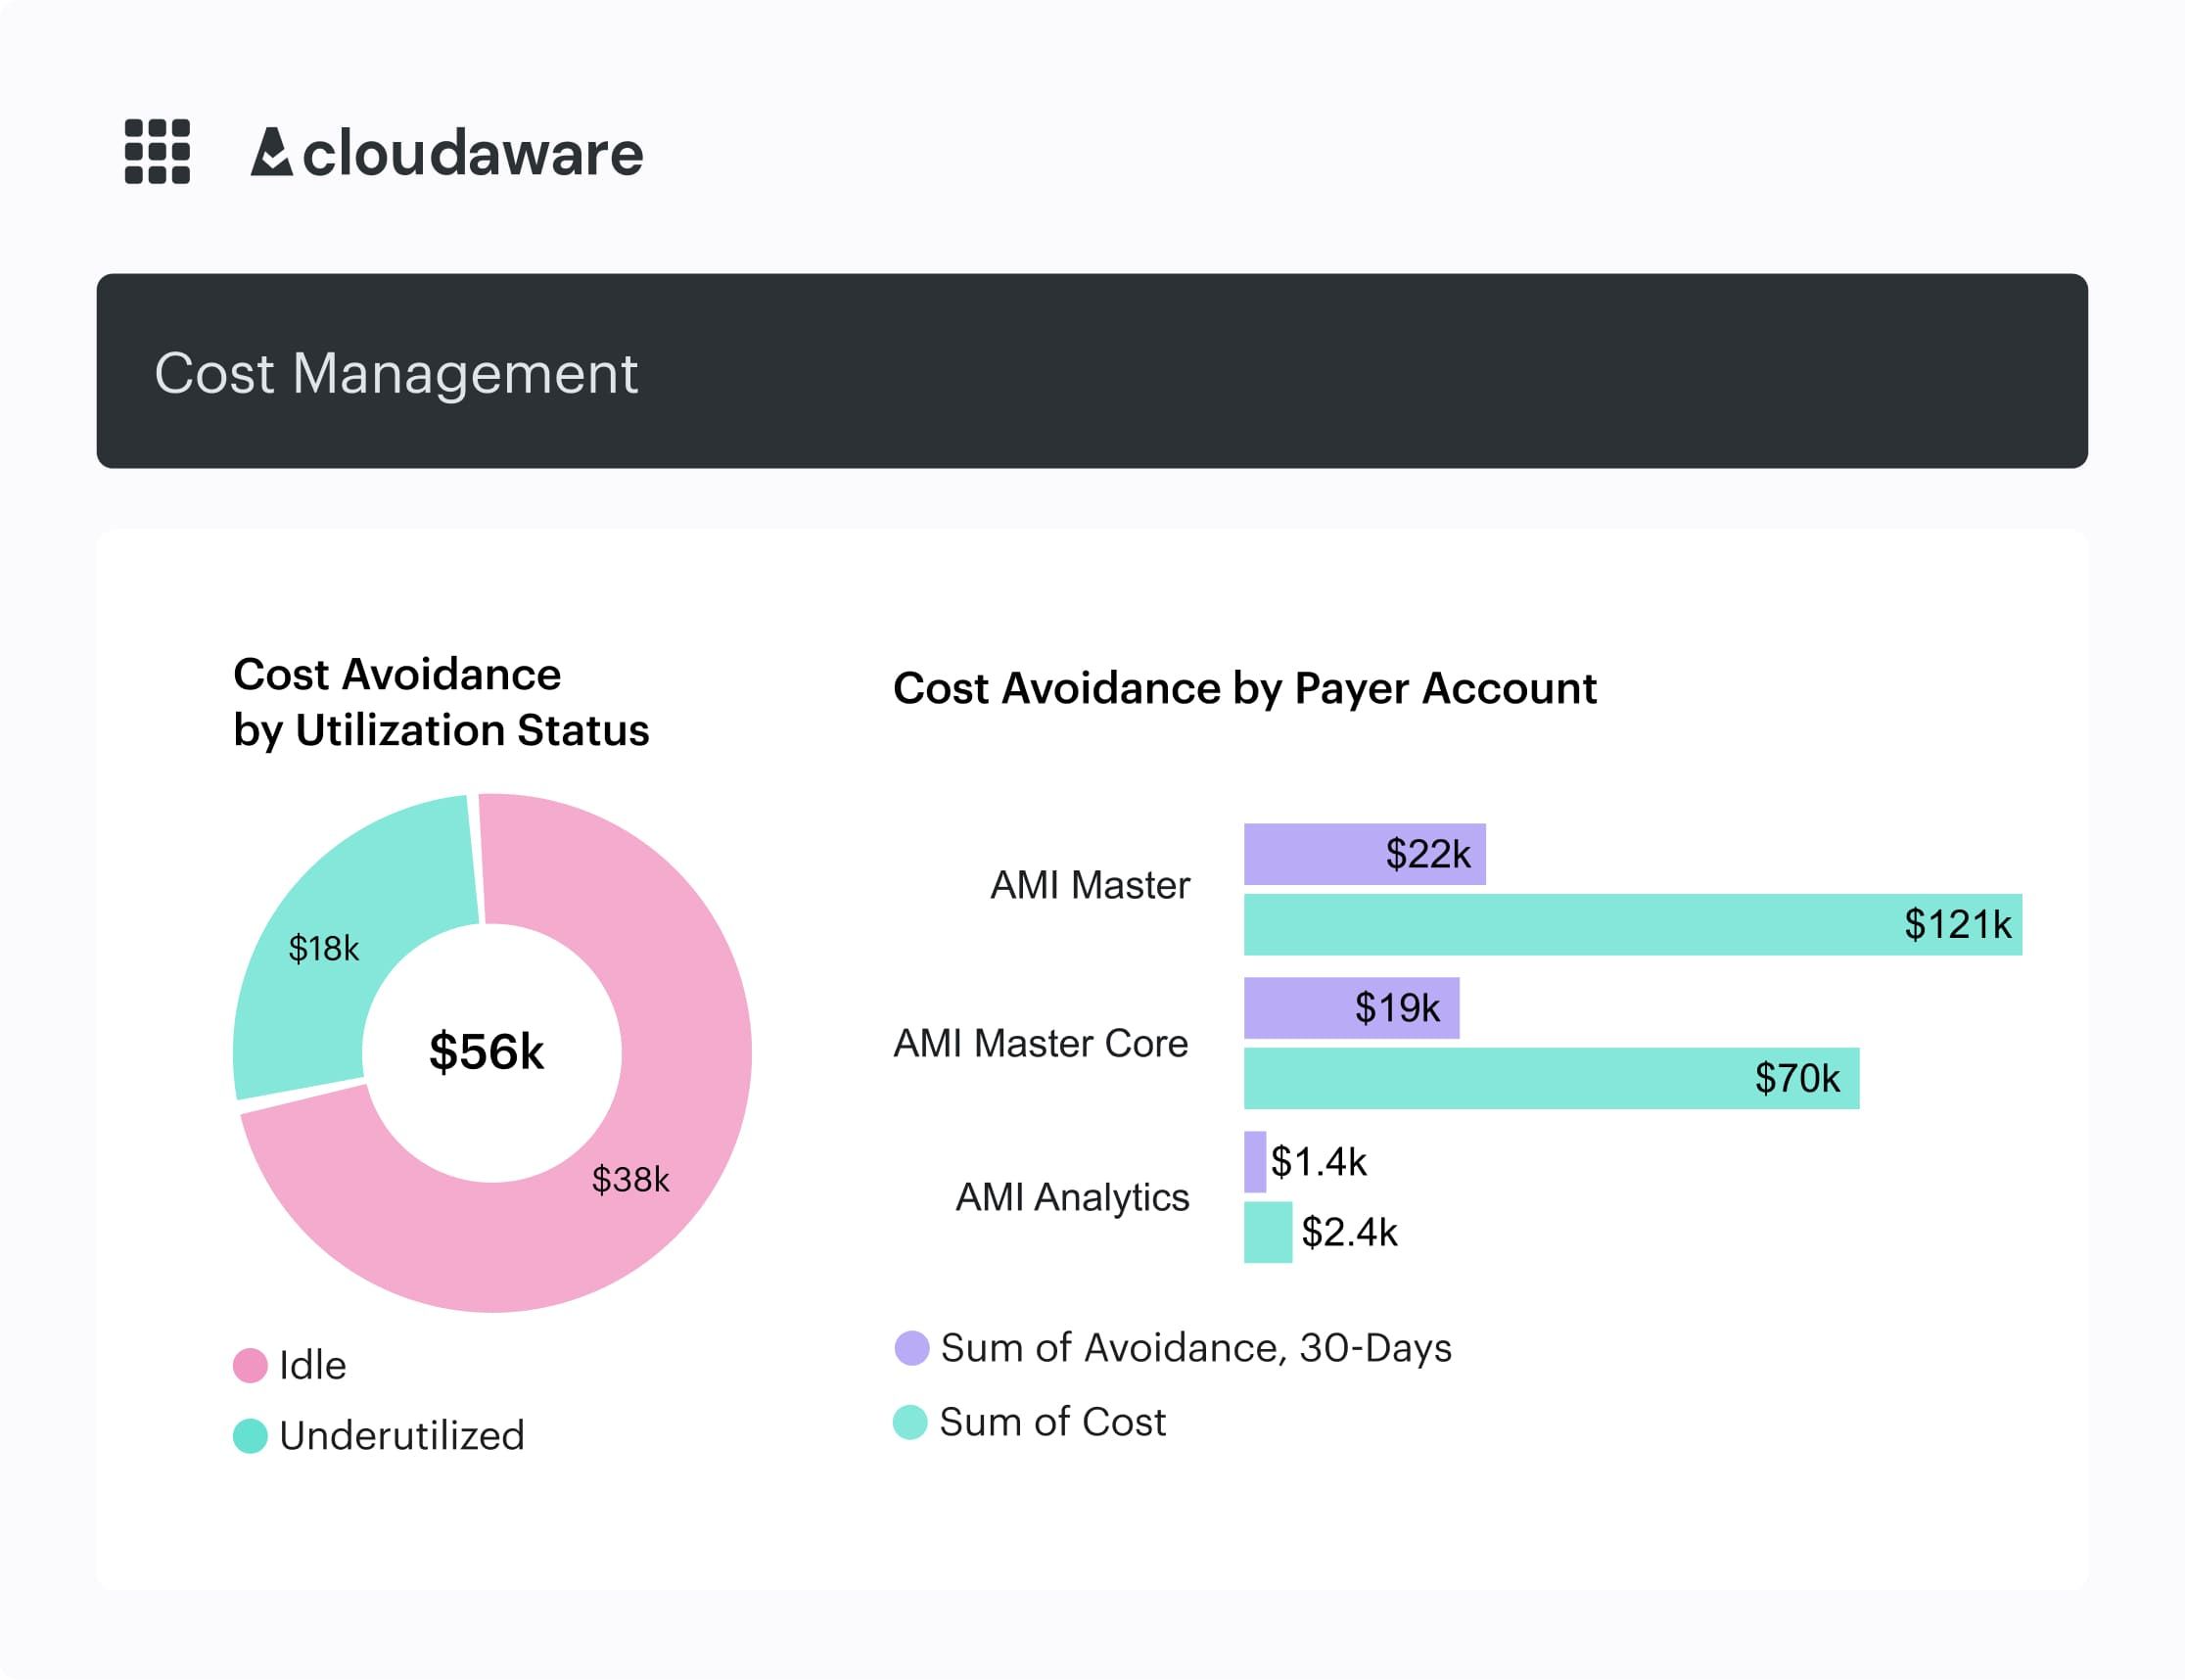
An element of the Cloudaware FinOps dashboard. Schedule demo to see it live.
This domain sharpens your reflexes. If you can’t measure cloud usage accurately, you can’t allocate, alert, or act. Start here, and everything else moves faster.
What to measure within this domain
| KPI | What it proves | Target | How to measure | Primary owner |
|---|---|---|---|---|
| Cost allocation coverage | You can reliably tie spend to app/team/env for showback, forecasting, and accountability | <80% → ≥80% → ≥90% | Allocated spend ÷ total spend (by day/week) | FinOps + Platform |
| Unallocated spend % | The size of your “unknown owner” bucket | >20% → ≤15% → ≤10% | (Total spend with missing ownership tags/CMDB mapping) ÷ total spend | FinOps |
| Tag conformance % | Tagging governance is enforceable, not aspirational | 70% → 85% → 95% | Resources with required tags ÷ total resources (by provider + CI type) | Platform + App owners |
| Billing data freshness | You can see problems while they’re still fixable | 48h → 24h → 6–12h | Timestamp of latest CUR/Export row processed vs now | Data/FinOps ops |
| Anomaly MTTD | You catch spikes before month-end surprises | 24h → 4h → 1h | First anomaly alert time minus spend inflection time | FinOps ops |
| K8s allocation coverage | Container spend is visible where teams actually work | 40% → 70% → 85% | Cluster costs split to namespace/workload via metrics + labels | Platform/SRE |
| Cost taxonomy completeness | You can benchmark and forecast by meaningful buckets, not raw SKUs | 60% → 80% → 90% | Spend mapped to normalized service/category hierarchy | FinOps |
Domain 2: Quantify business value
So, you’ve got your cloud usage normalized, tagged, enriched… the works. But now comes the real question: “Is this working?”
That’s what FinOps Domain 2: Performance Tracking and Benchmarking is all about. It’s where FinOps teams stop just reporting costs and start measuring progress. The goal here isn’t to say how much you spent — it’s to show whether that spend made sense, where it’s improving, and what’s holding you back.
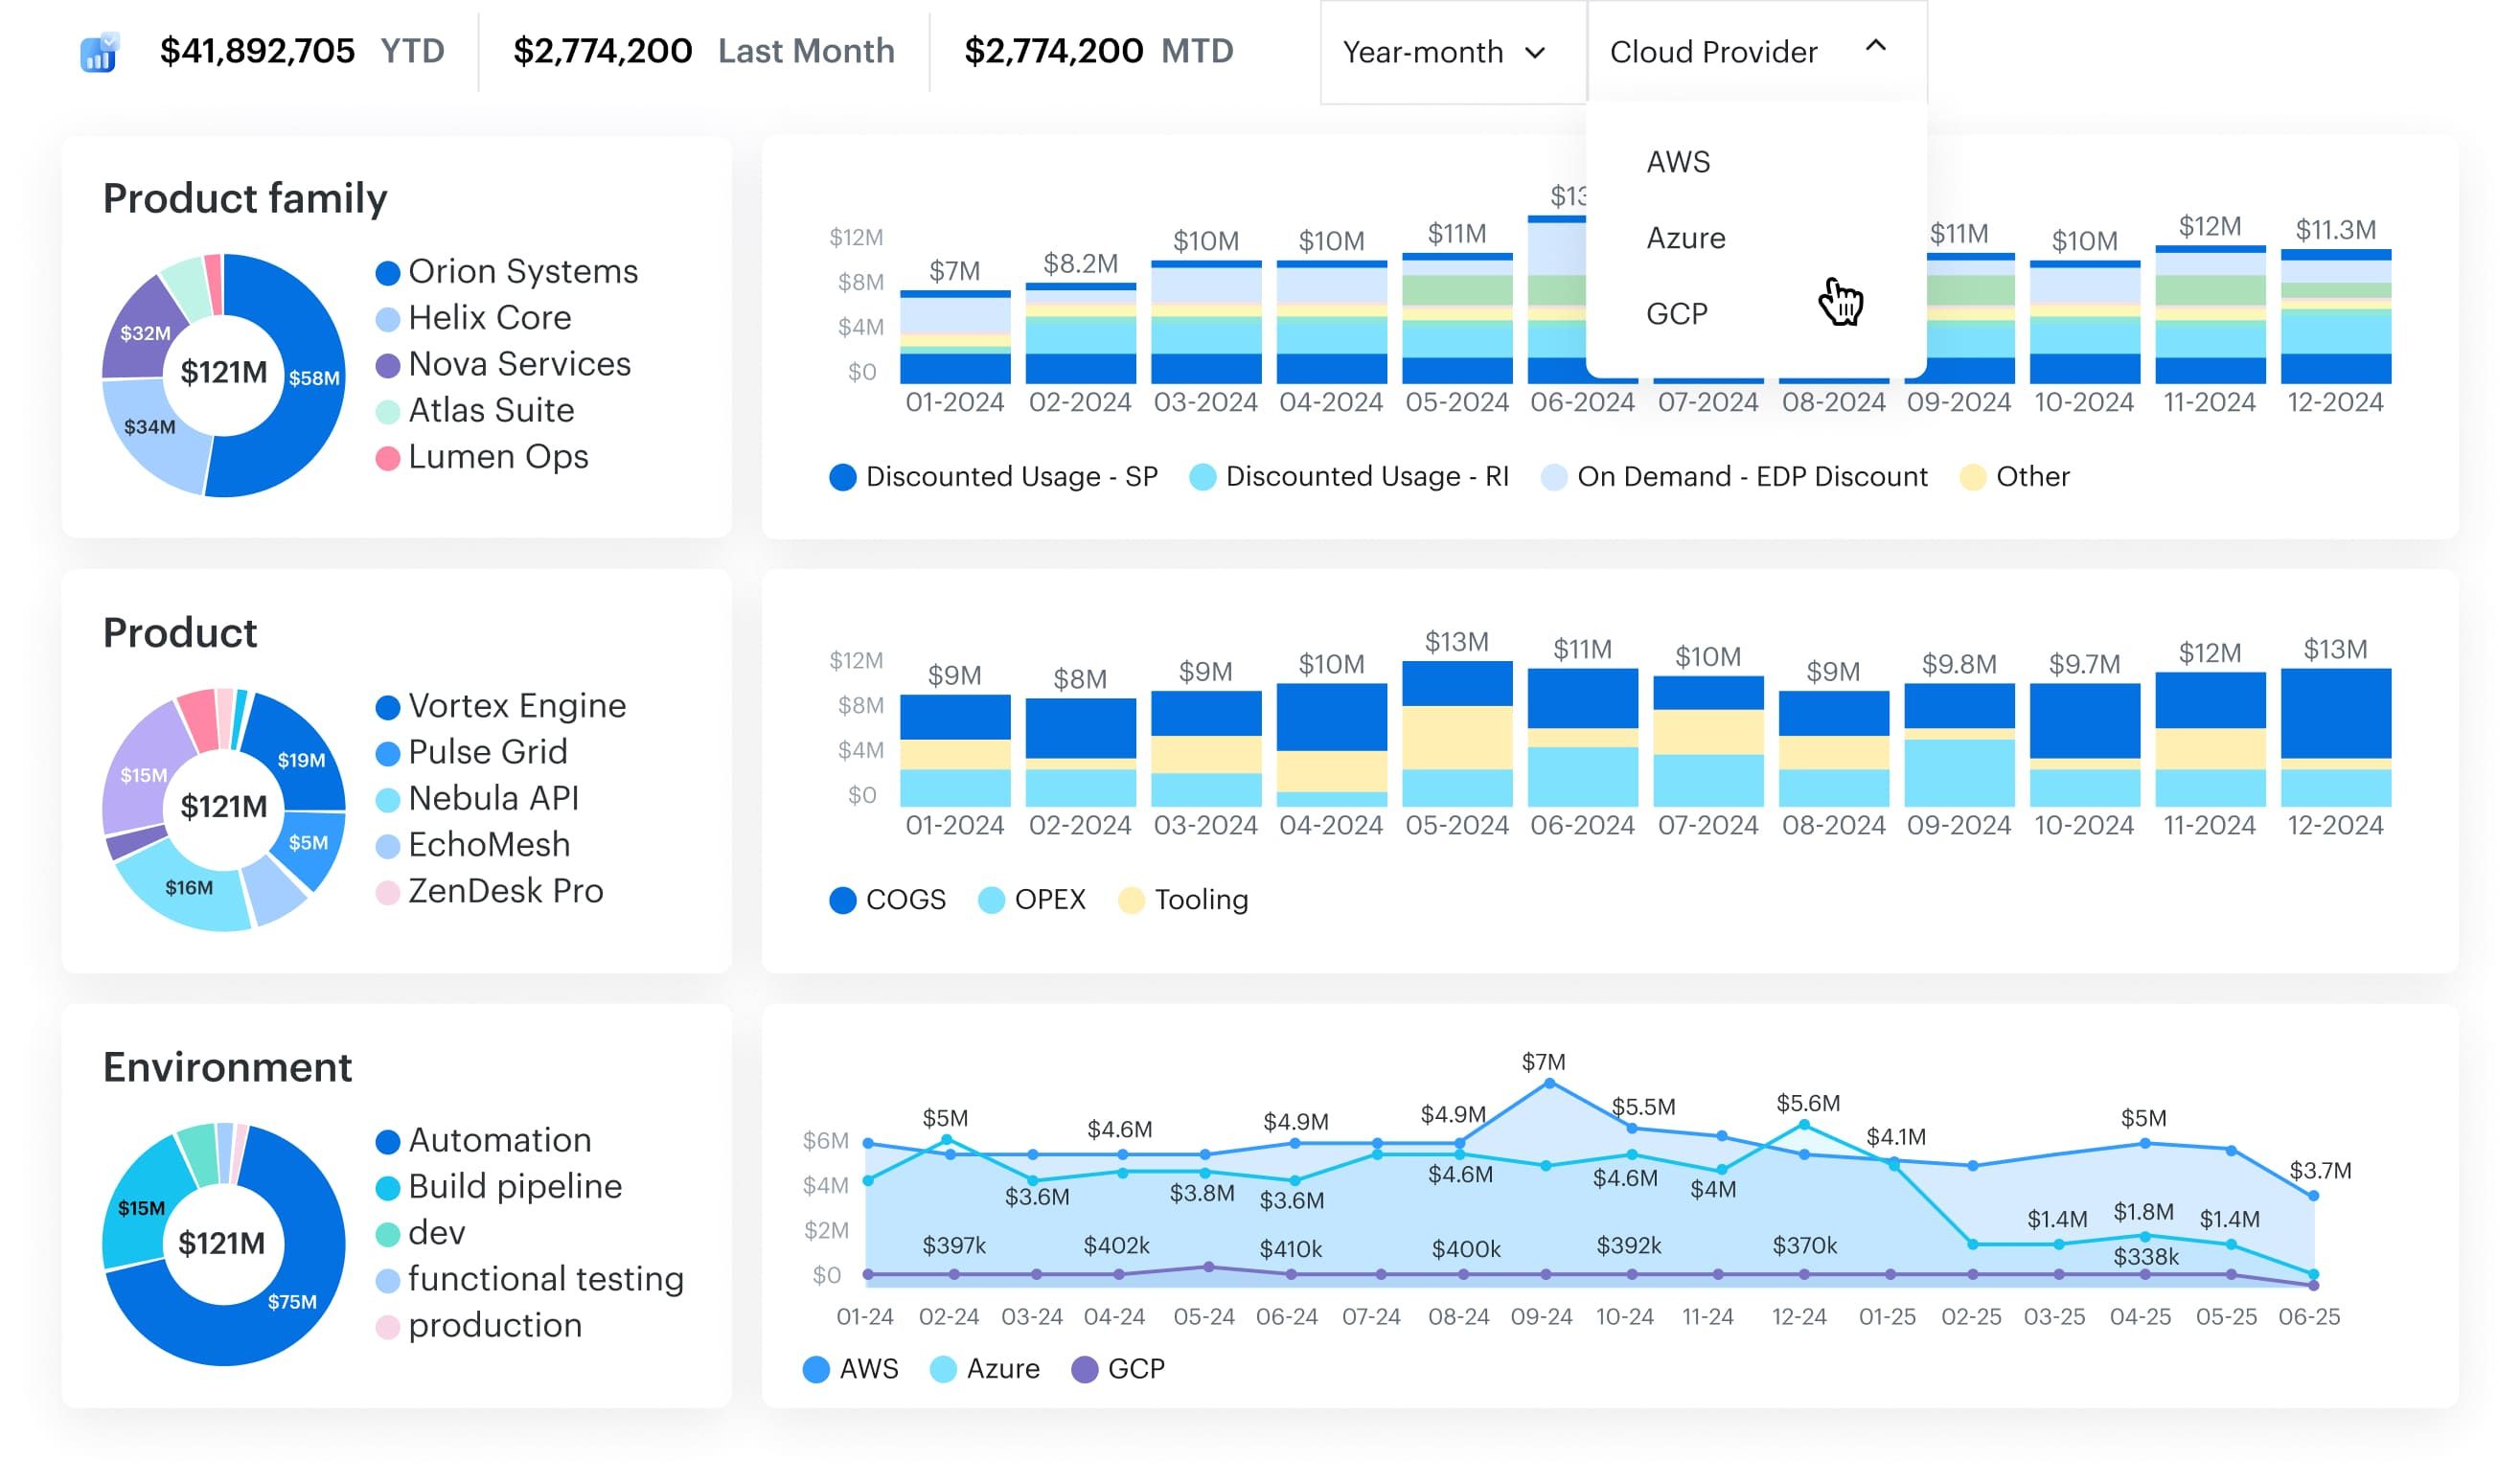
In this domain, your team builds a view that tracks cost and usage across every app, BU, and cloud, over time. You set KPIs — like cost per deployment, cost per user, or even cost per test run.
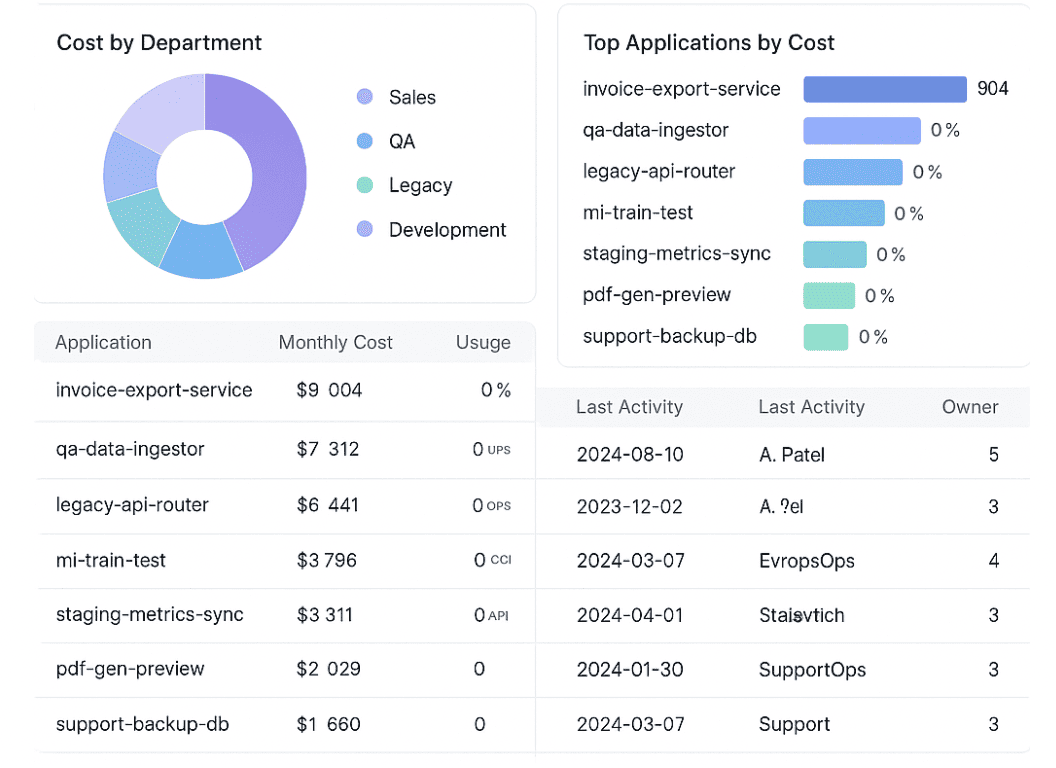
FinOps dashboard in Cloudaware. Schedule demo to see it live.
You monitor how those numbers move sprint over sprint. You benchmark internal teams against each other, or measure your own trend lines across quarters. You even map spend efficiency to real engineering metrics like RPS or latency SLAs.
Because when leadership asks, “Are we getting better at cloud?”, this is where your answer lives.
Some of the FinOps capabilities this domain relies on include:
- Tracking baseline KPIs and usage metrics over time
- Benchmarking teams, apps, and services by cost efficiency
- Aligning cost data with engineering and business KPIs
- Monitoring historical spend and usage to measure change
- Feeding insights back into commitment planning, showback, and roadmap reviews
This domain becomes your scoreboard. It’s how DevOps and Product leaders start to own their cloud outcomes — without waiting for Finance to tap them on the shoulder. And it connects directly to other domains FinOps teams work in, like Rightsizing or Forecasting. Because let’s be real — optimization without a benchmark is just guessing.
You’ll know this domain’s dialed in when your dashboards answer questions like
- Are we improving cost per user?
- Are our autoscaling policies actually reducing spend during off-peak hours?
- Which team leads in cost efficiency this quarter?
- How do we compare to last month — or last year?
- What’s our performance target, and are we closing the gap?
That’s the power of this domain. It turns cost into a metric that means something — to engineering, to product, to the business. And once you’ve got that? Everything else just clicks faster.
What to measure within this domain
| KPI | What it proves | Target | How to measure | Primary owner |
|---|---|---|---|---|
| Forecast variance (absolute % vs actual) | Finance can trust your numbers, and engineering can plan | ≤20% → ≤15% → ≤12% | forecast − actual | |
| Budget breach lead time (days of warning) | Budgets drive action before EOM, not post-mortems | 0–2 → 5–7 → 10–14 | First alert date when run-rate exceeds budget vs period end | FinOps ops |
| Unit economics coverage (% spend tied to a unit) | You can answer “what does 1 customer / 1 deploy / 1 inference cost?” | 20% → 50% → 70% | Spend mapped to unit drivers (requests, users, builds, GB processed) | FinOps + Product |
| Unit cost trend (MoM % change) | You’re improving efficiency, not just chasing savings | Track → -3% → -5% | Unit cost this month vs last month (by app/product) | Product + Engineering |
| Benchmark readiness (% top apps with baseline) | You can compare teams/services apples-to-apples | 30% → 60% → 80% | % of top spend apps with baseline KPIs + cost taxonomy | FinOps |
| Showback adoption (% teams reviewing monthly) | Cost becomes a normal engineering signal | 25% → 60% → 85% | Attendance/acknowledgement logged per BU/app review | FinOps lead |
| Decision traceability (% major cost decisions with notes/links) | Optimization is repeatable, not tribal knowledge | 10% → 50% → 80% | % of commitments/rightsizing changes linked to Jira/Confluence record | FinOps + Eng leads |
Read also: How Cloud Experts Use 6 FinOps Principles to Optimize Costs
Domain 3: Optimize usage & cost
You know that moment in your monthly cost review when someone says, “Wait, we’re still paying on-demand for that?” Yeah, this domain is how you stop that from happening again.
Cloud Rate Optimization is the part of the FinOps framework where you make smarter decisions about how you buy cloud. It’s not about using less — it’s about paying less for what you’re already using. Reserved Instances, Savings Plans, committed use discounts, custom pricing agreements — you know the drill.
Here is one of dashboards teams use at this domain:
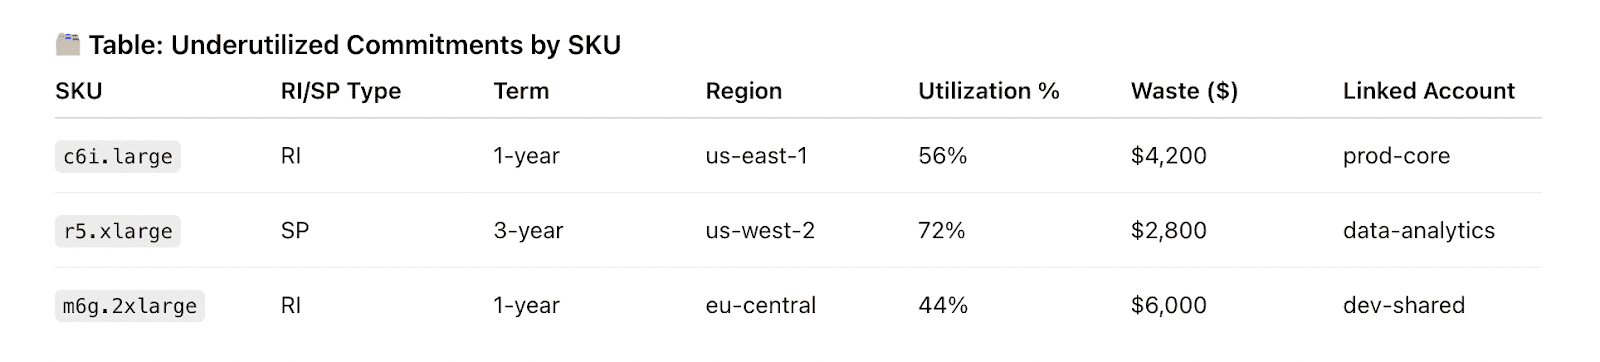
Element of the Cloudaware FinOps report about RI utilization. See it live
This domain turns all of that into a system.
So what do FinOps teams actually do here?
They:
- Analyze historical usage patterns (across AWS, Azure, GCP, you name it).
- Identify which workloads are steady enough to commit — like dev test clusters, nightly batch jobs, or production DBs.
- Run scenario modeling — "What if we lock 70% of compute for 12 months?"
- Work with Procurement to negotiate custom rates.
- Align commitment planning with sprint planning and release cadences.
- And continuously recheck coverage to avoid overcommitments or missed savings.
It’s not just spreadsheets and gut calls — it’s data-backed commitment strategy tied to actual usage patterns and org priorities.
Here are the FinOps capabilities that sit inside this domain:
- Track rate coverage across all major cloud providers.
- Model and forecast commitment opportunities (RI/SP/CUDs).
- Automate purchase recommendations based on thresholds.
- Collaborate with Finance and Procurement for custom agreements.
- Align commitment planning windows with Engineering and Product timelines.
Why it matters?
Because every percentage point of coverage = real cost optimization without rewriting a single line of code. This domain brings predictability into your cloud spend — so you’re not just reacting to usage, you’re planning for it. It also strengthens cross-team alignment: Product sees the financial upside, Finance sees the risk modeled out, and Engineering gets a seat at the table to define timing and capacity buffers.
And here’s the kicker: this domain feeds directly into Budgeting, Forecasting, and Chargeback. Once your rate strategy is dialed in, everything else gets sharper.
Here’s what you’ll finally be able to answer when you’ve matured this part of the framework:
- What’s our RI/SP/CUD coverage today — and what’s our target?
- Which workloads are good candidates for 1-year vs. 3-year commitments?
- Are we aligned on timing between engineering scale-up and rate lock-ins?
- Did our last negotiation move the needle on effective rates?
- How are we tracking committed vs. actual usage, by team or BU?
This domain isn’t about one big decision — it’s about hundreds of micro-optimizations stitched together into a savings engine. And when your capabilities here mature? That engine runs smooth, fast, and quietly in the background.
Read also: Cloud Cost Optimization Framework - 11 Steps to reducing spend in 2026
Okay, so you’ve got your rates locked down. But now it’s time to look at what you’re actually running. Because cloud usage isn’t always rational — it grows fast, and nobody’s pausing to ask if that idle RDS instance from three sprints ago is still doing anything.
Cloud Usage Optimization is where your FinOps strategy goes hands-on. This domain is all about identifying waste, validating sizing decisions, and making sure every resource running in your environment has a reason to exist — and the right size to do it.
Here is one of the dashboards teams use here:
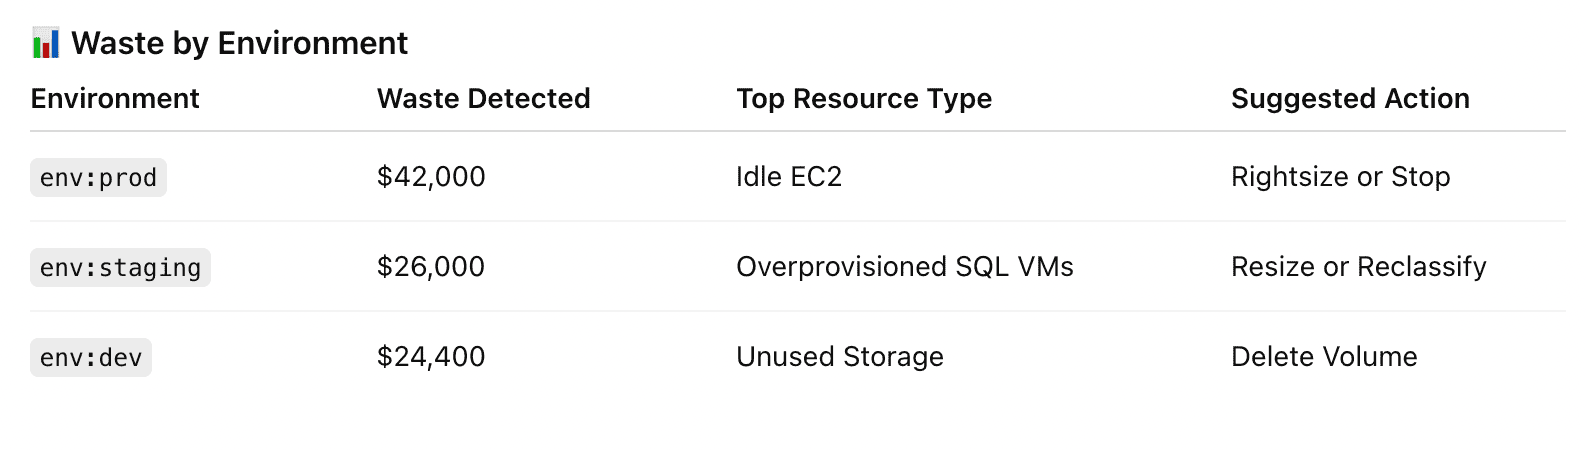
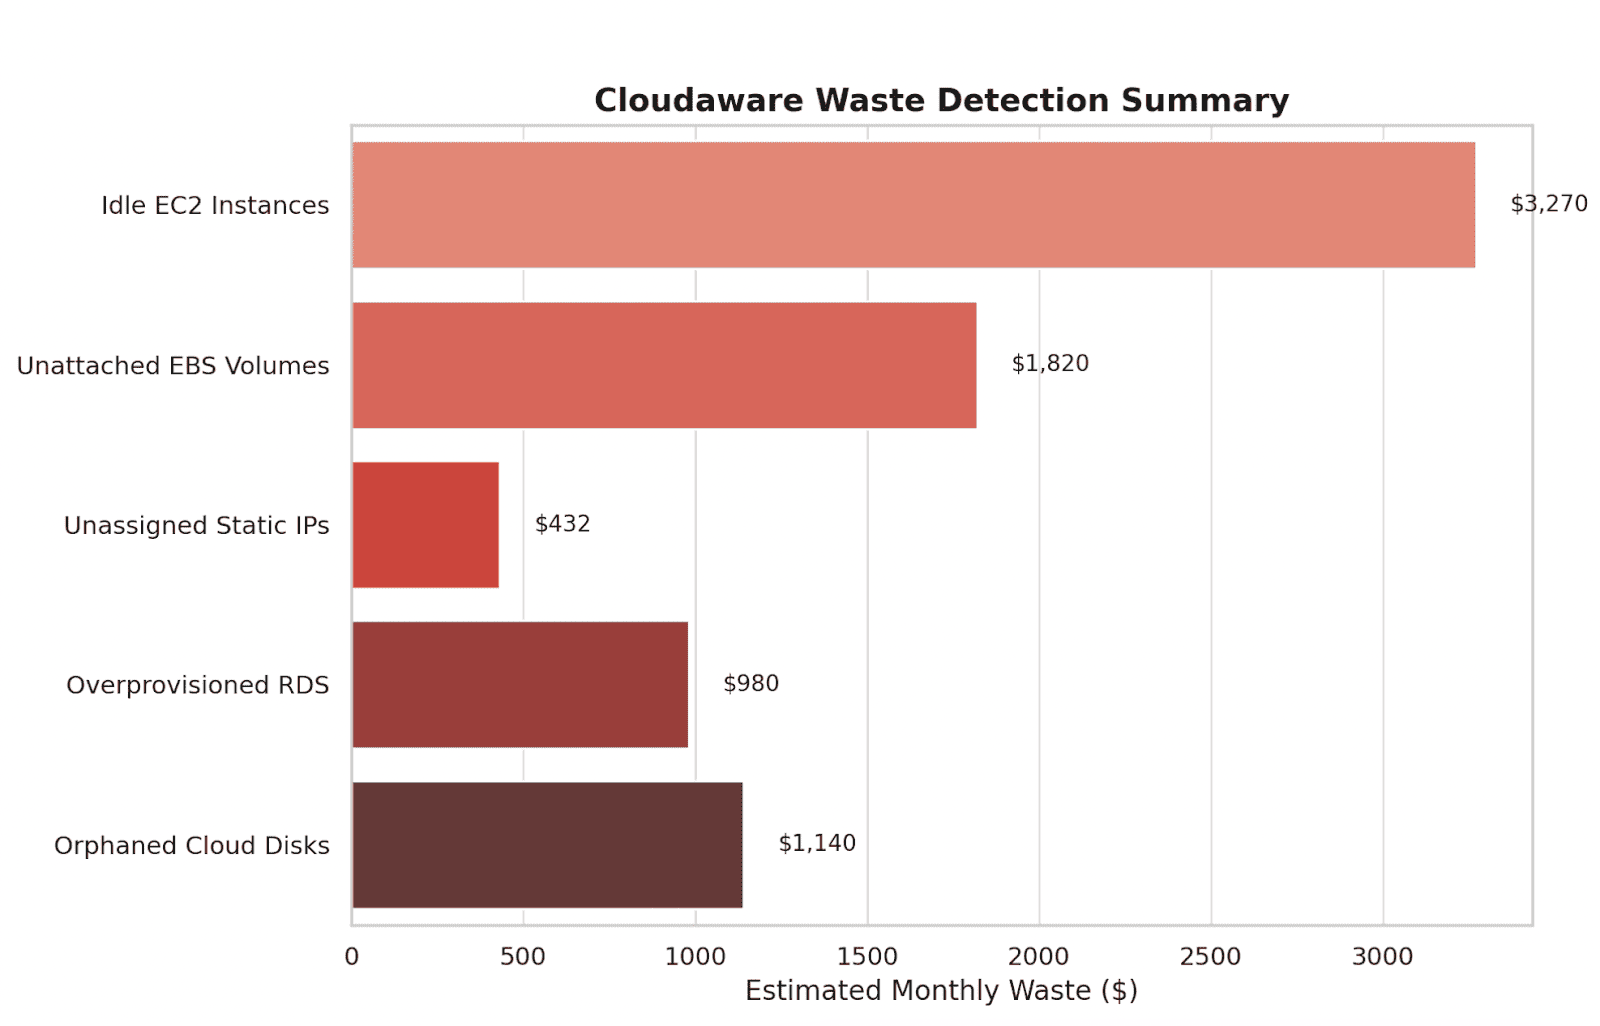
Element of the Cloudaware FinOps report. See it live
So what does the team actually do here?
They:
- Scan for idle resources: unattached volumes, stopped VMs, overprovisioned Kubernetes workloads.
- Analyze p95 usage to validate sizing — across compute, storage, databases, and even containers.
- Connect app performance metrics to infra footprint — so nobody breaks latency chasing savings.
- Push clean recommendations into backlogs, pre-tagged and prioritized.
- Close the loop — tracking if actions were taken, how much was saved, and what didn’t get touched.
Here are the FinOps capabilities you’ll need in this domain:
- Identify and classify underutilized cloud resources.
- Analyze right-sizing opportunities using historical metrics (p95/p99, etc.)
- Integrate optimization tasks into Engineering’s backlog or ticketing system.
- Track accepted vs. ignored recommendations and measure savings outcomes.
- Tie usage patterns to business context using metadata (app, env, owner, BU).
Why this domain matters?
Because wasted usage = burned budget. It’s the most visible symptom of low FinOps maturity — and also one of the easiest to improve. This domain builds trust with Engineering when recommendations come with context and performance impact. And it closes the loop on anomalies, performance tracking, and commitment planning.
When cost optimization is a shared goal, this domain is where it becomes visible, collaborative, and measurable.
Here’s what this domain helps you answer — day in, day out:
- What are our top 10 waste candidates this week — by $ impact?
- Which recommendations did we actually implement last sprint?
- Are our workloads still rightsized based on last 14 days of usage?
- Is anyone tracking VM sprawl in dev/staging?
- Where are we overpaying for performance nobody’s using?
This isn’t just cleanup. It’s discipline. Mature FinOps capabilities here mean your cloud isn’t just cost-efficient — it’s clean, responsive, and aligned with how your teams build.
What to measure within this domain
| KPI | What it proves | Target | How to measure | Primary owner |
|---|---|---|---|---|
| Commitment coverage | You’re not overpaying on steady workloads | 40% → 60–75% → ~80% | Covered usage cost ÷ eligible on-demand cost (by family/region) | FinOps + Procurement |
| Commitment utilization % | You’re not buying discounts you can’t use | 70% → 85% → 95% | Used commitment hours/cost ÷ purchased commitment | FinOps |
| Effective Savings Rate (ESR) | Your discount strategy is actually producing savings | Track → +2–5 pts → +5–10 pts | (On-demand baseline − effective cost) ÷ baseline | FinOps |
| Rightsizing execution rate (% actions completed) | Recommendations are turning into shipped changes | 10% → 35% → 60% | Closed tickets ÷ recommended tickets (per sprint/month) | Eng managers |
| Savings realized vs identified % | You’re converting opportunity into dollars, not a backlog | 15% → 40% → 60% | Realized savings ÷ identified savings (same time window) | FinOps + Eng |
| Idle spend % | You’re killing the obvious waste fast | 10% → 5% → 2–3% | Spend on idle/stopped/unused resources ÷ total spend | Platform + App owners |
| K8s request-to-usage ratio (p95) | Containers aren’t inflated “just in case” | Track → ≤2.0 → ≤1.5 | p95 requested CPU/mem vs p95 actual usage | SRE/Platform |
Read also: How Experts Are Navigating the FinOps Lifecycle in 2025
Domain 4: Manage the FinOps practice
No matter how tight your scripts are, your cloud cost strategy will never scale without cross-org buy-in. That’s what this domain is about: getting everyone on the same FinOps page so decisions actually stick.
Organizational Alignment is where you stop firefighting alone and start building shared understanding between Finance, Engineering, Product, and Procurement. It’s the domain where business decisions are shaped by real-time cloud cost data — and the teams closest to that data feel empowered (and expected) to act on it.
What actually happens here?
FinOps leads set up rhythms — weekly variance reviews, monthly forecast vs. actual retros, QBRs with engineering. They:
- Create personas and RACI charts so every team knows their ownership boundaries.
- Surface cost-to-business-value metrics for Product — cost per test, per customer, per release.
- Build trust between Fin and Eng by aligning incentives and showing where trade-offs land.
- Document decision logic so commitments, chargebacks, and anomaly thresholds don’t live in someone’s head.
The capabilities this domain unlocks include:
- Define FinOps roles and responsibilities across teams.
- Build cross-functional workflows (e.g. for commitment planning or anomaly review).
- Translate cloud cost into product and business KPIs.
- Align teams on cadence and governance rhythms.
- Enable shared accountability with transparent, role-specific reporting.
Why it matters?
Because organizations don’t fail at cloud FinOps because of tooling — they stall when people aren’t aligned. This domain gives your platform strategy teeth. It ensures that tagging isn’t just a checkbox, but an input to real decisions. That alerts don’t just fire, but hit someone who’s accountable. That finance doesn’t chase answers in silence while devs deploy without context.
And this domain directly reinforces every other domain — especially Real-Time Decision Making, Budgeting, and Chargeback — because none of those run smoothly without alignment.
Daily questions this domain helps you answer:
- Who’s responsible for this cost increase — and do they know it?
- Does Finance trust the forecast, or are they redoing it manually?
- Do engineers see cost alongside performance metrics in their tools?
- Are product teams aware of the cost impact of new features?
- Who owns anomaly resolution in shared environments?
What to measure within this domain
| KPI | What it proves | Target | How to measure (practical) | Primary owner |
|---|---|---|---|---|
| Ownership routing coverage | Work lands on a human who can act | 40% → | ||
| 75% → | ||||
| 90% | Alerts/tickets with owner_email/team mapped ÷ total | FinOps ops | ||
| Anomaly action rate | Signals become decisions, not noise | 20% → | ||
| 60% → 80% | Jira/SNow created from anomaly ÷ anomalies detected | FinOps lead | ||
| MTTR for cost issues | The org can respond, not just observe | Days → | ||
| <24h → <4h | Ticket lifecycle timestamps | Eng owners | ||
| Governance cadence adherence | FinOps runs on rhythm, not heroics | 50% → | ||
| 80% → 95% | # planned reviews held ÷ # scheduled | FinOps lead | ||
| Policy enforcement coverage | Standards are enforceable at scale | 20% → | ||
| 60% → 85% | % of resources/accounts under required controls | Platform + Security | ||
| Exception hygiene | You don’t create permanent loopholes | 30% → | ||
| 70% → 95% | Exceptions with expiry date + owner ÷ all exceptions | FinOps + SecOps | ||
| Stakeholder enablement | Teams understand the rules and metrics | 25% → | ||
| 60% → 85% | Completion rate for onboarding/training per persona | FinOps |
Cross-domain KPI pack: The metrics that actually matter
These aren’t vanity metrics. Every KPI in this pack maps to real FinOps workflows. If it doesn’t drive action, it’s just noise. This set helps teams run weekly reviews, validate budgets, justify optimizations in QBRs, and prove impact to leadership.
Whether you’re tracking these KPIs in Cloudaware, exporting to Excel for Finance, or piping into Slack for dev teams, the goal is the same: connect insights to outcomes across every FinOps domain.
Core KPIs to Track Across Domains:
| KPI | What It Tells You | Where to Use It | Benchmarks / Notes |
|---|---|---|---|
| MTTD (Mean Time to Detect) | How fast your platform detects a cost anomaly | Anomaly Detection, Real-Time Decision Making | <60 min = best-in-class. Pulled from alert vs. spend spike timestamps |
| MTTR (Mean Time to Resolve) | Time between alert and resolution | Usage Optimization, Accountability | <4 hrs is strong. Track via Jira/SNow ticket lifecycle |
| % RI/SP/CUD Coverage | Share of spend covered by commitments | Cloud Rate Optimization, Forecasting | 60–85% is healthy depending on workload type |
| % of Unallocated Spend | Cost that can’t be tied to an owner or app | Allocation, Budgeting, Chargeback | Target: <10%. Requires clean tagging + CMDB mapping |
| Savings Realized vs. Identified | $ saved vs. what was recommended | Usage Optimization, Decision Follow-through | Aim to close ≥50% of backlog savings |
| % Anomalies Converted to Action | Share of alerts turned into backlog tasks | Real-Time Decision Making, Organizational Alignment | Target: 70–90%. Low % = action gap |
| Forecast Accuracy (± % Variance) | Deviation from actual spend | Budget Management, Finance Confidence | <15% variance = solid alignment |
| Tag Conformance % | % of cloud resources with required tags | All Domains | Goal: 90%+. Use automated tag scans |
| KPI Breakdown by Owner/BU | Who’s overspending, improving, or needs help | Organizational Alignment, Reporting | Compare KPI performance by app/team/env |
| Avoided Cost from Optimization | Money not spent due to action taken | Value Tracking, Executive Reporting | Calculate using historical spend trends vs. actual |
5 Common anti-patterns by domain (and best practices of their fix)
“They track cloud usage... but not decisions tied to it”
Kristina S., Senior Technical Account Manager at Cloudaware:
“In the Understanding Usage & Cost domain, teams often stop at reporting. You’ve got the dashboard. You’ve got the spend. But no one’s logging what happened next. Did that spike lead to a rightsizing ticket? Did someone take action?
To make this FinOps practice effective, you need to connect the dots. That’s why we push for traceability. In Cloudaware, usage data gets linked to downstream workflows in Jira or ServiceNow — so you can see the full path from anomaly → investigation → fix → savings. Otherwise, it’s just another chart no one owns.”
“They set budgets... then ignore them until the month ends”
Mikhail Malamud, Cloudaware GM:
“One of the most common anti-patterns in Budget Management is treating budgets like static spreadsheets — set it and forget it. But cloud spend shifts daily. And if you're only looking at variances in a monthly report, you’ve already lost the chance to fix it.
In Cloudaware, we help teams set dynamic thresholds per service, app, or BU. Think: budget tracking at the tag or environment level. Then the system watches it 24/7 and pushes alerts into Slack, Jira, or email the moment a breach is detected — no lag, no guesswork.
That gives Finance early signal. It gives Engineering time to act. And it turns budget tracking into a real-time cost management process, not a post-mortem.”
“They surface anomalies… but nobody owns the fix”
Anna, ITAM expert:
“In the Anomaly Detection domain, the cost data’s there, the alert fired, but then… silence. No ticket, no owner, just a spike sitting in a shared inbox. That’s where the loop breaks — and that’s why MTTR stays high.
At Cloudaware, we route every cost anomaly through the CMDB. That means each alert includes exact app name, environment, and owner_email. If it’s a GKE spike in payments-prod, it lands straight with the right DevOps lead — no triage needed.
You can even pre-label anomalies with cost impact and RCA context — so the owner knows whether it’s noise or needs action. That single step of ownership mapping slashes response time and prevents repeat misses.”
Read also: Augmented FinOps: How the Best Teams Scale with Automation
“Commitment planning happens in a vacuum”
Daria, our ITAM who lives in FinOps dashboards:
“One of the biggest breakdowns we see in Cloud Rate Optimization is this: Finance buys Reserved Instances or Savings Plans based on last month’s spend, but Engineering never even sees the plan. That disconnect leads to underutilized commitments — or missed savings altogether.
In Cloudaware, we embed SP/RI recommendations directly into Engineering’s sprint planning. The system links usage trends to actual services and environments, then surfaces right-sized commitment opportunities right where devs work — like Jira or Slack.
That way, commitment decisions aren’t guesses — they’re backed by live usage and made collaboratively. And when everyone sees the forecasted savings, they actually act on it.”
“Rightsizing dashboards are full… but the backlog is empty”
Mikhail Malamud, Cloudaware GM:
“In the Cloud Usage Optimization domain, teams often do the analysis — tons of over-provisioned EC2s, idle Azure VMs, bloated Kubernetes limits. But unless those insights hit the backlog, nothing changes.
At Cloudaware, every rightsizing candidate comes with a confidence score, dollar impact, and performance safety check. We tag them by app, environment, and team, then convert the top picks straight into Jira tickets via pre-built flows.
That’s how you turn noise into action. Engineering gets clean, groomable backlog items tied to real savings. And Finance finally sees those dashboards drive actual outcomes — not just shelfware.”
These use cases show up everywhere. But with the FinOps best practices like right management structure and tooling, you can shift from firefighting to proactive control. The FinOps domains aren’t just theory — they’re how high-performing teams scale financial decisions with speed and precision.
How Cloudaware closes the FinOps gaps
Juggling FinOps across AWS, Azure, GCP (and maybe even Oracle or Alibaba) with 200+ accounts, multiple BUs, and zero shared context? That’s where most domain organizations slip into anti-pattern chaos. Dashboards nobody owns. Budgets ignored until EOM. Commitments made in isolation. Sound familiar?
That’s exactly the kind of mess Cloudaware was built to clean up.
As a unified FinOps management platform, Cloudaware ties your FinOps domains and capabilities into a single, versioned control plane. No scattered data. No rogue workflows. Just clean pipelines from cost signal → decision → owner → fix.
Here’s how it supports you:
- Normalizes billing data across AWS, Azure, GCP, Oracle, and Alibaba.
- Automatically fixes broken, missing, or inconsistent tags — and enriches everything with CMDB context (app, env, team, owner_email).
- Maps every resource to the right business service or product line.
- Detects anomalies by confidence level and business impact.
- Pushes budget and anomaly alerts to Jira, Slack, or ServiceNow in real time.
- Tracks financial KPIs like MTTD, MTTR, cost avoidance, and % actioned.
- Supports every major FinOps domain: from forecasting and allocation to chargeback and sustainability.
Every feature is built to close the loop — from usage to action. So if your org is stuck somewhere between insight and ownership, or you’re just tired of chasing spreadsheets… maybe it’s time we talked.