


By 2026, cloud complexity has outpaced visibility. What started as a move toward flexibility now leaves most teams struggling to answer a simple question: where exactly is the money going?
AWS, Azure, and GCP each produce their own billing exports; VMware clusters and on-prem environments run on different accounting models; SaaS costs live in yet another spreadsheet. Engineers face questions finance can’t answer, and finance asks for numbers engineers can’t yet measure.
This guide walks through how to instrument, measure, and manage hybrid cloud cost across cloud and on-prem environments. It’s a practical approach built on CMDB context, ownership mapping, and policy-driven governance — not just to control spend, but to uncover where value is created and where it quietly disappears.
Step 1. Understand what hybrid cloud cost really is
Before we dive into tools and tactics, let’s align on what hybrid cost really means. Before dashboards you need a cost model that reflects how your infrastructure actually behaves.
Traditional cloud reports assume everything comes from one provider and one billing API.
Hybrid estates don’t work that way. You may have AWS CUR exports, Azure EA data, and VMware or bare-metal usage reports — none of which share tags, currencies, or timing. Without a unified baseline, you’ll never see a single number of truth.
Start by defining what belongs in hybrid cloud cost management:
- Direct spend: cloud invoices, SaaS subscriptions, colocation fees.
- Allocated on-prem cost: power, rack space, hardware depreciation, hypervisor licensing.
- Shared overhead: network transit, monitoring, ITSM tooling, and people time.
If you skip this step, every dashboard you build later will show the wrong story. Normalize all incoming data to common units — vCPU-hour, GB-month, TB transferred.
At this stage, don’t chase optimization yet. Build a normalized cost dataset that merges invoices, CMDB metadata, and capacity metrics. Once you can trust the totals, every later FinOps action starts making sense.
Read also: 12 FinOps Use Cases + Solutions for Multi-Cloud Spend
Step 2. Identify the real cost drivers in 2026
Most hybrid environments hide their real cost drivers in plain sight. It’s rarely one big mistake — it’s a mix of small leaks that add up over time.
As a FinOps professional wrote on Reddit:

That line sums up hybrid FinOps better than most whitepapers. The job isn’t just to collect bills but to know which workloads belong where and what makes each expensive.
1. Elasticity vs stability
Pull utilization metrics for your top ten accounts or cost centers. If a system runs at 70% CPU for 30 days straight, it’s paying public-cloud prices for on-prem behavior. Those workloads are good candidates for reserved instances or internal clusters.
2. Data movement and egress
List your largest inter-region and cross-provider transfers. If AWS traffic keeps flowing to a SaaS service hosted in Azure, you’re burning cash on data gravity. Tag those flows to the owning application in ServiceNow or your CMDB. Once ownership is visible, the waste becomes obvious.
3. Operational overhead
Time isn’t free. Pull work-log data from Jira or ServiceNow — patching, maintenance, backup rotations. Multiply by average hourly cost. That’s real hybrid cloud cost, not “support overhead.”
4. Duplicate tooling
Check your subscriptions for monitoring, backup, and security. If you’re paying for Datadog in cloud and SolarWinds on-prem, that’s 10–15% of your total IT budget doing the same job twice. Pick one or federate.
Cloudaware Insight:
Across Cloudaware-managed hybrid environments, duplicate-tool and unallocated spend often make up 12-18% of total cost. Cleaning up ownership and tagging typically reduces this by half within one quarter.
Read also: Cloud Cost Optimization: The Complete 2026 FinOps Guide
Step 3. Build end-to-end cost visibility
A dashboard full of charts isn’t cost visibility if you can’t tell who owns what or why the spend exists.
Hybrid estates make that even harder: each provider exports billing differently, on-prem data often lives in spreadsheets, and ownership metadata rarely aligns across systems.
A functional visibility layer has four moving parts:
- Connectors: pull usage and billing from every cloud provider, virtualization stack, and SaaS service.
- CMDB integration: normalize those records and attach each resource to an owner, application, or business unit.
- Tagging policies: enforce consistent metadata so new resources automatically land in the right cost center.
- Governance hooks: detect untagged or orphaned assets before they hit the invoice.
Cloudaware’s role:
The platform pulls billing data from AWS, Azure, GCP, and on-prem systems and ties it to CMDB ownership. FinOps teams can finally see every VM, bucket, and license linked to a real owner and business service, with daily updates instead of end-of-month reports.
Read also: AWS Cloud Cost Management: A Practical Guide
Step 4. Allocate costs by ownership and service
We all eventually hit the same wall: finance wants numbers by team or product, but the cost data arrives by provider and account. The only way to close that gap is proper cost allocation.
Getting ownership right
Start with your CMDB or inventory. Every resource needs an owner, cost center, and application tag — without that, no allocation model will ever hold up. Even though this step sounds obvious, but it’s where most teams fail.
There’s no single model that fits everyone:
- Tag-based allocation. Works best for cloud-native environments where pipelines enforce tags automatically.
- CMDB-based allocation. Best for hybrid environments. It uses CMDB relationships to map resources to the applications or teams that own them. Ownership is assigned through automatic resource discovery, integrations, or relationship lookups (for example, Cloudaware).
- Hybrid rule-based allocation. What most enterprises end up using. Tags handle dynamic workloads; CMDB covers persistent systems and shared services.

Element of the Cloudaware report of spent allocation history. Schedule a demo to see it live
Once ownership is established, your data starts to mean something. You can finally see who owns what — and which budgets keep bleeding.
Making allocation repeatable
Start with clear recovery and chargeback logic:
- Network and security services: split by consumed bandwidth or device count.
- Central tools (monitoring, CI/CD, ITSM): allocate by active users, ticket volume, or API calls.
- Cross-team projects: apply proportional weighting agreed with finance; consistency matters more than precision.
Next, every allocation model must also be auditable. Each rule should trace back to a real data source — a tag field, CMDB attribute, or usage metric — so that when auditors ask how costs were distributed, you can replay the exact logic without guesswork.
Finally, automation keeps it alive. Nightly checks should flag any new resources missing tags or CMDB links; those findings can flow automatically into Jira or ServiceNow, creating tickets instead of month-end surprises.
Once that loop is closed, ownership and cost stay aligned even as the environment keeps changing.
Read also: Caterpillar Case Study. Learn how they implemented Cloudaware’s CMDB and FinOps modules to unify visibility across AWS, Azure, GCP, and SCCM-managed on-prem environments.
Step 5. Model on-prem vs cloud (and now AI) economics
Modeling cost across mixed environments is where FinOps shifts from reporting to decision-making.
The goal is not just to calculate price—it’s to identify which workloads belong in the public cloud, which should stay on private infrastructure, and when hybrid makes financial sense.
1. Build the dataset first
Gather at least three months of usage and billing data, then align compute and storage metrics from every environment. The goal is a single normalized unit cost — something finance and engineering can both read.
2. Run the comparison
Here’s an example of how such table can look like:
| Metric | Public Cloud | Private Cloud / On-Prem | Hybrid (Baseline + Burst) |
|---|---|---|---|
| Compute (vCPU-hour) | $0.092 (AWS m6i.large on-demand) | $0.048 (3-year amortized hardware + power + support) | $0.056 (60 % on-prem, 40 % cloud burst) |
| Storage (GB-month) | $0.023 (S3 Standard) | $0.012 (SAN, 3-year depreciation) | $0.016 (mix of object and block) |
| Egress per TB | $90 (inter-region transfer) | $0 (internal LAN) | $45 (cache + partial replication) |
| Ops & support per server / month | $120 (cloud platform and monitoring) | $180 (patching and on-site support) | $150 (shared ops model) |
In most enterprise environments, this simple table already exposes misplaced workloads.
If a system runs 24x7 at 70% utilization, cloud on-demand pricing is a waste — it behaves like fixed infrastructure. Moving such workloads to VMware or a reserved-instance model typically cuts cost by 30-40%.
3. Extra: Add AI
If you run AI or GPU-heavy tasks, model them separately. Training jobs spike hard and benefit from elastic GPU capacity, but inference workloads usually stay flat and can sit in your datacenter.
4. Refresh the model regularly
Refresh the model monthly using updated billing, CMDB ownership, and available utilization metrics from cloud and on-prem monitoring systems.
Hybrid setups often split compute across AWS and Azure. In these cases teams lean heavily on Azure cost efficiency workstreams to keep workloads predictable.
The result is a living model that guides placement decisions automatically instead of arguing them at quarter-end.
Read also: Cloud Cost Analysis Tools: Features & Pricing Comparison
Step 6. Automate governance and policy enforcement
Manual reviews don’t scale. Once you’re managing hundreds of accounts across AWS, Azure, GCP, and on-prem systems, no one can keep up with every untagged resource or idle VM.
Governance has to run at the same speed as your deployments — otherwise, FinOps becomes firefighting. The fix is to turn policies into code and let your pipelines enforce them automatically.
A good governance layer has four key pieces:
- Policy-as-Code
Keep every rule that affects cost in version control next to Terraform or Helm. Pipelines enforce them before provisioning, so bad resources never reach production. - Tag compliance
Requireowner,cost_center, andenvironment. If they’re missing, stop the build.
That single step keeps ownership intact and makes future cost reviews painless. - Automation and remediation
Run daily checks for idle servers, unattached disks, or test systems no one shut down. Automate the cleanup or route tickets to owners before waste builds up. - Workflow integration
Policy events can generate Jira or ServiceNow tickets with links to the affected CI and owner, depending on the workflow configuration.
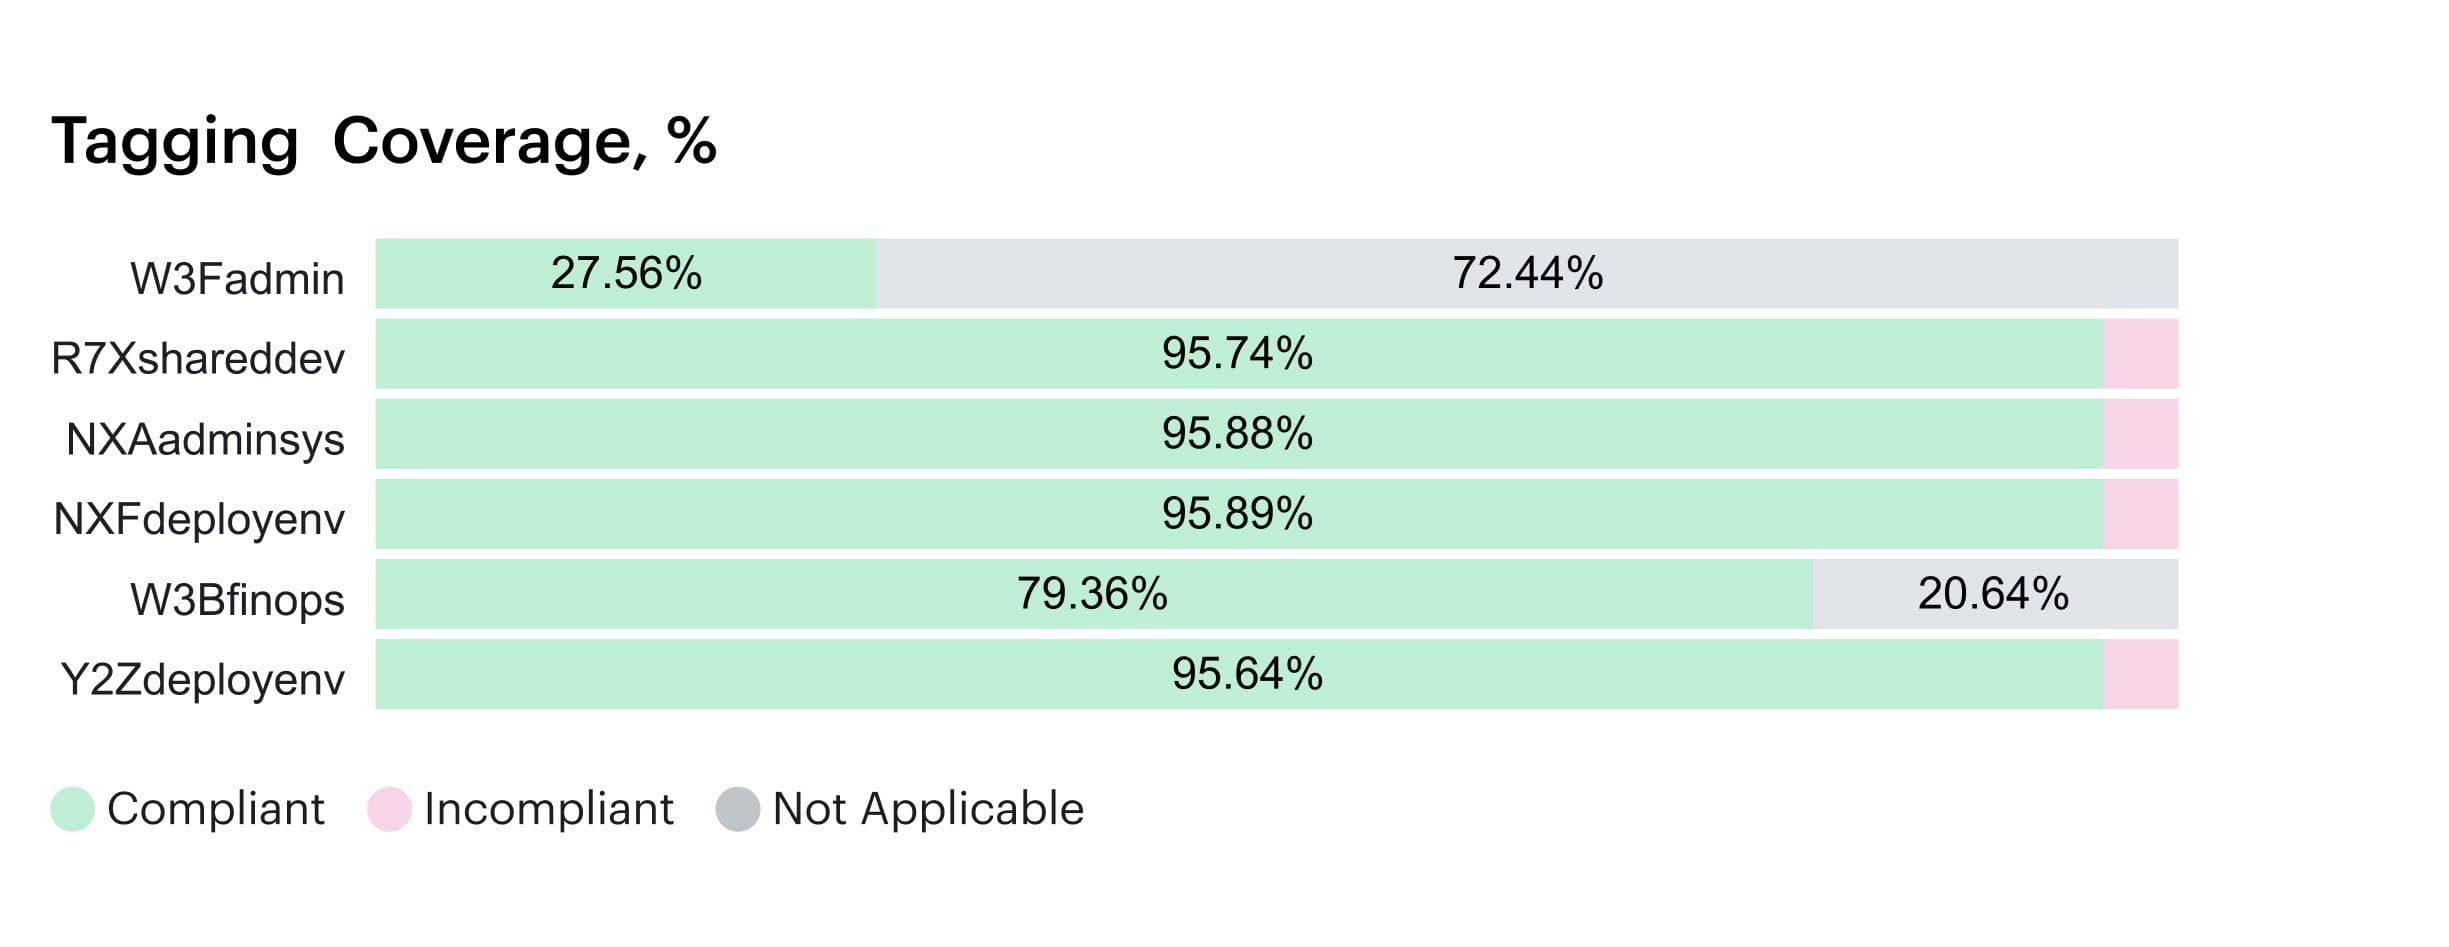
Tagging coverage report in Cloudaware. Schedule a demo to see it live
Cloudaware’s role:
Cloudaware evaluates policy rules using CMDB data. When a rule fires, the platform triggers the configured workflow — usually creating a Jira/ServiceNow ticket with the correct CI attached or sending an alert to the owning team. No manual reconciliation, no guessing who should fix it.
Read also: 6 Ways to (not) Fail AWS Cloud Cost Optimization in 2026
Step 7. Choose the right FinOps data platform
Every enterprise already has “cost tools.” There’s AWS Cost Explorer, Azure Cost Management, GCP Billing, maybe a ServiceNow report, and a few Excel sheets for on-prem numbers. The problem is that none of them talk to each other.
Choosing the right FinOps data platform is about deciding how deep you want visibility to go and how many environments you need to unify.
When assessing tools, focus on how well they:
- Can it merge cloud and on-prem billing in one normalized model?
- Can it link spend to real owners and business services through CMDB or tags?
- Can it feed policies and alerts back into CI/CD and workflows automatically?
Hybrid cloud cost management platform comparison
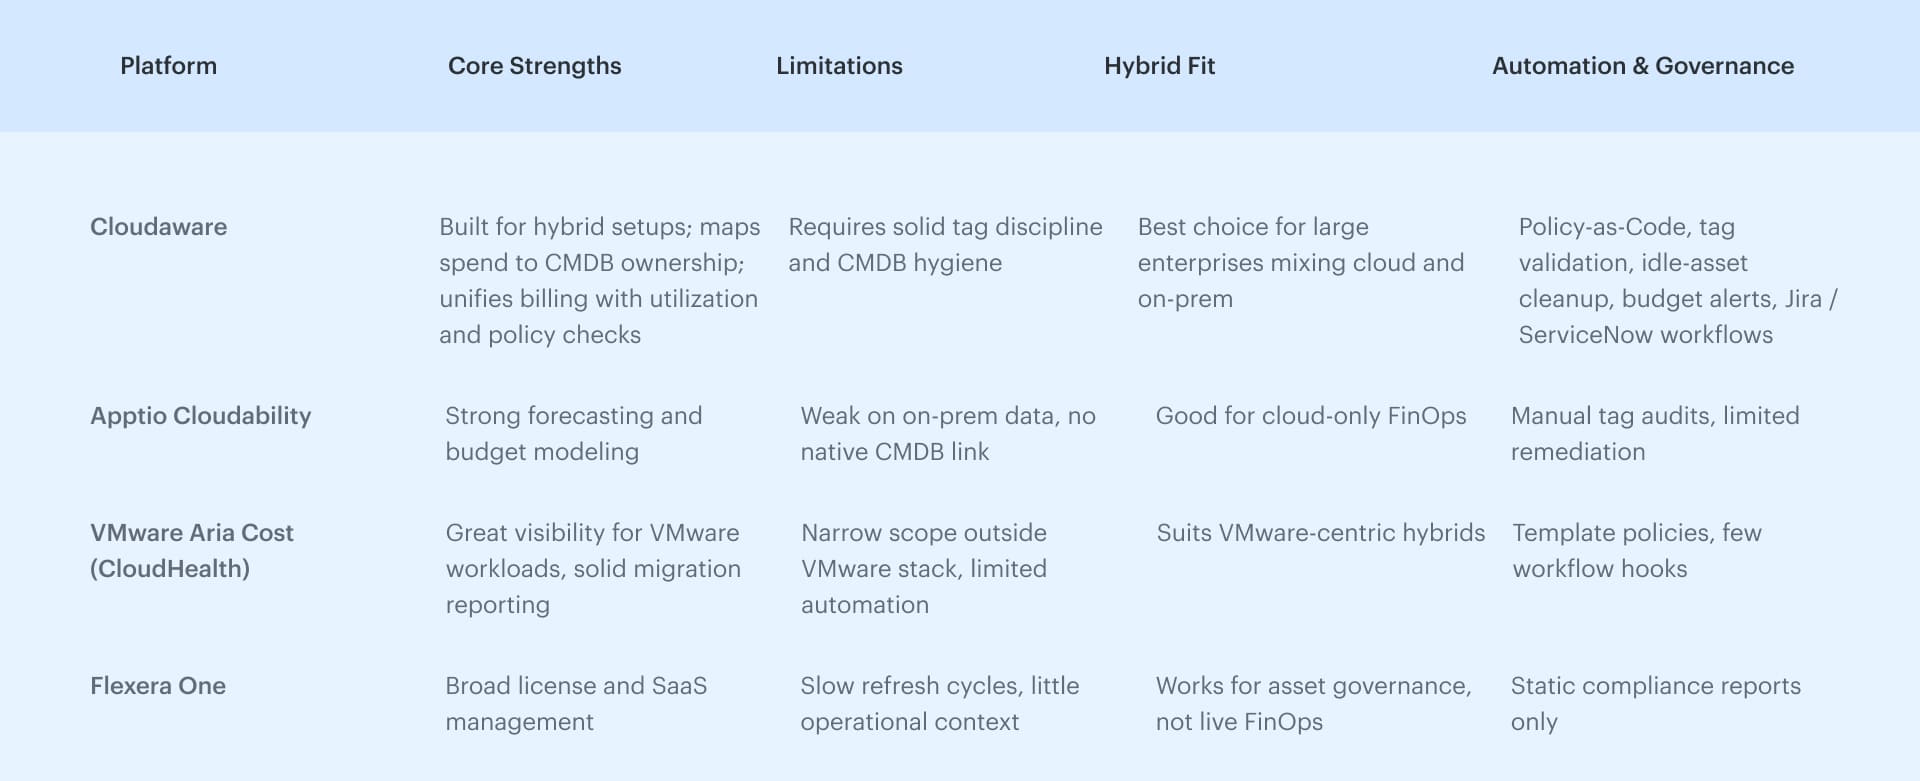
In a hybrid setup, organizations often choose between focused cloud cost management tools and full multi cloud management platforms that address cost, visibility, and control in one layer.
Why Cloudaware leads for hybrid cost management
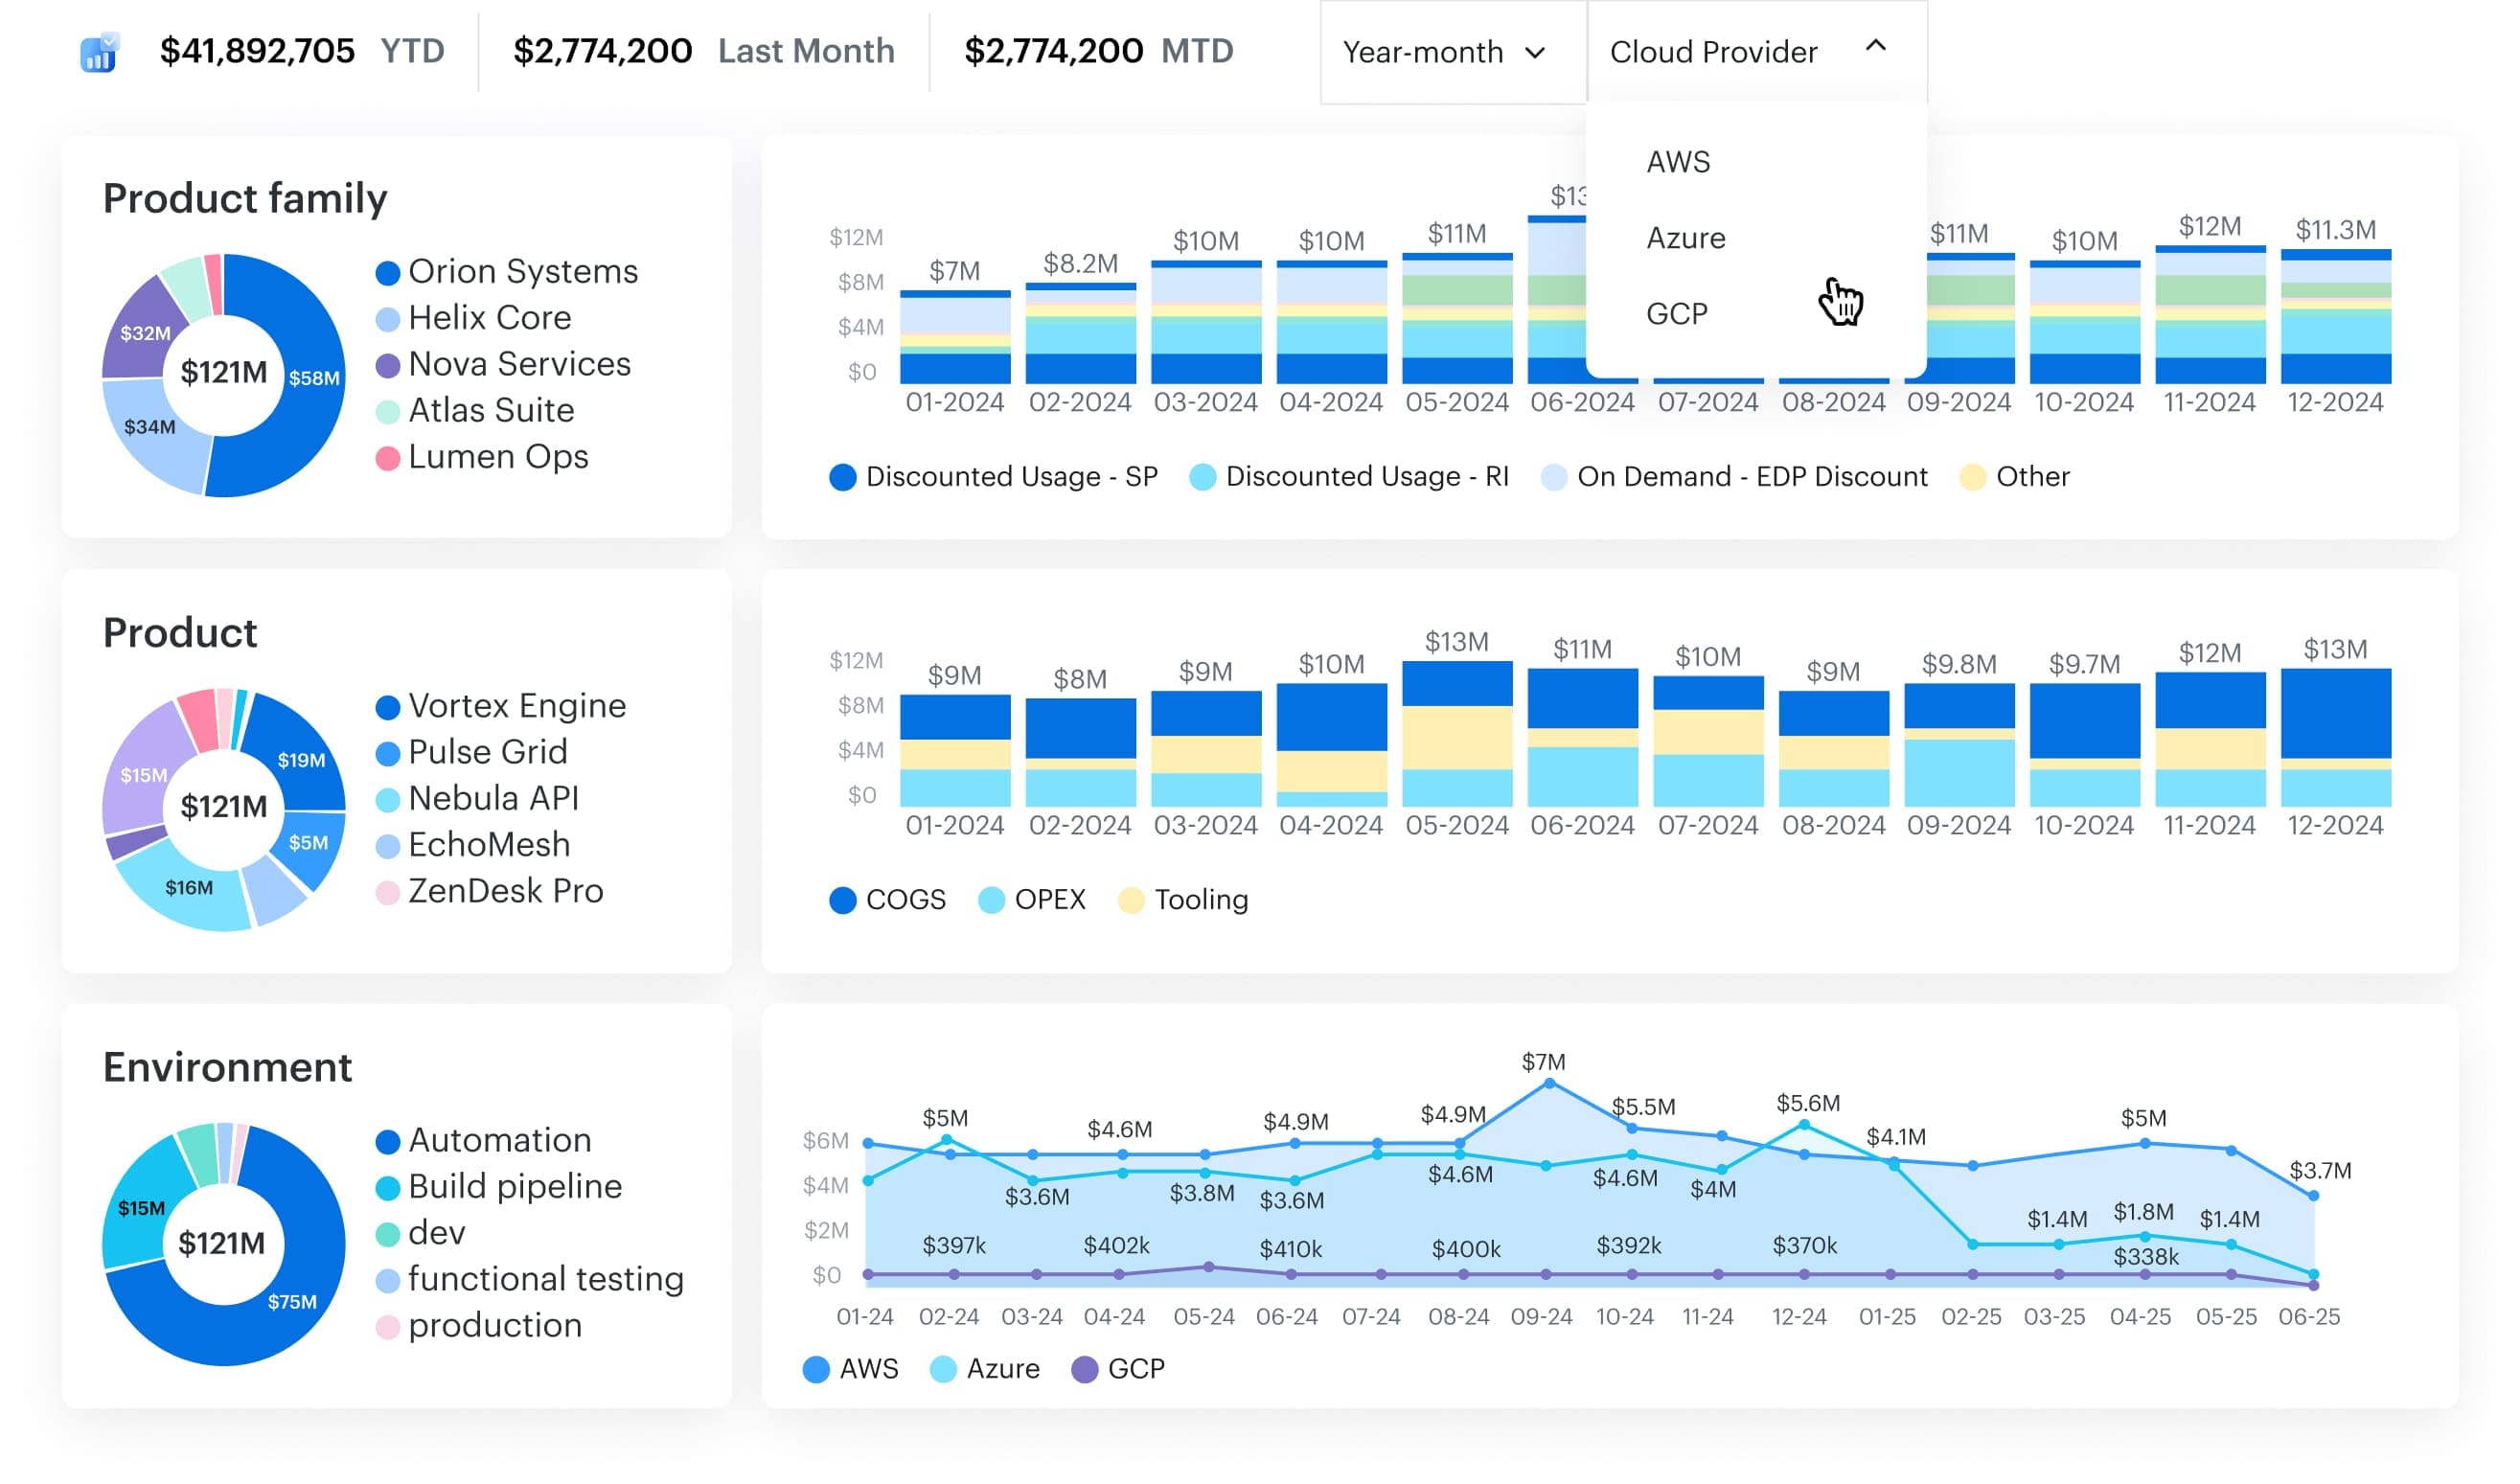
Cloudaware consolidates cloud billing, usage metrics, and metadata from AWS, Azure, GCP, Oracle, and VMware into one CMDB-enriched view, so every dollar links to a real service, team, or environment.
Core value: full visibility of cloud costs in one place — billing + usage + tagging — mapped to services and owners. The docs explicitly call out daily updates, advanced alerts, and enterprise visibility (“no more spreadsheets”).
That connection between billing, tagging, and workflow means FinOps teams can move from visibility to control: they see the spend, know who owns it, and fix it before month-end.
Key outcomes:
- Unified billing view across AWS, Azure, GCP, Alibaba Cloud, Oracle, VMware, and on-prem
- Daily updates, budget alerts, and anomaly detection
- Rightsizing and waste analytics with real ownership context
- Showback and chargeback built on the same CMDB model
- Dashboards and reports that finance and engineering can both trust
Cloudaware turns hybrid cloud cost management into a closed-loop process — one platform where every cost has an owner, every policy runs automatically, and every report stays accurate by design.
Step 8. Measure hybrid FinOps success
In a hybrid environment, success means knowing not just what you’re spending, but who’s responsible and how quickly you can act. Optimization means nothing if you can’t prove improvement. These metrics keep teams honest and progress visible.
Key performance indicators for hybrid FinOps:
- Tag coverage (%): percentage of resources with valid
ownerandcost_centertags. Anything below 90 % means your visibility is unreliable. - Unallocated spend (%): the share of costs with no mapped owner or service. Keep it under 5 %; anything higher means broken tagging or missing CMDB links.
- Cost recovery ratio: how much shared spend (network, monitoring, security) you’ve successfully reallocated to teams. 95 %+ is a good benchmark.
- Anomaly detection latency: time between a cost spike and alert. Mature setups catch it within hours, not days.
- Policy compliance (%): portion of resources passing automated governance checks. Low compliance means broken pipelines or skipped policies.
- Forecast accuracy (%): difference between projected and actual spend.
If your forecast is always 20 % off, your unit economics model needs work. - Operational overhead (hours/week): time FinOps spends on reconciliation instead of improvement. Automation should drive this down quarter over quarter.
Tracking these metrics turns FinOps from a reporting activity into a management practice.
How to read these numbers:
- If tag coverage and unallocated spend are bad → fix ownership first; nothing else matters until cost data is trustworthy.
- If anomaly latency is high → check if governance automation is broken or alerts are throttled.
- If forecasts are off → verify whether your utilization feeds and CMDB attributes are in sync.
Once KPIs are stable quarter over quarter, you’re no longer reacting to spend — you’re managing it as part of hybrid cloud operations.
Read also: Cloud Cost Optimization Metrics: 18 KPIs FinOps Track