


If you work in a multi-cloud enterprise, you’ve probably asked yourself what is FinOps more than once — not because the definition is unclear, but because the reality keeps changing. In 2025, costs move faster than dashboards update, tags fail on deploy, and Kubernetes scales whenever it wants. Finance wants predictability; engineering wants flexibility; product wants velocity.
FinOps is the layer that connects all three. This guide was created together with Cloudaware FinOps & ITAM experts who work with multi-cloud enterprises (AWS, Azure, GCP, Oracle, Alibaba) on daily cost, allocation, and governance problems.
What is FinOps?
FinOps is the practice of connecting technical decisions with financial outcomes so teams can build, scale, and operate with cost clarity.
A formal FinOps definition describes it as a cross-functional discipline built on transparency and shared ownership. In reality, it looks much simpler: knowing what your service consumes, why it costs that much, and what knobs you can turn without breaking performance.
In practical engineering terms, FinOps is:
- A visibility layer that tells teams what they run and what it costs.
- A decision layer that aligns performance needs with budget realities.
- An ownership layer that makes cost part of engineering responsibility.
- A timing layer that brings cost signals in before architectures drift.
- A communication layer across engineering, product, and finance.
But what is it in cloud specifically? It’s the only workable way to manage infrastructure that scales itself, changes daily, and behaves differently across providers.
Why FinOps emerged as cloud spending accelerated
Multi-cloud architectures and distributed ownership pushed cloud spend past the point where finance-only reporting could keep up. Autoscaling, ephemeral workloads, and fragmented tagging made cost control an engineering problem — not an accounting task.
FinOps appeared because teams needed real-time, contextualized cost insight to make decisions before waste happened.
Core principles behind the FinOps discipline
The discipline relies on clear visibility, accountable ownership, and collaboration across engineering, product, and finance.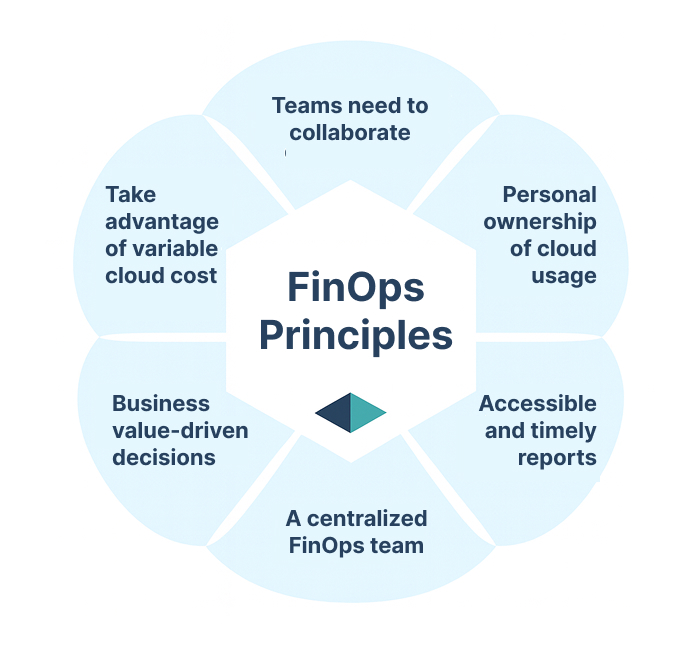 The FinOps Principles reinforce this by promoting timely data, shared responsibility, and continuous optimization — a far more realistic model for cloud-native systems than end-of-month cost reviews.
Read also: How Cloud Experts Use 6 FinOps Principles To Optimize Costs
Cloud cost management vs FinOps: What’s the difference
Cloud cost management and FinOps often get grouped together, but in practice they solve different problems. Cloud cost management focuses on controlling and reducing spend — budgets, alerts, usage clean-ups. FinOps, on the other hand, adds culture, ownership, cross-functional decision-making, and continuous optimization.
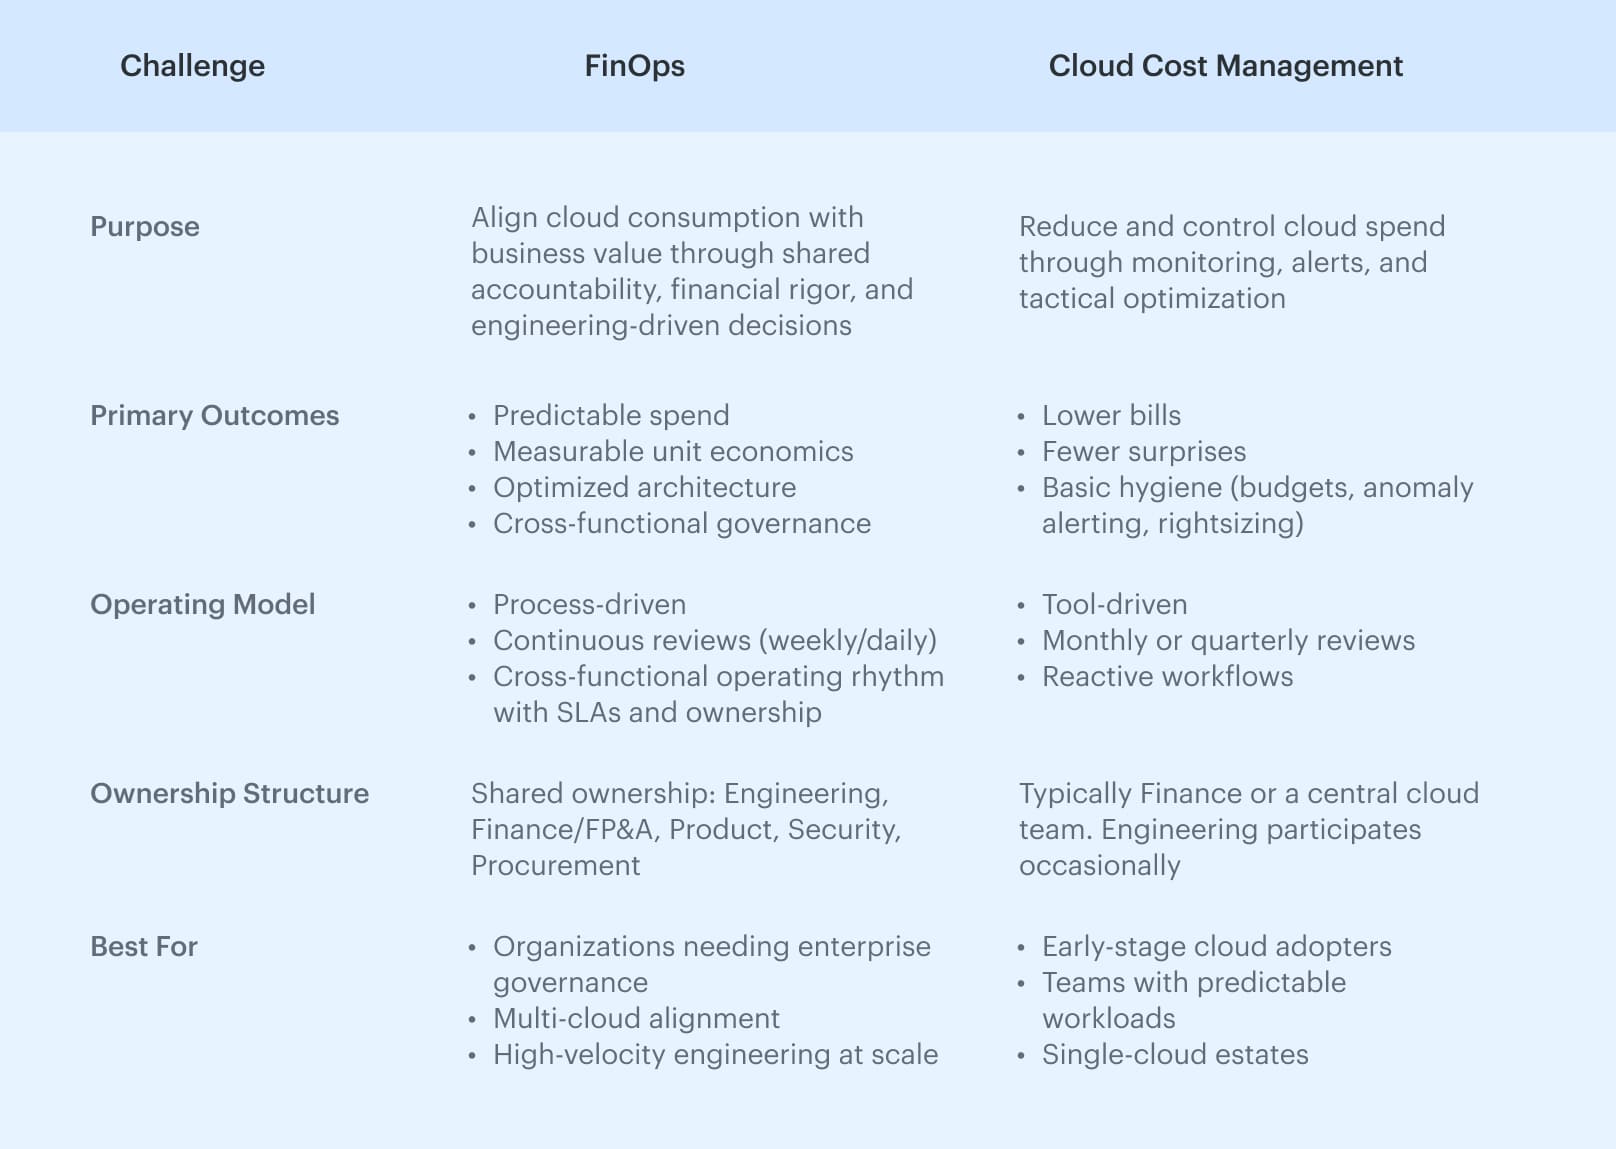
When companies need FinOps instead of cost management
Teams outgrow standard cost management when:
- Cloud spend grows faster than engineering throughput
- Tagging and ownership gaps block clean allocation
- Multi-cloud visibility doesn’t line up across providers
- Cost needs to be tied to product value and unit economics
- Engineering requires guardrails, not just monthly reports
TBM vs FinOps: How the models compare
If you’ve ever sat in a meeting where the TBM team presents annual IT cost towers and the FinOps team immediately asks, “But who owns this EKS cluster and why did spend jump 18% last week?” — congrats, you’ve officially seen TBM and FinOps collide.
Both disciplines manage technology cost, but they operate on different time horizons, data speeds, and decision cycles. The FinOps Foundation and TBM Council now formally acknowledge this coexistence — and published guidance on how the two should integrate rather than compete.
In practice, TBM gives the financial runway, while FinOps gives the daily steering wheel.
Why enterprises need both
- TBM explains total technology spend at the CIO/CFO level: annual budgeting, cost towers, run/grow/transform categories, and allocations across business units.
- FinOps explains why cloud spend moved today, who owns it, and what to do before it becomes a budget incident.
Together, they produce one financial language across cloud, data center, SaaS, and hybrid services — with FinOps feeding TBM the granular cloud view TBM never had before.
TBM vs FinOps: Expert comparison table
TBM and FinOps aren’t competing frameworks, they operate at different altitudes of the same financial system.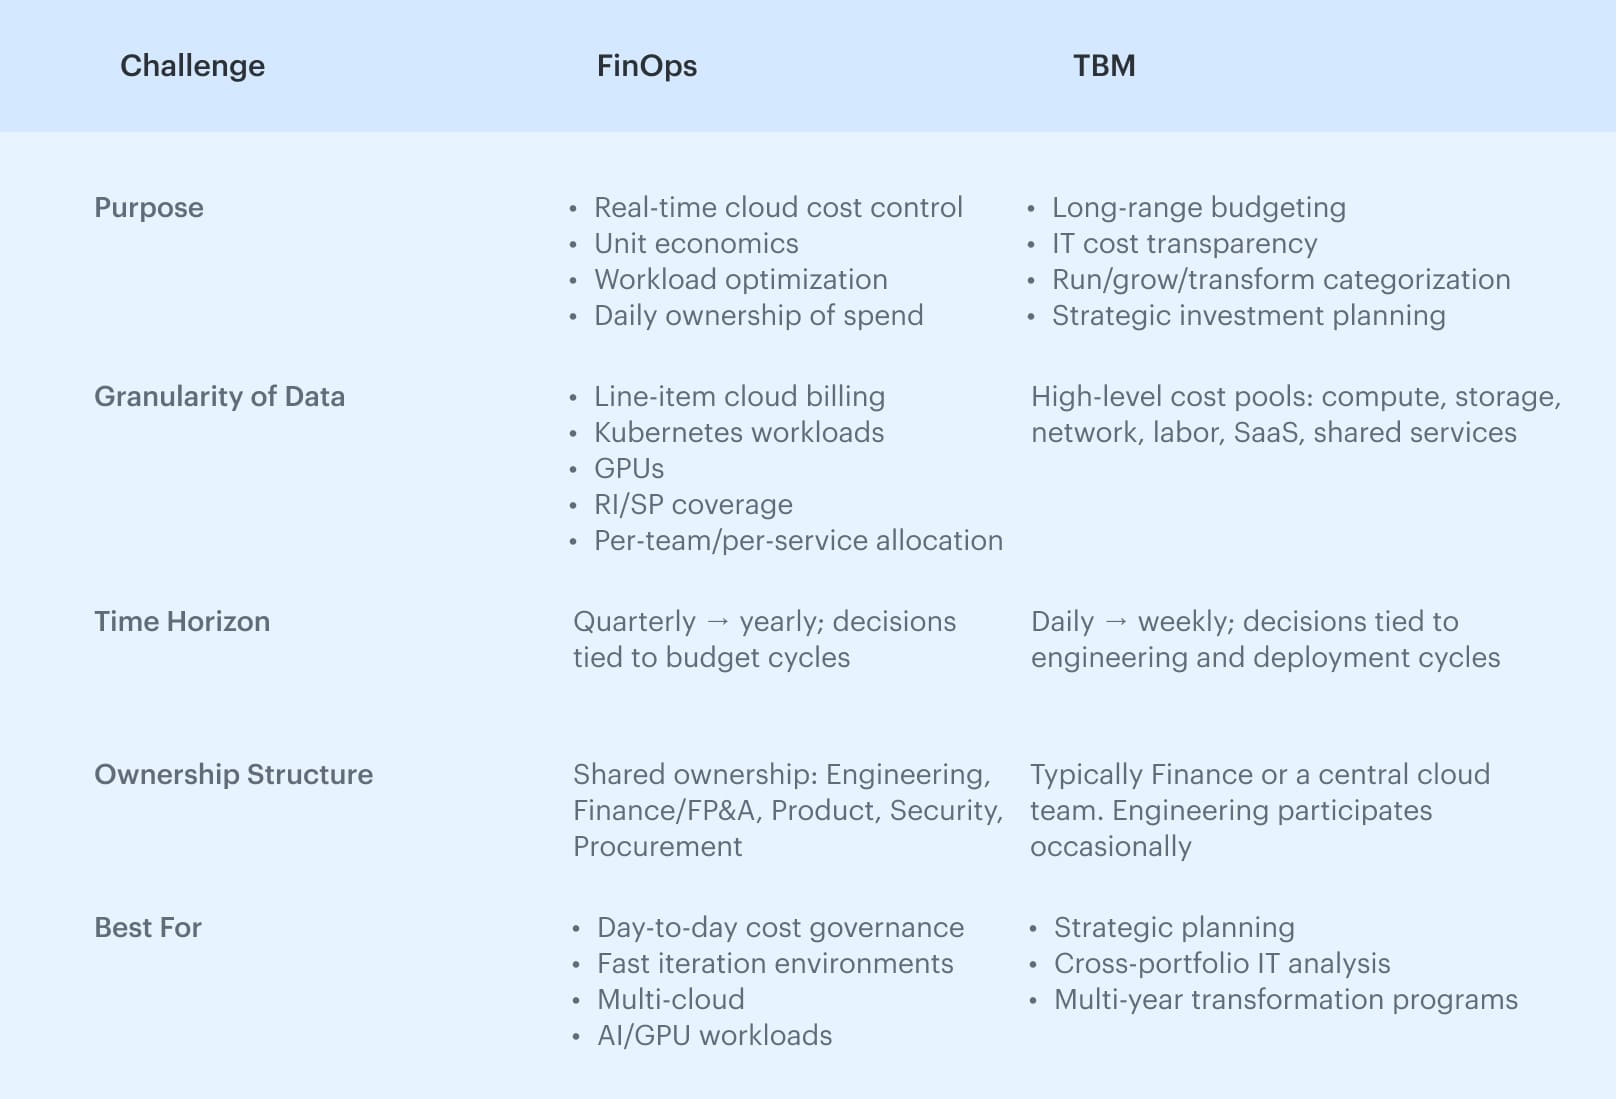 TBM sets the long-range investment story like “Are we funding the right capabilities?”, while FinOps keeps the day-to-day cloud engine from overspending like “Are today’s workloads sized, tagged, and governed correctly?”
Enterprises that combine the two get:
- Real-time cloud economics feeding cleanly into TBM cost structures
- Accurate chargeback/showback
- Aligned budgets and commitments
- Fewer “why did spend spike?” escalations
- Strategic investment planning based on actual usage patterns, not averages
Read also: FinOps Automation That Works: Tips & Tools from Pros
Cloud FinOps process explained for modern teams
Teams usually understand the value once AWS, Azure, and GCP start telling different stories about the same workload. Cloud FinOps creates one operational model so engineering, product, and finance can work off the same data instead of three incompatible billing exports.
In day-to-day terms, ‘FinOps cloud’ means combining usage, performance, and ownership signals early enough that teams can still act on them.
Most real FinOps threads on Reddit reflect the same theme: tools don’t fix misalignment — clarity and ownership do. That’s why companies adopt multi cloud FinOps. Modern systems already span EC2, AKS, GKE, functions, containers, and on-prem clusters; nobody wants five dashboards and zero context.
How cloud FinOps works across providers
Each cloud requires a slightly different playbook:
- Cloud FinOps Amazon. Heavy on CUR exports, tagging, RI/SP coverage, and spend-per-service mapping.
- FinOps on Google Cloud. Focus on normalizing BigQuery, GCE, and data-processing units to align with AWS/Azure.
- FinOps Google Cloud + Azure. Reconcile their billing models so engineers can compare services without guessing.
This unification is what makes FinOps cloud cost management and FinOps cloud financial management work in practice.
Why it matters when environments grow fast
Reddit threads often mention the same pain points: billing APIs are inconsistent, timestamps don’t match, ownership metadata drifts, and cost centers never align with how services are actually built. Engineers see one truth, finance sees another.
Our guide on Hybrid Cloud Cost: How to Optimize and Manage in 2026 explains the root cause: you can’t manage cloud spend until all sources — cloud and on-prem — are normalized, enriched with CMDB ownership, and tied to real applications.
With that foundation, cloud FinOps becomes an engineering control loop instead of end-of-month reporting.
FinOps framework and how it works
If you strip away the slides, the FinOps framework is just the way we standardize cloud financial management so every team plays the same game.
Most introductions to FinOps materials show the three phases: Inform, Optimize, Operate. But in practice, they’re a feedback loop engineers touch every week, not a one-time transformation.
At its core, the framework from the FinOps Foundation defines how data flows (billing, usage, CMDB), how ownership is modeled, and how actions are triggered.
In a modern FinOps setup, you’re not just lowering EC2 or BigQuery cost. You’re deciding which workloads make sense where, what to commit to, and how fast you can react to change. That’s why people online keep repeating that the framework matters more than the tool stack.
In our guide How To Use FinOps Framework: Top 10 Mistakes & Their Fix, we show how this evolves into a real FinOps operating model: scopes for cloud, SaaS, and on-prem, different maturity targets per domain, and guardrails wired into CI/CD and policy engines instead of month-end CSVs.
FinOps roles and responsibilities
If you ask most engineers, “What FinOps actually changes in day-to-day IT work?” the answer usually starts with ownership. A solid FinOps team is a set of personas who share clear roles and responsibilities and know when to step in. When that’s missing, cost signals bounce around Slack, and nothing really moves.
Below is a lean view of how many enterprises structure their core personas.
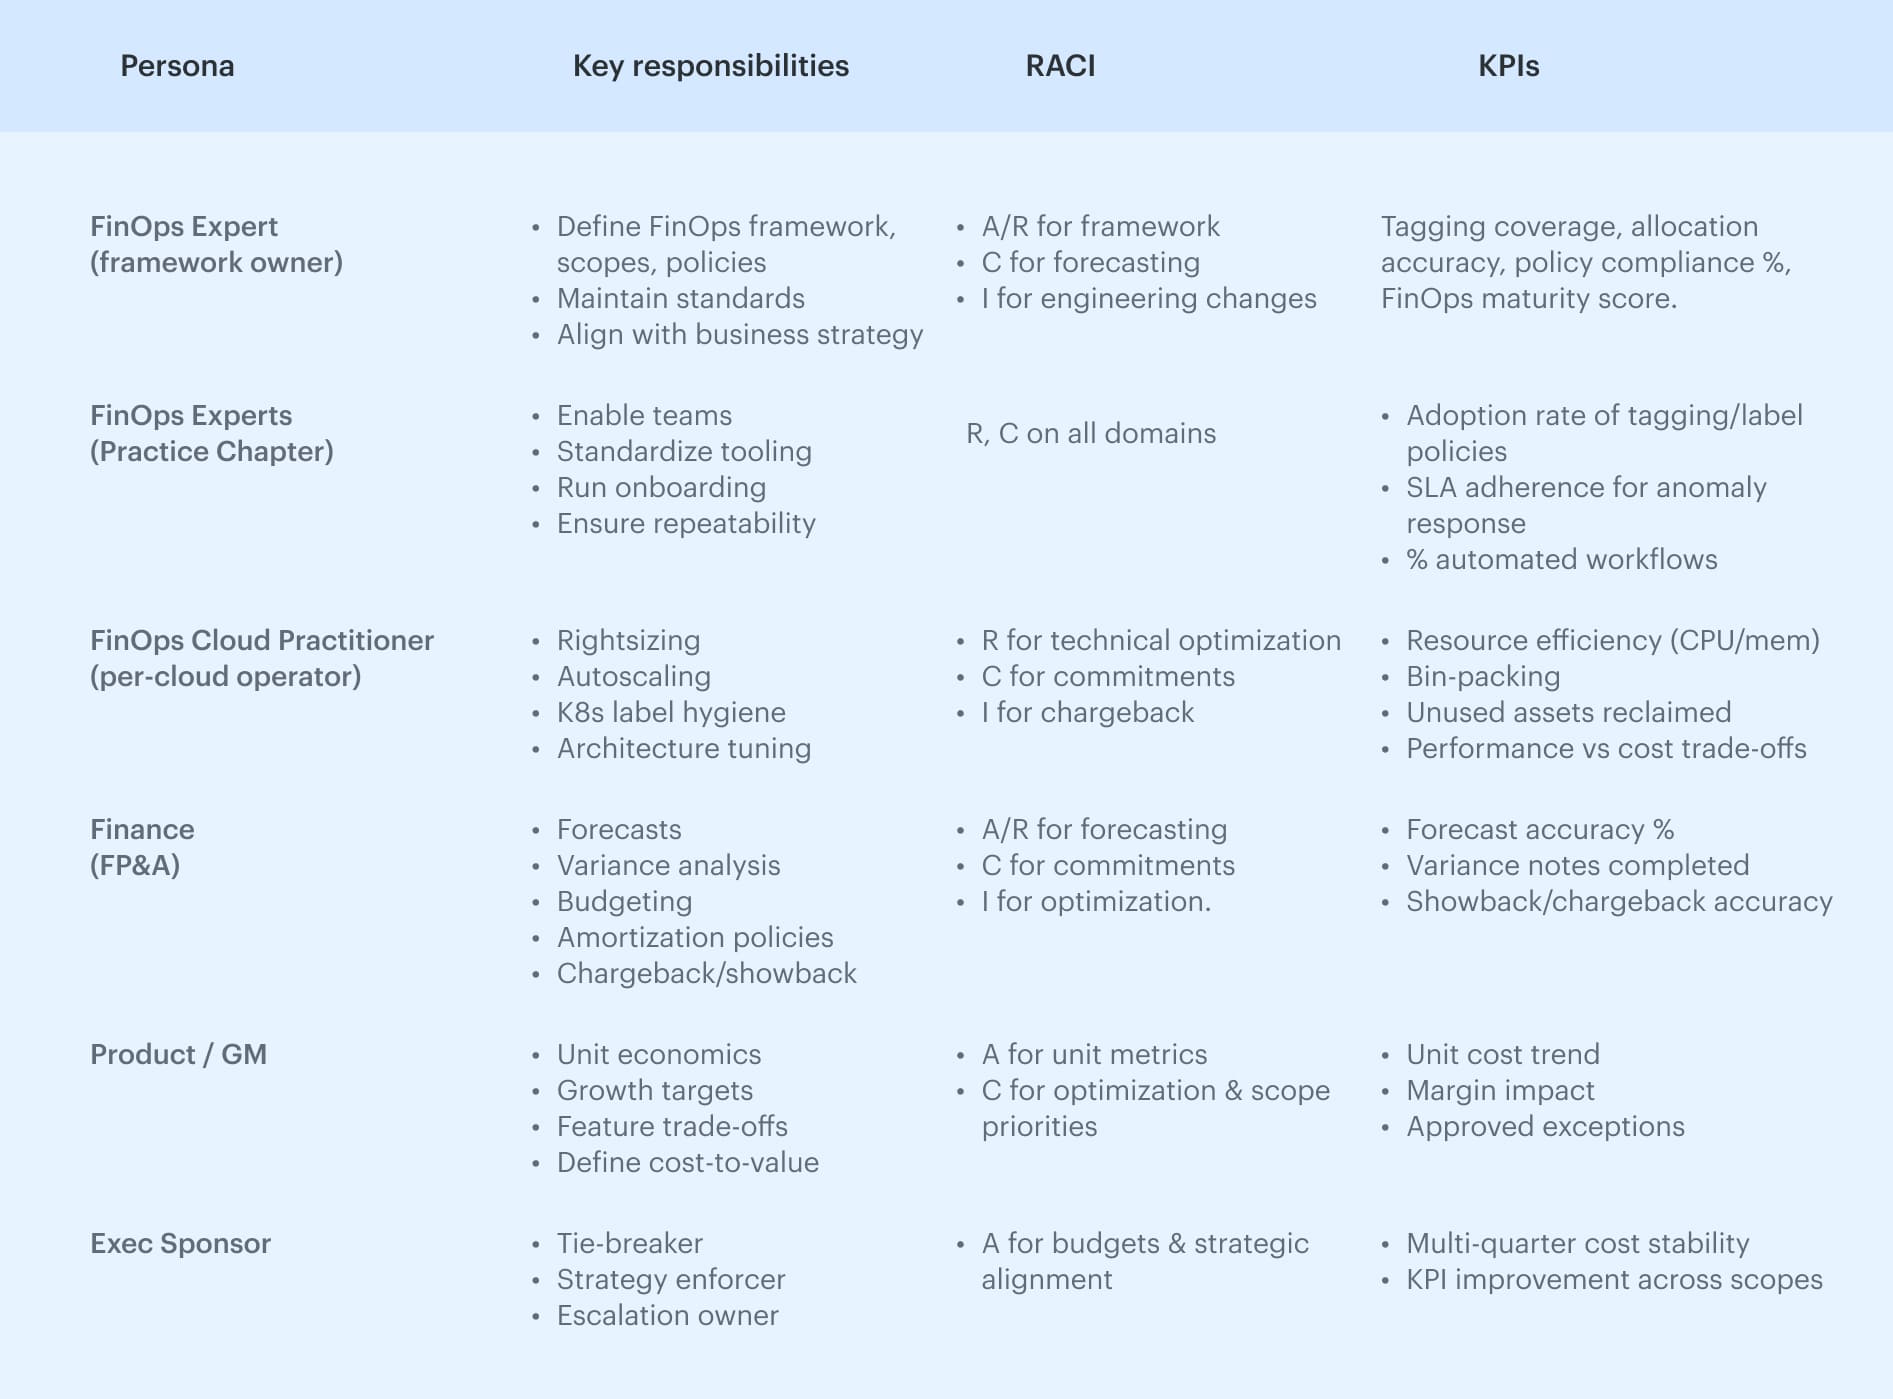
In our FinOps Personas: Roles, RACI, and KPIs for Real Teams guide, we break down how each role connects to specific capabilities so you can actually operationalize FinOps instead of treating it as a side project.
How FinOps benefits cost and governance
Benefits here aren’t just “lower cloud costs.” The real impact is that cloud spending, ownership, and governance finally run on the same model instead of three contradictory dashboards. When billing, CMDB context, and policies align, cost signals become actionable instead of reactive.
Cost benefits that show up immediately
Teams adopting the processes from 10 Cloud Cost Optimization Benefits or Why It’s a Must in 2026 consistently see:
1. 10–25% cost reduction in 90 days
Because waste is removed at the source:
- idle EC2/RDS trimmed
- unattached EBS/ENIs deleted
- non-prod scheduled automatically
- K8s requests/limits aligned to p95
- storage tiered correctly
- commitments recalibrated weekly
- anomalies routed before month-end
2. Forecasting you can trust (5-10%)
Daily ingestion, off-hours modeling, commit utilization, and anomaly deltas produce stable, bookable numbers. Finance stops chasing variance; engineering stops defending line items.
3. Commitments that pay
Hitting 60-85% coverage with >95% utilization becomes normal when commit planning uses real usage, not last month’s guess.
How FinOps strengthens governance (the part most teams miss)
FinOps benefits governance because it forces operational clarity (FinOps Foundation Framework):
- allocation 90-95%
- clean ownership
- policy-as-code (tag gates, TTL, schedules)
- anomaly routing to real owners
- cost accountability per services and teams
This is what makes FinOps more than optimization: it’s the system that aligns cloud, finance, and engineering so the organization can scale without chaos.
FinOps strategy for reducing cloud waste
Most failed FinOps implementations have tools and dashboards, but no shared playbook. The goal here is simple: build a system where idle resources, bad sizing, and forgotten services are surfaced and fixed as part of normal work.
How to implement FinOps to cut waste
In practice, the most effective strategies follow the same pattern:
- Define scopes and ownership. Start with teams/apps / BUs. No multi-owner scopes. This is the backbone of your FinOps roadmap.
- Ingest and normalize billing daily. AWS CUR, Azure Cost Management, and GCP exports into one model. Without this, you can’t implement FinOps beyond spreadsheets.
- Build a FinOps tagging strategy. Enforce
application,env,ownerin CI/CD, backfill via CMDB/virtual tags. Target ≥90% allocatable spend; anything lower blocks good decisions. - Automate waste detection and routing. Policies for idle VMs, orphaned disks, over-requested K8s, and unused services. Alerts go straight to owners via Slack/Jira, not to a generic FinOps inbox.
For a full, step-by-step breakdown of this approach, read also: Cloud Cost Optimization Framework: 11 Steps to reducing spend in 2026.
FinOps challenges most companies face
If your team is still quietly asking, “What are FinOps in practice?” it’s usually because the same FinOps challenges keep looping: the data model is messy, ownership is unclear, and fixes don’t stick.
Most FinOps issues fall into a few repeatable buckets:
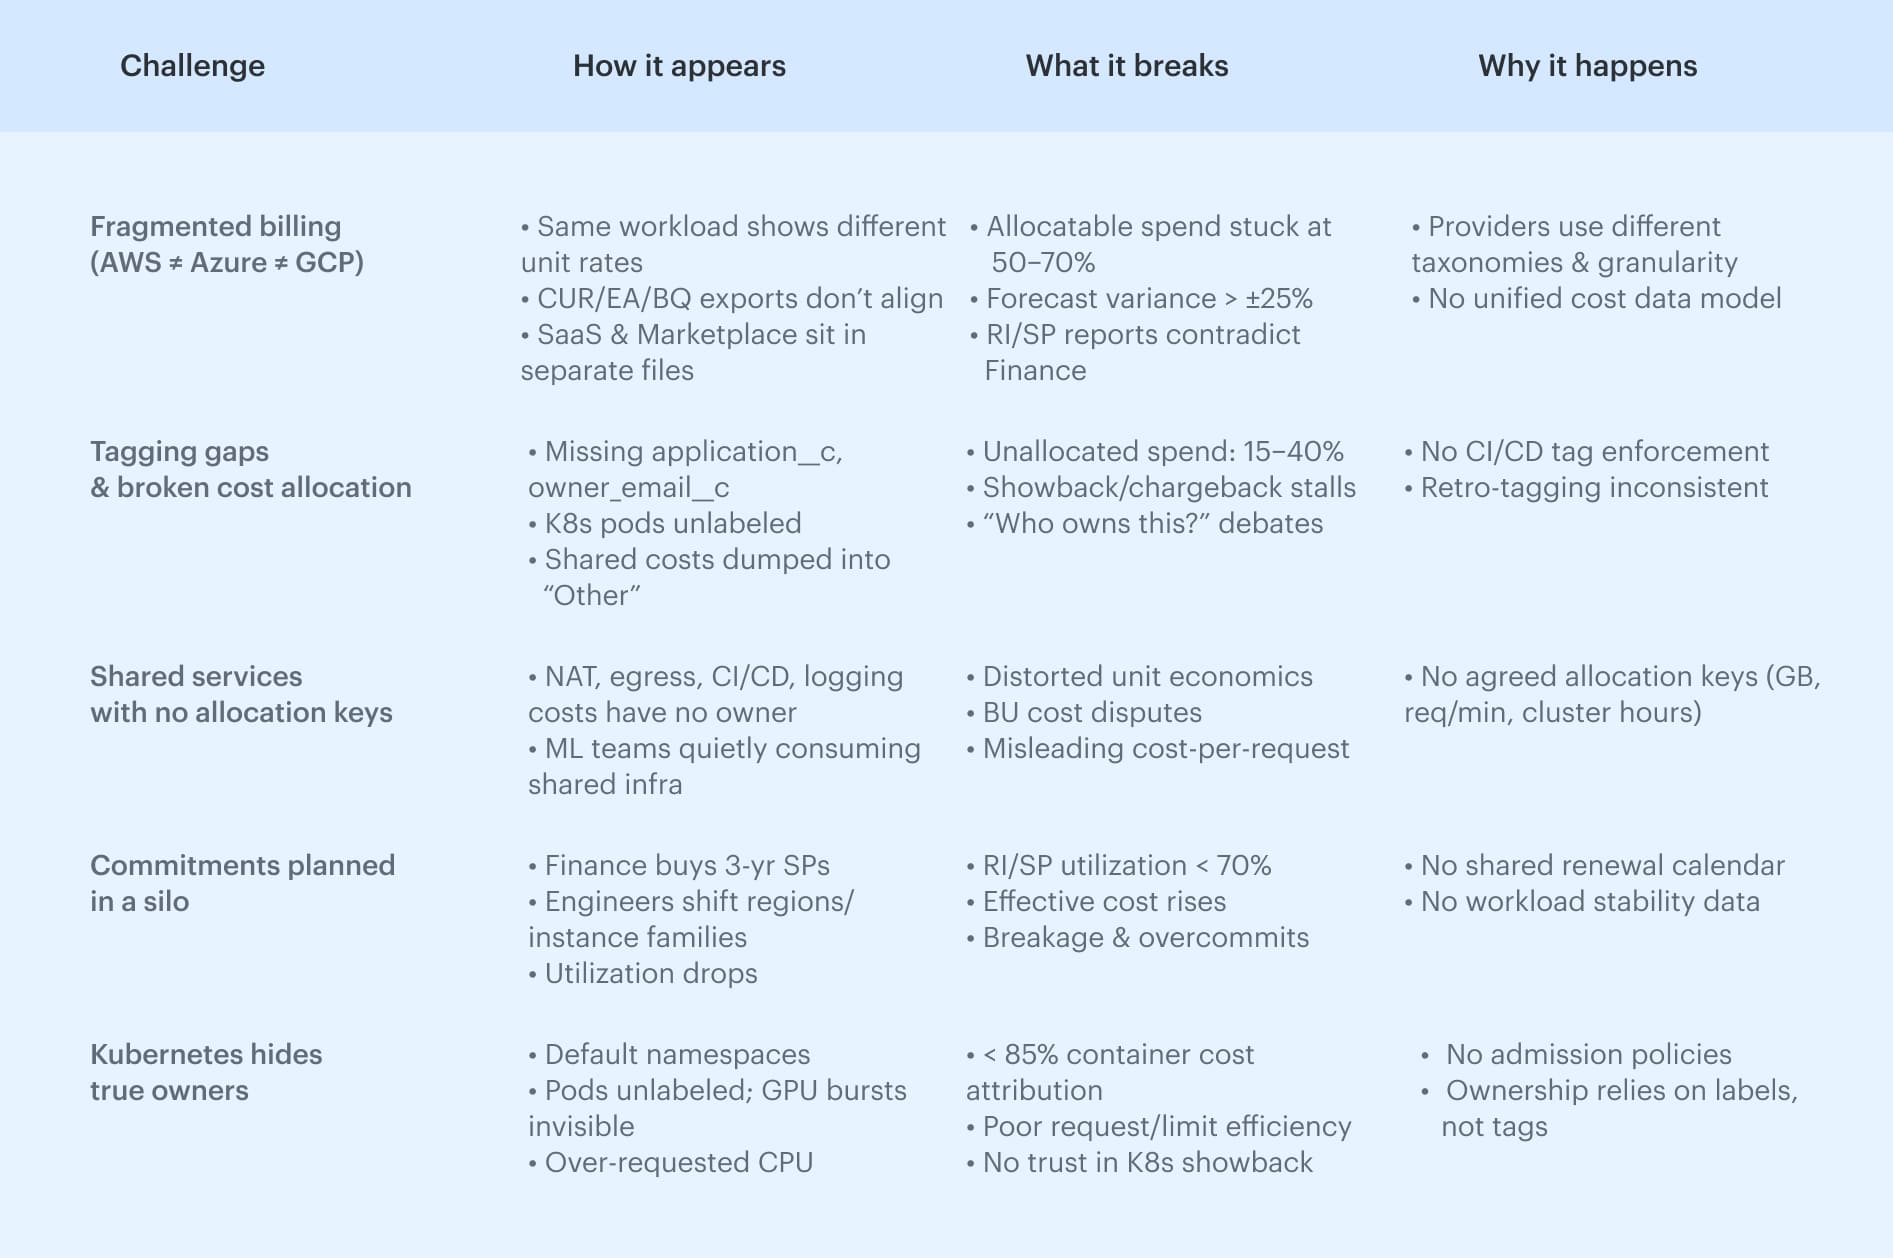
This is the “reality layer” every practitioner hits before optimization:
- Cloud cost ≠ cloud usage until billing is normalized.
- Allocation ≠ tagging until governance is enforced.
- Forecasting ≠ rolling averages until drivers are mapped.
- Accountability ≠ dashboards until scopes are defined.
This table helps the reader recognize their own symptoms and anchors the next section (FinOps solutions, strategy, KPIs).
Read also: 7 Cloud Cost Management Challenges and How to Fix Them
FinOps tools that support visibility and control
Most teams start with native cloud consoles, but the real acceleration happens when you introduce tools that centralize cost visibility, allocation, anomaly detection, forecasting, and resource optimization across AWS, Azure, and GCP.
Below is a practical map of FinOps tools grounded in the types of capabilities highlighted in Cloudaware’s cloud cost analysis tools and cost allocation software guides.
1. Cost allocation & tagging governance tools
These tools turn scattered cloud invoices into allocatable spend. They enforce required tags at deploy time, auto-correct drift, and apply rule-based or CMDB-backed allocation keys for shared services.
If your allocatable % isn’t above 90-95%, you don’t have FinOps — you have noise. This category is what makes showback, chargeback, and budget accountability actually work.
Best tools for cloud cost allocation
- Cloudaware. Comprehensive CMDB mapping, automated tagging, and a cross-cloud cost model
- Finout. Strong consolidated “Megabill” for SaaS + infra
- CloudZero. Unit cost–driven allocation for product teams
2. Cost visibility & multi-cloud analytics tools
If you can’t trust your cloud data, you can’t run FinOps. These tools unify AWS, Azure, GCP, and on-prem billing into one normalized model — with amortized rates, tags, CMDB metadata, and daily deltas.
This is your Inform phase foundation: no blind spots, no mismatched exports, no “let me check another dashboard.”
Best tools for cloud cost visibility
- Cloudaware. Deep CMDB-enriched visibility, normalized billing, tagging governance, and daily updates across AWS/Azure/GCP/VMware/SaaS
- Apptio Cloudability. Strong analytics and forecasting, good for FP&A reporting
- CloudHealth (VMware). Mature analytics for enterprises with complex governance needs
3. Rightsizing, waste cleanup & resource optimization tools
Rightsizing is where most FinOps teams see their first real savings — but only when recommendations come with performance guardrails and context.
Tools in this category scan metrics, correlate usage with RI/SP coverage, and flag waste that engineering trusts enough to act on. Expect them to separate safe reductions from “this will wake up SRE on Sunday.”
Best tools for cloud waste reduction
- Cloudaware. Utilization-based optimization using 100+ waste policies, automated detection of idle/underused resources, and automatic ticket routing to the right owners
- CAST AI. Excellent for Kubernetes rightsizing and node optimization
- Densify. Strong ML-based compute sizing for large fleets
4. Commitment management (RI/SP/EA/CUD) tools
Commitments are a lever unless tied to real usage signals. These tools model coverage and utilization, simulate buy/hold scenarios, and flag breakage before finance discovers a 40% utilization cliff.
Expect them to align long-term cloud pricing decisions with engineering reality, not last quarter’s spreadsheet.
Best tools for commitment optimization
- Cloudaware. Cross-cloud commitment tracking across AWS, Azure, and GCP, with utilization alerts, coverage modeling, and CMDB context
- ProsperOps. Automated AWS SP and RI management with hands-off optimization
- Zesty. Dynamic commitment management and auto-optimization for EC2/EBS
5. Policy enforcement & governance automation
Manual governance doesn’t scale. These tools embed FinOps into CI/CD and infra policies like tagging rules, naming standards, region restrictions, TTLs, and auto-shutdown schedules enforced automatically.
Expect them to prevent bad resources from ever reaching production and to eliminate human error as a cost driver.
Best tools for FinOps governance
- Cloudaware. Tag/owner enforcement, policy-as-code, drift detection
- OPA Gatekeeper. K8s policy enforcement
- nOps. Good for policy-based optimization and compliance
6. Real-time anomaly detection & cost spike prevention
Anomalies don’t become problems because they happen, but because no one notices for 2–14 days. These tools detect deltas against historical patterns, attach owner context, and route alerts to the person who can fix it now, not after invoice close.
Expect a meaningful reduction in MTTA/MTTR — and fewer “Why did we spend $9k overnight?” threads.
Best tools for anomaly detection
- Cloudaware. Context-rich anomalies mapped to apps, owners, and services; Slack/Jira routing
- AWS Cost Anomaly Detection. Native AWS service; good for account-level spikes
- Finout. Noise-filtering anomaly radar with multiple data sources
FinOps Reporting & KPIs that matter
FinOps-focused reporting is the operating layer where technical data becomes financial truth. Good reporting doesn’t drown teams in dashboards — it gives a shared view of what was spent, why it happened, and who owns it. When reporting is clean, teams stop debating the bill and start improving it.
What effective reporting in a FinOps practice includes:
- Allocatable data: spend mapped to teams, services, and environments (tags, accounts, CMDB).
- Normalized billing sources: AWS CUR, Azure Cost Management, and GCP BigQuery aligned into one model.
- Real-time signals: daily deltas, anomaly detection, and spend spikes tied to owners.
- Performance + cost linkage: unit economics, rightsizing impact, commitment coverage.
- Cross-team visibility: one reporting layer for engineering, finance, product, and leadership.
KPIs every FinOps reporting stack should track:
- % of cloud spend allocated
- % of tagging policy compliance
- Forecast variance (budgeted vs. actual)
- RI/SP coverage & utilization
- Waste detected (idle, unattached, oversized)
- Cost per service/team/environment
- % costs with defined owners
For full KPI guidance, see 27 FinOps KPIs To Get The Most From Your Cloud Spend.
Dashboards to expect:
- Spend by service/team/env
- Allocation health
- Tagging compliance
- Commitment coverage
- Rightsizing impact
- Anomaly feed
- Forecast vs. actual trends
Cloudaware offers prebuilt FinOps dashboards that merge multi-cloud billing, CMDB metadata, tagging, and ownership into one reliable reporting layer — making KPIs actionable instead of theoretical. See Cloudaware dashboards in action.
How Cloudaware helps manage cloud costs
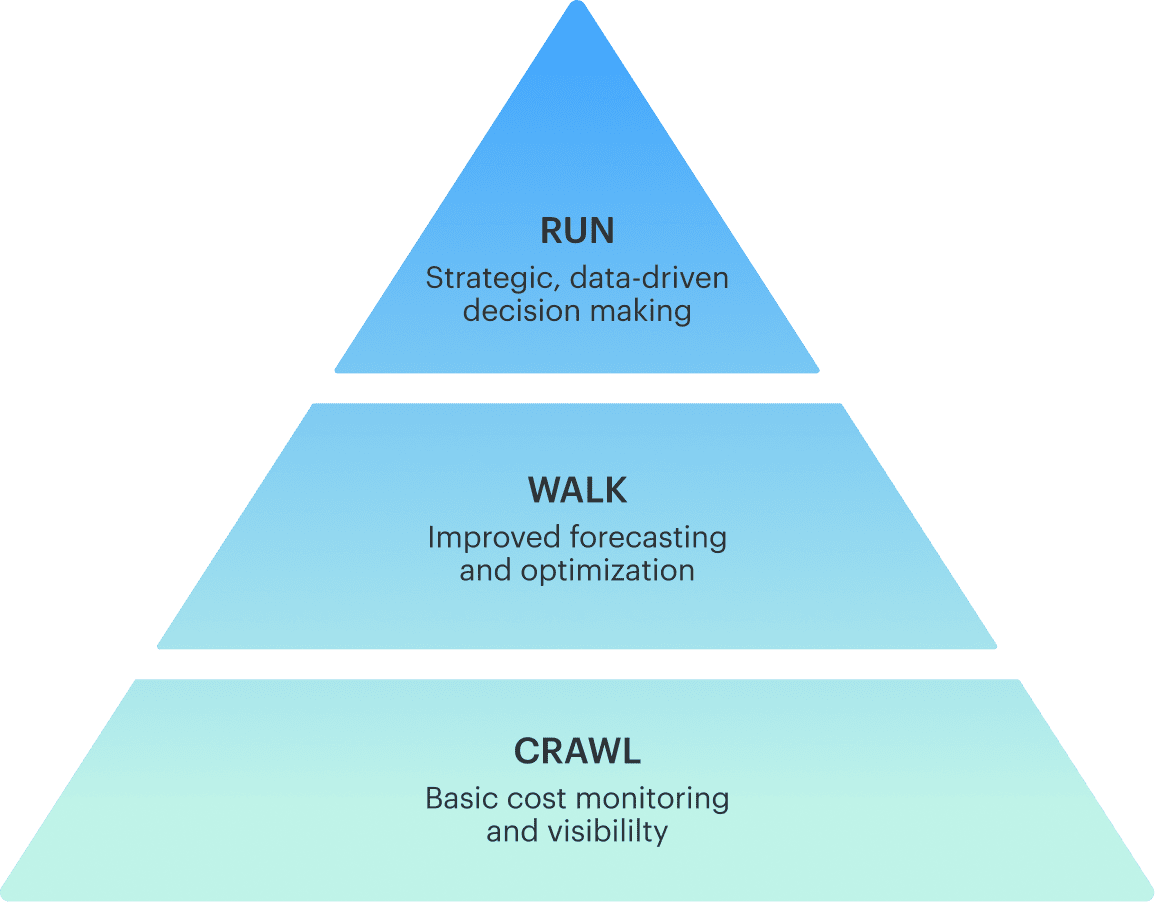
Cloud costs keep rising across AWS, Azure, and GCP because modern orgs ship faster than they govern. According to SQ Magazine, 82% of enterprises say cloud spending is higher than planned.
FinOps Foundation claims, cloud cost forecasting remains one of the least mature capabilities. Most organizations operate in the Crawl stage, where forecast variance is high and accuracy is difficult to maintain — especially in multi-cloud environments
FinOps cost optimization becomes less about saving money and more about creating a repeatable operating model that gives teams real visibility, ownership, and control.
Here’s how Cloudaware helps teams control and optimize cloud costs:
- Accurate cost allocation. Tags, accounts, CMDB context, and allocation keys turn raw cloud bills into traceable spend. Teams finally see their cloud usage — and can act on it.
- Optimization baked into delivery. Rightsizing, waste cleanup, power schedules, and commitment planning (RI/SP/CUDs) become part of the engineering workflow, not ad-hoc projects.
- Real-time anomaly detection. Spikes are routed to owners within minutes, preventing unplanned cloud spending from rolling into the invoice.
- Predictable forecasting. Usage trends, release cycles, and commitments feed into continuous cloud spend forecasting — tightening variance to ±10% or better.
- Shared accountability. Embeds cloud cost visibility into dashboards and KPI reviews so every team understands how their decisions impact cloud costs.
Read also: 10 Cloud Cost Optimization Tools That Actually Reduce the Bill in 2026