


As AWS environments expand across accounts, services, and teams, engineers often lose clear visibility into what actually drives cloud spend.
CUR files grow to millions of records, Cost Explorer provides only partial attribution, and tagging inconsistencies make allocation unreliable.
As a result, platform and FinOps teams spend hours reconstructing cost drivers, debugging unexpected charges, and trying to map AWS billing data back to applications, owners, and environments.
This article addresses that exact problem. It explains how AWS cloud cost management works at the data level, how AWS calculates costs, and how visibility, allocation, controls, and optimization fit together.
You’ll learn:
- How to set up AWS cost management correctly
- Which KPIs matter for engineering operations
- How to standardize tagging and governance
- Where AWS-native tools are sufficient, and where they fall short
- How teams extend AWS capabilities with third-party tools
Who this guide is for (And what you’ll get)
AWS cloud cost management usually becomes a priority only after teams have already scaled past the point where ad-hoc dashboards and monthly reports work. This guide is for the people who operate in that reality — where AWS costs need to be tied back to real workloads, ownership needs to be explicit, and engineering decisions have financial impact whether teams think about it or not.
If you’re a FinOps practitioner, you’ll find a clearer way to translate raw AWS billing data into allocation, KPIs, and repeatable review cycles.
If you’re a platform or DevOps engineer, you’ll learn how AWS cost management fits into everyday operational work — from tagging and CUR configuration to building cost-aware environments.
If you’re a cloud architect or engineering manager, you’ll see how governance, account structure, and service design influence spend more than any optimization script ever will.
Typical AWS cloud cost management challenges in growing organizations look the same almost everywhere:
- Dozens of AWS accounts, but no single view of what they’re spending
- CUR files that land in S3 but nobody fully trusts
- Cost Explorer charts that don’t line up with internal reports
- Shared services (NAT, load balancers, logging) nobody can allocate cleanly
- Tagging standards that exist on paper, not in production
Most teams hit these issues long before they have a shared definition of what “AWS cloud cost management” actually is. Some treat it as budgeting, others as tagging, others as optimization, and AWS itself uses a different terminology that mixes billing data, financial governance, and engineering workflows.
Read also: 7 Cloud Cost Management Challenges and How to Fix Them
What cost management in the AWS cloud actually means
Most teams think they’re doing cost management in the AWS cloud when they check Cost Explorer once a month or drop a budget alert on an account.
That’s not cost management — that’s damage control. Real AWS cost management starts way lower in the stack, with how AWS meters usage, applies pricing, and pushes line items into CUR. If you don’t understand that pipeline, nothing else will ever add up.
In practical terms, cost management for AWS cloud is about making AWS spend behave like the rest of your engineering systems: predictable inputs, predictable outputs, and no surprises. It’s less “finance dashboard” and more “debugging why a service suddenly doubled in cost at 2am.”
AWS cloud financial management vs Cloud cost management
AWS uses “CFM” as the umbrella term for visibility, allocation, governance, and optimization. Traditional cost management is just the visibility slice.
CFM is the whole loop — getting the data, assigning ownership, fixing the issues, and keeping the system from drifting. Cloud cost management tells you the numbers; CFM tells you what to do with them.
The four core activities: Measure, allocate, optimize, govern
Think of cost management like a feedback loop you keep running:
- Measure: Get clean CUR data and validate it
- Allocate: Tag it, categorize it, attach owners
- Optimize: Resize, shut down, move workloads
- Govern: Build guardrails so you don’t end up doing the same cleanup again next month
If you skip a step, the whole thing collapses.
Read also: Cloud Cost Optimization Framework: 11 Steps to reducing spend in 2026
Data flows behind cost management in the AWS cloud
Everything starts with AWS billing. AWS meters usage per service, slaps pricing on it, then writes detailed records into CUR. CUR becomes the real source of truth for AWS cost data — Cost Explorer is basically a UI on top of summaries.
If the CUR is wrong, everything downstream is wrong: dashboards, KPIs, forecasts, everything. Understanding this pipeline is non-negotiable. This is where cloud cost signals actually originate inside AWS.
Once you understand how AWS turns usage into the CUR dataset, the next question is:
What do we actually use to work with this data?
The building blocks of AWS cloud cost management
Once you understand how AWS billing produces the raw line items that feed CUR, the next step is knowing which AWS components you actually depend on. AWS doesn’t give you a single “cost management console.” Instead, it gives you a handful of primitives — and real cloud cost management is just wiring these pieces together so they stop contradicting each other.
If these building blocks aren’t configured correctly, no dashboard, FinOps workflow, or “cost optimization sprint” will fix your AWS cloud visibility issues. Here’s what teams actually rely on when turning raw cost data into something engineers can trust.
AWS CUR and detailed costs data
AWS Cost and Usage Reports (CUR) is the backbone of AWS costs insight. Every priced event flows here — usage type, region, discounts, RI/SP amortization, savings, credits, taxes, everything.
Why CUR matters:
- Most detailed dataset AWS provides
- Queryable via Athena, Glue ETL, or BigQuery export
- Allows per-resource, per-hour, per-operation analysis
- Enables reliable cost allocation and historical audits
If CUR is misconfigured (wrong granularity, missing columns, incorrect billing bucket permissions), everything downstream breaks — dashboards, KPIs, forecasts, anomaly detection.
AWS Cost Explorer for cloud cost analysis
AWS Cost Explorer (CE) sits on top of CUR but isn’t a replacement. It’s intentionally simplified so teams can get answers quickly without writing SQL.
| Feature | CUR | Cost Explorer |
|---|---|---|
| Data completeness | Full detail | Summarized |
| Performance | Slower (Athena, ETL) | Fast UI |
| Attribution accuracy | High | Medium |
| Engineering debugging | Best | Limited |
| RI/SP details | Full amortization | High-level |
| Third-party ingestion | Yes | No |
Tip: Use CE to spot problems. Use CUR to solve them.
Tagging & Cost categories: the only way allocation works
Tags assign ownership. Cost Categories assign structure. Without both, cost management for AWS cloud doesn’t work — you just have prettier charts of “unallocated.”
What teams actually tag:
app,service,owner,environmentcost-center,product,team,lifecycle
What Cost Categories fix:
- Inconsistent tag values
- Shared services attribution
- BU-level groupings
- Mapping messy real-world infra to clean views
Step-by-step: How to set up AWS cloud cost management in your org
Setting up cost management for AWS cloud isn’t a single switch, so each step fixes a blind spot, and skipping any of them guarantees you’ll spend the next six months trying to reconcile reports instead of fixing real issues.
Before we start: this step-by-step setup works best when you treat cost management as an engineering system, not a finance project. AWS gives you billing data, but correctness depends on ownership, tagging, and consistent review cycles.
Step 1. Map your AWS accounts and ownership
This is the part nobody wants to do but every mature team starts with. You can’t manage costs across a multi-account footprint if you don’t know which workloads live where or who owns them.
What to inventory:
- Every account (prod, dev, test, sandboxes, shared services)
- Who owns it: team, service, or environment
- Access model: root, IAM roles, SCP boundaries
- Billing model: member vs payer account
Read also: Dependency mapping between CIs: 5-steps strategy to map infrastructure
Step 2. Build a tagging and cost allocation model
Tagging is where theoretical cost management becomes real. AWS requires you to activate cost allocation tags before they appear in CUR or Cost Explorer.
Your model should define:
- Required tags:
app,service,env,owner,cost-center - Allowed values (normalize them; engineers love inventing new ones)
- Enforcement strategy (CI/CD, OPA, tag policies in AWS Organizations)
- Exceptions and non-tag-based attribution (shared NAT, VPC endpoints, etc.)
Read also: 7 Cloud Cost Allocation Strategies from FinOps Experts
Step 3. Enable AWS CUR
CUR is the canonical dataset for AWS spend. AWS explicitly states that CUR is “the most detailed source of AWS billing information.”
Checklist for correct CUR setup:
- Delivery: daily (hourly if you have fast-changing workloads)
- Format: Parquet
- Enable resource IDs
- Validate S3 bucket permissions (common source of silent failures)
- Confirm the data dictionary includes operation, product, discount, amortization fields
Tip: This is where AWS billing becomes aws cost data you can actually trust. Everything else like Cost Explorer or Athena queries depend on this dataset being correct.
Step 4. Configure AWS Cost Explorer dashboards
Cost Explorer isn’t perfect, but it’s the fastest way to sanity-check spend patterns before diving into CUR.
Set up views for:
- Cost by account
- Cost by service
- Cost by tag (app, env, owner)
- RI/SP coverage & utilization
- Daily spikes or anomalies
- Shared services (NAT, LBs, CloudWatch logs)
Tip: CE gives quick, high-level cloud cost signals — the “is something weird happening?” layer of AWS cost management. When something doesn’t add up, you drop into CUR for the truth.
Step 5. Set AWS Budgets and anomaly detection
Budgets aren’t optimization tools and they’re hugely useful once your accounts and tagging are structured.
Important AWS details:
- You can create cost, usage, and RI/SP coverage budgets
- Alerts integrate with SNS, email, Slack (via Lambda)
- Budget thresholds can be absolute or forecast-based
Pair this with Cost Anomaly Detection:
- Machine learning model
- Detects gradual drifts, not just big spikes
- Works across accounts and tags
Read also: Cost Anomaly Detection: 6 Steps to Catching Cost Spikes Fast
Step 6. Establish weekly and monthly cost review cadences
Weekly reviews:
- Top spend changes
- Unexpected tag drift
- Idle resources
- New workloads with unallocated spend
Monthly reviews:
- Shared service reconciliation
- Commitment planning (RI/SP/CUD)
- KPI updates
- Forecast drift and contributing factors
Tip: If you don’t build a cadence, cost management becomes random firefighting. With it, the process becomes a normal piece of engineering management, not a financial chore.
KPIs and visibility metrics
Mature teams narrow their focus to a small set of metrics that consistently reveal drift, inefficiency, and engineering misalignment. These KPIs aren’t financial artifacts; they’re operational indicators that show how workloads behave and where money goes when they shouldn’t.
AWS exposes an enormous amount of telemetry through CUR, but only a few dimensions reliably predict changes in AWS costs, surface architectural problems, or correlate with real engineering work.
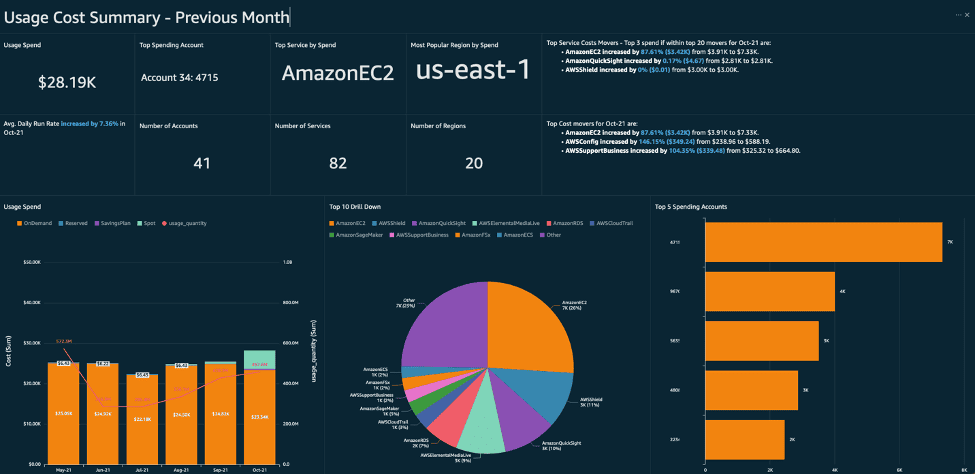
Tracking total AWS costs across accounts
This is the top-level “health check.” Total cost should correlate with deployments, traffic, or known scaling events. Sudden changes usually indicate:
- Missing or broken tags
- Unallocated shared services
- Unexpected resource creation
- Pricing-model changes
AWS recommends tracking high-level cost trends before diving into granular data to isolate anomalies quickly.
Unit economics: cost per environment or workload
AWS Well-Architected stresses defining KPIs that map to business outcomes, not just system metrics. Unit cost does exactly that.
| KPI | What It Tells You |
|---|---|
| cost per request | whether a service is scaling efficiently |
| cost per tenant / customer | how multi-tenant workloads behave |
| cost per GB processed | whether data workflows are stable |
| cost per deployment | cost impact of release cycles |
Utilization metrics for Reserved Instances
AWS provides dedicated RI utilization and coverage metrics because they determine financial efficiency. Typical indicators:
- Low utilization → workloads drifted from committed instance families or regions
- Low coverage → missed savings opportunities
- High coverage + low utilization → overcommitment
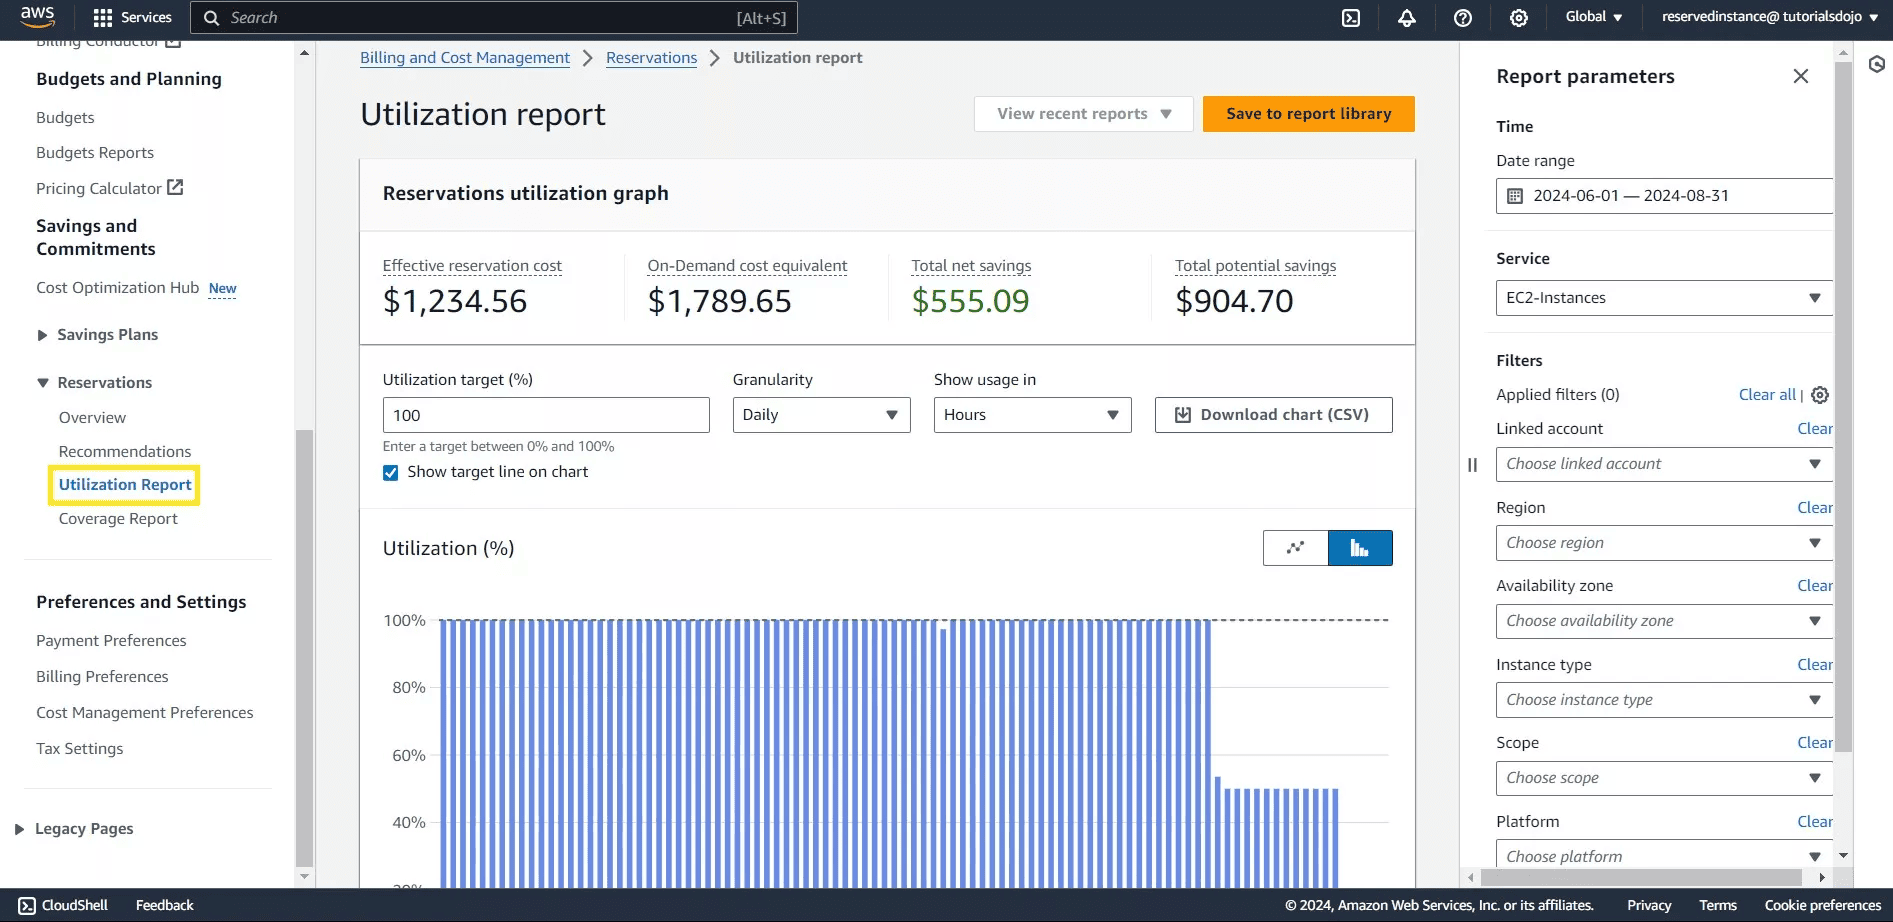
These KPIs are included in AWS’s built-in cost reports and are essential for predictable long-term cloud cost behavior.
Monitoring Spot Instances and workload efficiency
Spot usage KPIs show whether workloads are truly interruptible and whether compute efficiency is improving. Key signals:
- % of compute running on Spot
- Spot interruption rate
- Variance between requested vs actual usage
AWS EC2 Spot documentation highlights tracking both usage and interruption patterns to validate workload suitability.
Read also: 27 FinOps KPIs to Get the Most from Your Cloud Spend
Best practices for AWS cloud cost management
AWS makes it clear that cost management is not something you bolt on after workloads scale — it’s part of how you design, operate, and govern cloud environments.
The practices below reflect what AWS calls the “structural elements” of governance: the combination of tagging, account architecture, KPIs, and automated controls that allow AWS cloud cost management to stay predictable as new services and teams enter the picture.
Improve cloud visibility and ownership alignment
Visibility is useless unless someone owns the resources behind the number. This practice ensures engineering teams know: Which workloads generate which costs, who is responsible for each account or service, and which shared components must be allocated consistently.
Why it matters: Without ownership, trends in cost management become noise. With ownership, cost signals turn into engineering tasks instead of mysteries.
Enforce tagging and lifecycle management policies
Tags are the only scalable way to connect spend to workloads. Lifecycle rules prevent stale artifacts from silently accumulating cost.
Enforce:
- Required tags (
service,env,owner) - CI/CD checks to block untagged deployments
- Automated cleanup of snapshots, logs, and unused AWS resources
Automate AWS cost reviews and reporting
- Weekly spend deltas and anomaly detection
- Monthly RI/SP commitment reviews
- Notifications for unallocated or unexpected AWS spend
- Scheduled CUR-based reporting for engineering teams
Why it matters: Manual reviews break at scale. Automation ensures that cost signals surface before they turn into production issues. This creates the operational heartbeat that keeps optimization work predictable instead of reactive firefighting.
Cost allocation & Chargeback models for AWS cloud
AWS positions allocation as one of the core pillars of a cost management strategy because every downstream activity depends on it: forecasting, anomaly detection, KPI accuracy, budgeting, and ownership.
Allocation also acts as the bridge between engineering and finance. Engineers own the workloads. Finance owns the budgets. Leadership owns the outcomes. This is why AWS explicitly recommends establishing an allocation model early, long before any formal optimization or governance program is introduced.
Mapping AWS costs to teams, apps and environments
AWS exposes several structural tools to map spend to ownership:
- Tags for resource-level attribution
- Cost Categories for business-aligned grouping
- Accounts / OUs for clean isolation boundaries
- CUR for granular hourly line-item analysis
When allocation is correct, teams can run chargeback, forecast per-service spend, identify workload drift, and understand the cost impact of deployments. When allocation is wrong, cost dashboards become noise and operational reviews break down.
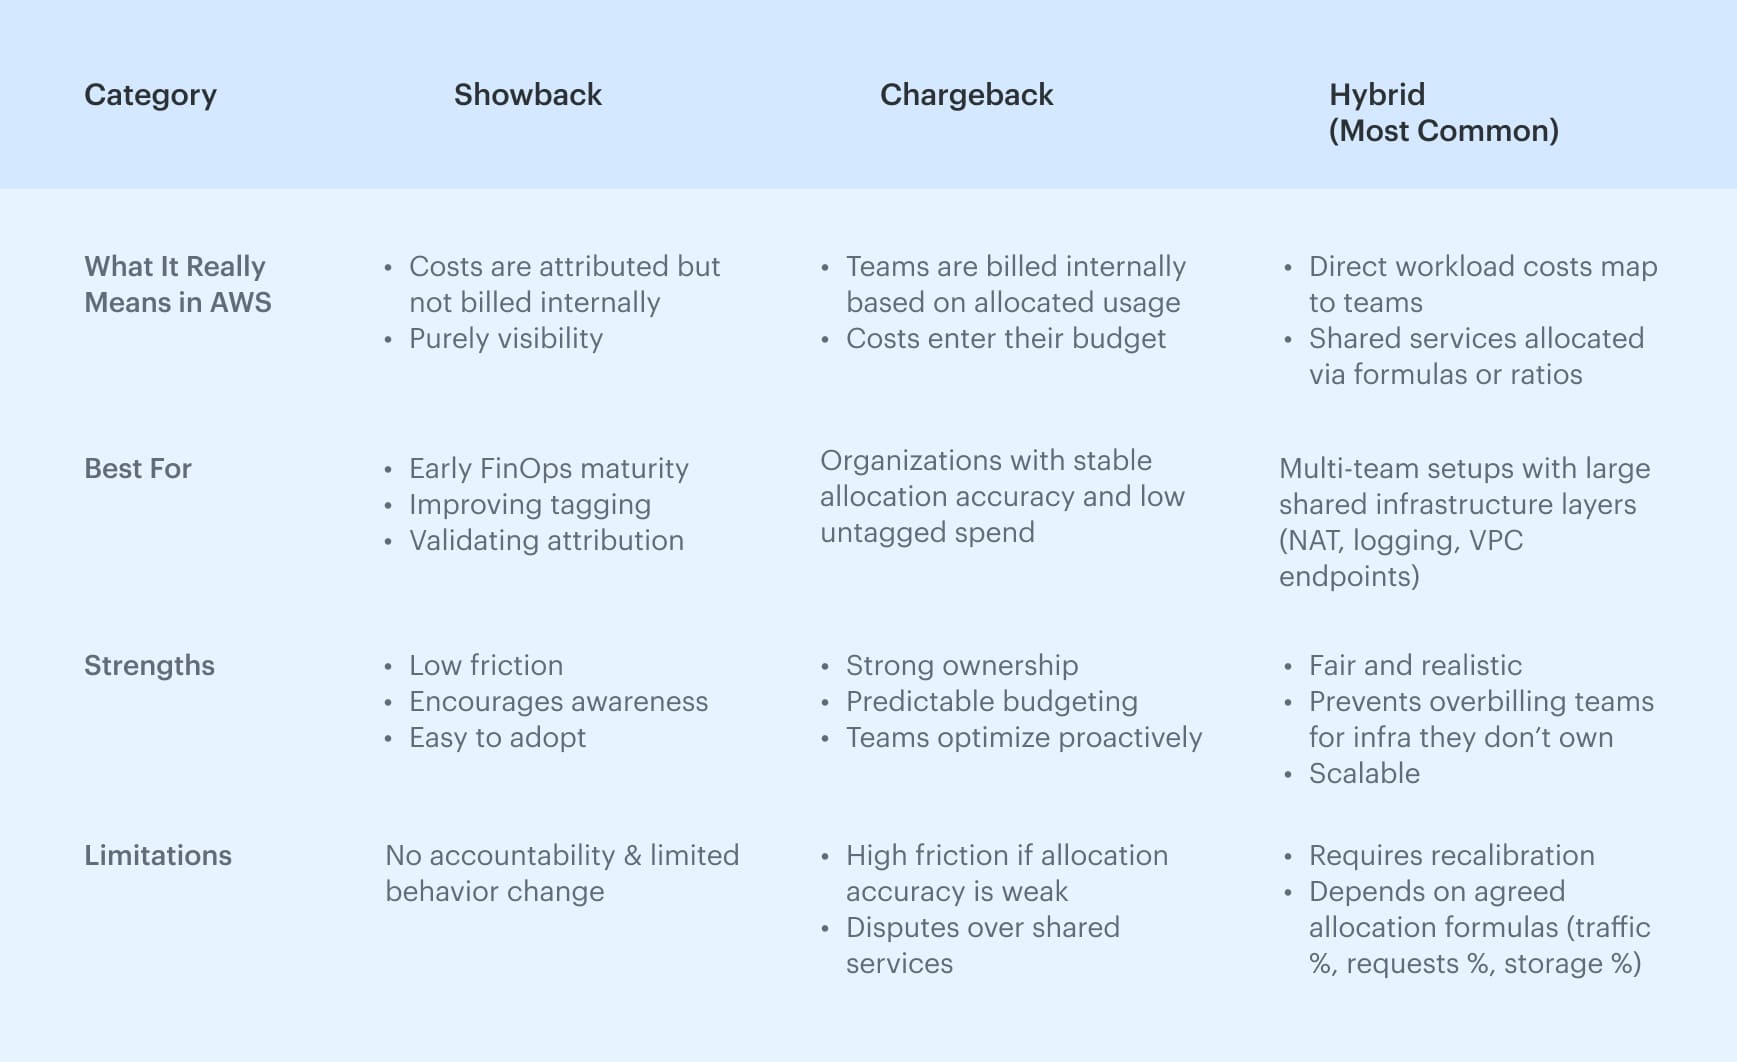
Chargeback, showback, and hybrid methods
Once allocation is reliable, organizations choose how to expose the costs internally. Each model supports a different level of accountability and maturity.
Native cloud cost management AWS tools
Each tool covers a different part of the cost lifecycle: visibility, guardrails, anomaly detection, or operational checks. Taken together, they form the baseline every team uses to understand aws cost, monitor patterns, and prevent unexpected cloud cost drift.
AWS Cost Explorer for cloud cost visibility
Cost Explorer is basically the dashboard everyone opens first when the bill looks off. It’s not deep, but it’s quick: you can slice spend by service, account, or tag and usually tell within a minute whether a spike is real or just a timing quirk. Most engineers I know use it as a quick sanity check before touching CUR or Athena.
Best for: quick spend sanity checks, seeing which service blew up, confirming whether tags landed where they should.
AWS Budgets and cost controls
Budgets are straightforward: set a threshold, wire up alerts, and let AWS tell you when something drifts. Nothing fancy, but it’s good at catching issues early enough that you can still do something about them. Most teams plug Budgets into Slack or SNS → Lambda and call it a day.
Best for: simple guardrails, spotting month-to-month drift early, and giving teams a “heads up” before finance notices.
AWS Cost Anomaly Detection for financial monitoring
Anomaly Detection looks at past spend patterns and calls out anything that doesn’t behave the way it usually does. It’s a lot better than static alerts because it catches the slow, weird cost climbs you don’t see until it’s too late. If you run multiple accounts or have workloads that change shape a lot, this thing earns its keep.
Best for: early warning on unexpected trends, cutting down manual cost-watching, and finding anomalies across big AWS orgs.
Trusted Advisor for resource and cost checks
Trusted Advisor is basically AWS saying, “Hey, here are the obvious things you forgot about.” Idle load balancers, old volumes, stray Elastic IPs — the usual cleanup list. It won’t solve your cost strategy, but it does surface the low-hanging junk that tends to pile up when no one’s looking.
Best for: quick cleanup passes, catching obvious waste, and making sure low-effort fixes don’t get ignored.
Third-party cloud cost management AWS platforms
Native AWS features give teams visibility, guardrails, and basic financial monitoring — but they don’t solve the deeper challenges of large-scale cost management.
As environments grow across accounts, business units, and shared infrastructure layers, teams eventually need richer analytics, multi-cloud views, CMDB context, stronger allocation accuracy, and automated workflows.
This is where third-party platforms complement cost management rather than replace it. These platforms extend what CUR and CE already provide by adding correlation, normalization, governance workflows, and engineering context that AWS tooling does not attempt to solve natively.
How third-party platforms fill the gaps
AWS-native tooling is excellent for baseline visibility, but teams eventually hit structural limits. These gaps aren’t bugs — they’re simply areas AWS doesn’t try to solve, because they require organizational context, cross-cloud modeling, or CMDB-level understanding.
Below are the use cases where third-party platforms meaningfully extend AWS cloud cost management:
1. When teams need application-, team-, or environment-level allocation
Native tools only support tags, accounts, and Cost Categories. Third-party platforms add cost allocation tied to CMDB relationships, metadata, and real ownership.
External tool: Cloudaware ties CUR line items to CMDB configuration items, automatically mapping costs to applications, services, teams, and environments. This allows accurate allocation even when tags are missing, inconsistent, or incomplete.
2. When organizations run multi-cloud (AWS, Azure, GCP, Oracle)
AWS Cost Explorer is AWS-only. Engineering leadership needs one unified view of cloud cost across providers.
External tool: Cloudaware ingests AWS CUR, Azure Cost Management exports, and GCP Billing data, Oracle Cloud Cost and Usage Reports (OCUR) into a single normalized analytics layer. This gives engineering and finance one unified view of spending across all clouds without manual stitching.
3. When engineering needs resource context, not just spend
CUR shows what was billed and not:
- How resources relate
- Which workloads depend on others
- Whether the architecture drifted
- How cluster/service/database components map together
External tool: Cloudaware enriches AWS cost data with CMDB resource metadata and relationships, showing how resources connect across services, clusters, databases, and network components. This turns billing line items into actionable insights tied to real workloads and architecture.
4. When anomaly routing matters, not just anomaly detection
AWS Cost Anomaly Detection flags issues, but:
- Doesn’t know who owns the impacted resources
- Can’t open tickets
- Can’t route anomalies to the right team
- Can’t group anomalies across clouds
External tool: Cloudaware links cost anomalies to service and environment owners using CMDB metadata and automatically routes alerts into Jira, Slack, or email. Each anomaly includes context about impacted resources and ownership, reducing investigation time.
5. When organizations operate shared services
AWS-native tools cannot automatically allocate:
- NAT Gateway
- VPC endpoints
- central CI/CD
- monitoring/logging stacks
- internal load balancers
- shared EKS clusters
External tool: Cloudaware supports custom allocation rules using CMDB data and usage signals to distribute shared costs like NAT, logging, or platform services. This ensures fair cost attribution without relying solely on tags or manual spreadsheets.
Comparison: AWS native tools vs external tooling
✅ Strong support
⚠️ Partial / limited support
❌ Not supported
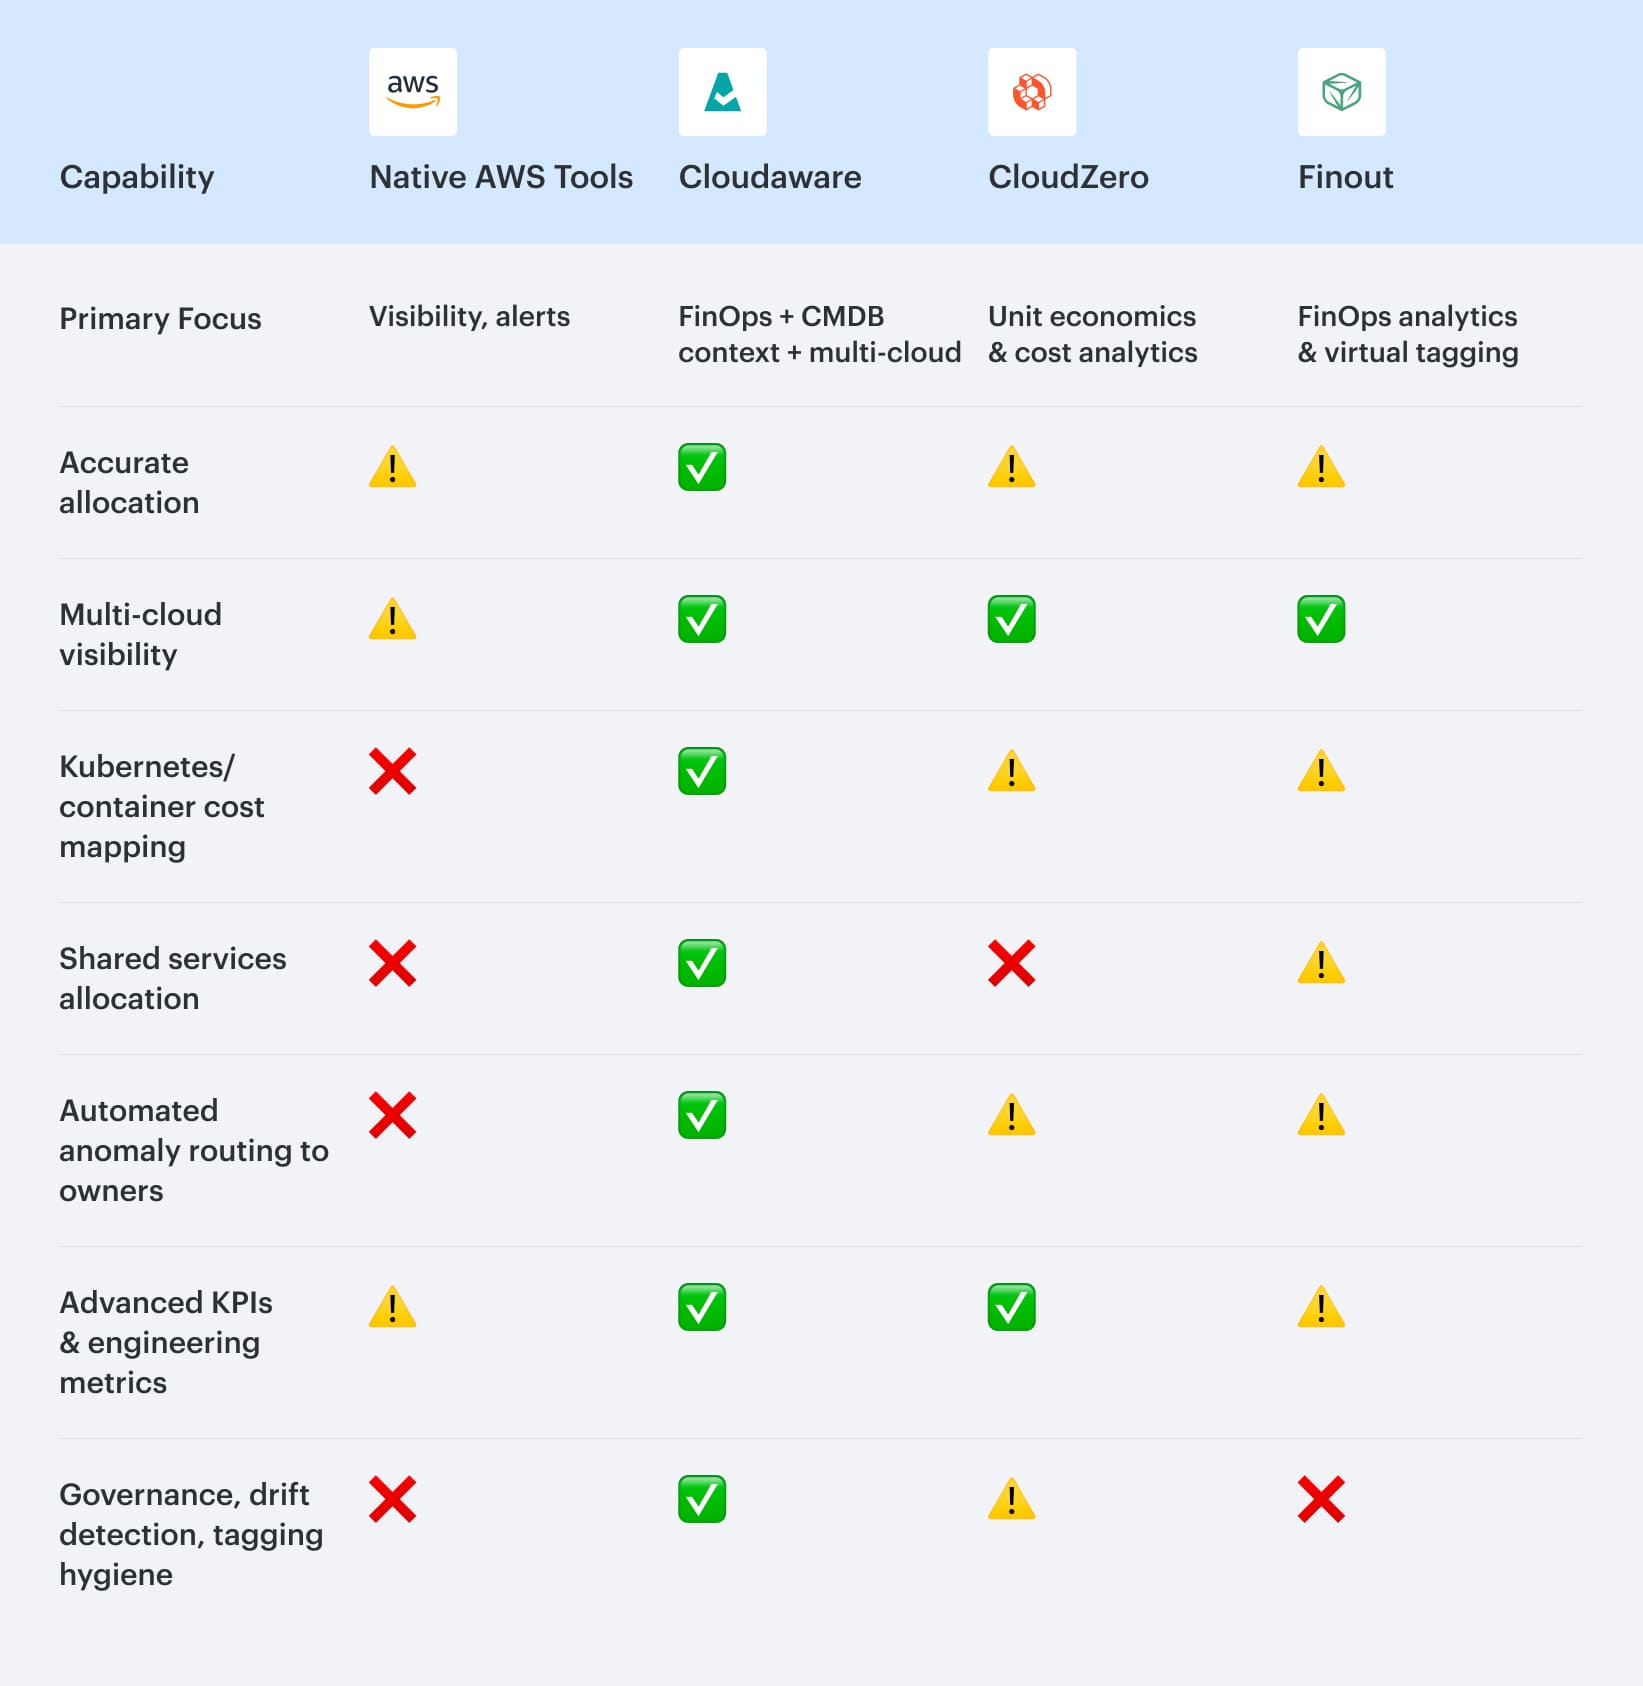
The comparison makes one pattern obvious: AWS-native tools provide the data foundation, but not the organizational or engineering context needed at scale. They surface spend, but they don’t explain it, and they can’t enforce ownership or allocation.
Cloudaware stands out because it layers CMDB intelligence on top of CUR, giving teams the missing context. This is what unlocks accurate allocation, Kubernetes cost mapping, shared-service distribution, and owner-based anomaly routing.
CloudZero excels when you’re looking at cost through a business or unit-economics lens. It does that very well, but it doesn’t go as deep into infrastructure context, which becomes noticeable in larger or Kubernetes-heavy AWS environments.
Finout’s strength is its flexible “virtual tagging” and business context modeling. But without CMDB-level relationships, it’s harder for the tool to follow costs all the way back to the underlying infrastructure or workload boundaries.