


Cloud cost analysis is a control problem as much as a reporting problem. In multi-cloud environments, teams usually have billing data, but not always a stable way to reconcile allocation, effective cost, and ownership across AWS, Azure, GCP, and Kubernetes.
That gap shows up under pressure. Flexera’s 2025 State of the Cloud found that 84% of respondents identified managing cloud spend as the top cloud challenge.
The same pressure is visible in the way FinOps operating models are evolving. The FinOps Foundation’s 2025 Framework update added Scopes as a core element, formalizing the need to manage spend in a business context rather than only through raw account structure.
We built this playbook from the trenches. Real FinOps managers, DevOps leads, and cloud architects at Cloudaware shared what works, drawing on experience from real environments. We also folded in lessons from more than a decade of platform work, client operating patterns, and public benchmarks.
TL;DR
- Cloud spending stays explainable only when billing exports, allocation rules, and ownership data are stable across AWS, Azure, GCP, and Kubernetes
- Cost reviews should move beyond totals and focus on daily deltas, service-level changes, effective cost, and owner-level accountability
- The most useful FinOps dashboards combine filters, variance views, commitment metrics, unit cost, and links back to the underlying resource or workload
- Waste detection, rightsizing, forecasting, and governance should run as one operating model rather than separate reporting exercises
- Cloud spend optimization holds longer when teams connect analysis to routing, remediation, budget thresholds, and policy controls
What is cloud cost analysis?
Cloud cost analysis is the process of examining cloud spend, usage, pricing, and allocation data to understand where spend is going, what is driving changes, and how to optimize cloud costs without hurting performance.
For FinOps teams, this is the layer where billing data becomes operational: cost analysis connects cloud cost, ownership, pricing, and service context so teams can explain changes, validate allocation, and decide what to do next.
What cloud cost analysis includes
In practice, cloud cost analysis usually covers:
- Cost allocation: provider, account, subscription, team, application, environment, business unit
- Cost drivers: compute, storage, data transfer, databases, managed services, Kubernetes
- Pricing layers: on-demand, Reserved Instances, Savings Plans, spot, licensing discounts
- Change analysis: daily deltas, anomalies, waste patterns, commitment drift, forecast variance
A useful cost review should quickly show which cloud costs moved, which services drove the change, whether pricing or plans affected effective cost, and where cloud spending needs further review.
Cloud spend analysis vs. cloud spend analytics
These terms are related, but they support different parts of the cloud spending review.
| Focus | Cloud spend analysis | Cloud spend analytics |
|---|---|---|
| Main use | Investigation | Monitoring |
| Typical output | Root cause | Dashboard view |
| Best for | Deltas, anomalies, effective cost | Trends, forecasts, reporting |
Connect AWS/Azure/GCP billing exports for cloud cost analysis
Reliable cloud analysis starts with billing data that is complete, current, and usable for allocation. If exports are delayed, flattened, or missing resource detail, cost analysis breaks early: cloud costs cannot be traced by service, team, pricing model, or commitment coverage.
What billing exports need to support cost analysis
For billing exports to support cost analysis, they need enough detail to trace cloud spend by service, region, pricing model, and owner. At minimum, that means:
- line-item costs and usage;
- resource IDs where available;
- pricing and discount columns;
- service and region dimensions;
- allocation-ready fields such as account, tag, team, or application.
AWS
AWS billing exports should support resource-level cloud cost analysis. Teams need enough detail for instances, services, pricing, and commitment analysis.
Use Cost and Usage Reports with:
- Hourly granularity
- Resource IDs enabled
- Amortized, blended, and unblended cost columns
- Parquet output for downstream analytics
- Read-only cross-account role for ingestion
Azure
Azure export data should support daily cost analysis by subscription, service, and scope.
Use Cost Management + Billing Export to a Storage Account with:
- Actual Cost export type
- Daily frequency
- Cost Management Reader and Reader roles at subscription scope
GCP
GCP exports need enough detail for service-level review and instance-level attribution where possible.
Use BigQuery Billing Export with:
- Daily, partitioned export
- Billing-account scope
- Full line-item granularity
- Add
instance-namelabels to VMs for instance-level cost attribution
That’s the foundation. And now it’s time to make that spend mean something 👇
Define ownership with tags and CMDB Scopes for accurate cost allocation
Accurate cost analysis depends on ownership data that holds up under review. When tags drift or allocation logic is incomplete, cloud costs stop mapping cleanly to applications, services, and business units. That is where spend analysis starts to slow down: finance sees unallocated costs, service owners challenge the numbers, and forecasts become harder to defend.
A practical allocation model should reflect how cloud costs are reviewed in the business. At minimum, define:
- Application or instance group: mapped instance set, service/workload name
- Environment: prod, dev, staging
- Owner: direct point of contact
- Business unit or cost center: financial owner
CMDB relationships help close the gaps when native tags are missing, inconsistent, or too shallow for service-level reporting.
Why Scopes matter
Scopes are reusable cost groupings built around business ownership, such as team, application, environment, or business unit. They let FinOps teams review cloud costs in a structure that matches planning, forecasting, and accountability.
A Scope can represent:
- All production workloads in EMEA
- Every resource tagged
bu=marketing - Every payment service mapped to a single owner group
That structure makes showback, chargeback, and forecast review more reliable. It also gives teams a shared view of cloud costs across accounts, services, and environments, which improves cost management and reduces allocation disputes.
Read also: FinOps Personas - Roles, RACI, and KPIs for Real Teams
Build a cross-cloud cost dashboard with filters, trends, and unit economics
Most “cloud dashboards” fall apart the second someone asks, “Which team owns this spike?” or “Why is our unit cost up 14%?”
A usable dashboard should help FinOps teams generate insights, not just display cloud costs. Once billing data is normalized across AWS, Azure, and GCP, the next requirement is a view that holds up under review: one that supports analysis by owner, service, environment, and pricing layer, and makes cost movement easy to trace.
Required filters
A cross-cloud dashboard should filter cleanly by:
- Cloud provider
- Account or subscription
- Region
- Scope
- Service
- Environment
- Application or workload
- Owner
Those dimensions make cloud costs easier to review across teams and services without rebuilding the same cuts for every monthly report, budget check, or anomaly review.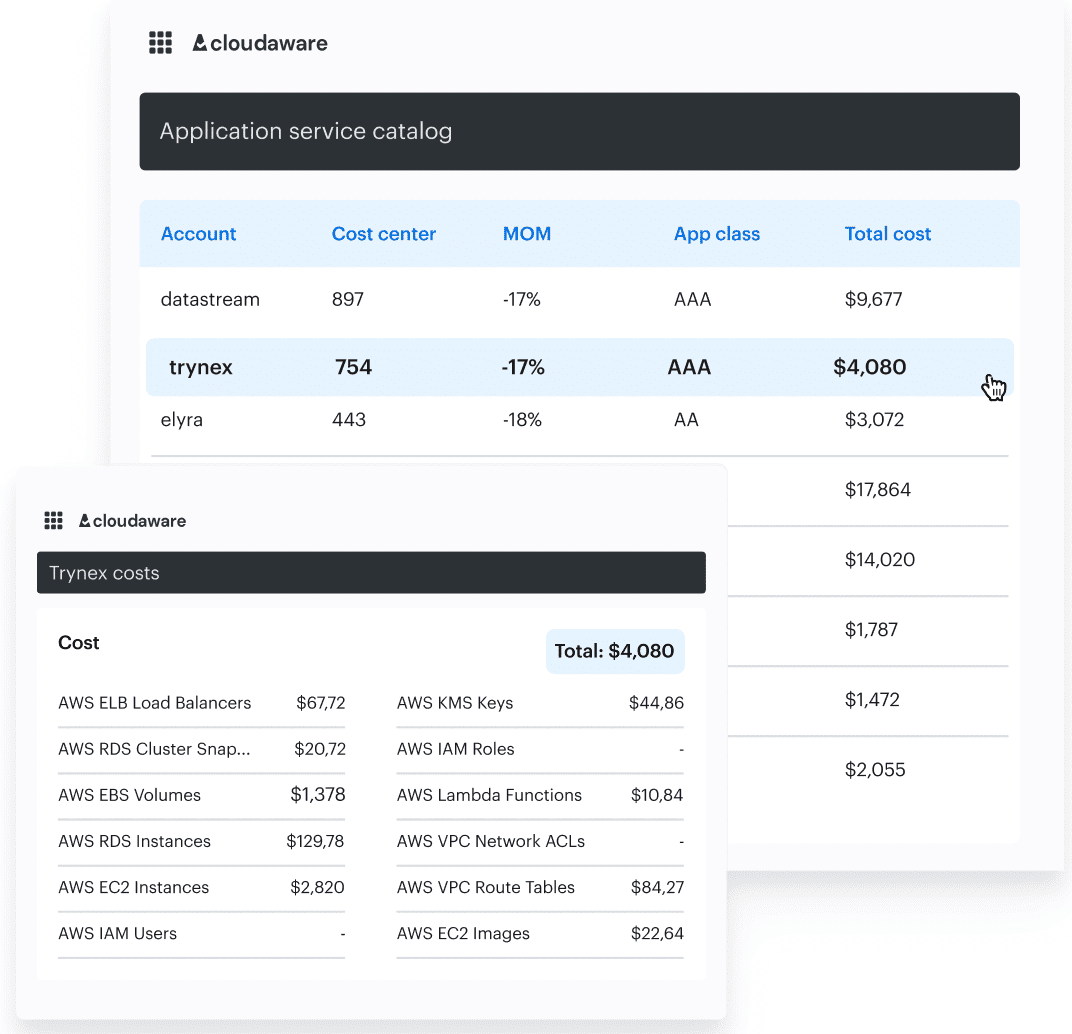 Example of the Cloudaware FinOPs dashboards with CMDB-enriched data.
Recommended dashboard layout
Start with views that help teams spot change, isolate impact, and compare current costs against recent patterns:
- Spend today vs 7-day average
- MTD spend vs previous month
- Week-over-week change by Scope
- Top daily deltas by Scope, service, and region
- Forecast vs actual
- Unallocated cost percentage
- Commitment effective rate
- Cost per request, user, build, job, instance hour, or GB stored
Each view should link back to the underlying resource, service, or owner group. Trend analysis also gets more useful when cost changes can be read alongside deployment events, RI or Savings Plans purchases, infrastructure changes, and policy exceptions.
Read also: 6 FinOps Domains - The Essential Map For Cloud Spend Control
Investigate daily spend spikes
A “Why is our spend up 12%?” email from Finance usually means the anomaly review started too late. Daily delta analysis gives FinOps teams an earlier view of cloud expenditures, before a variance turns into a budget issue or escalation.
Daily deltas and cost spike analysis are a foundational part of anomaly detection, as FinOps experts like Mike Fuller and J.R. Storment point out. In practice, spikes usually come from demand shifts, pricing, scope, ownership, or commitment changes.
A practical 5-step investigation workflow
A practical workflow looks like this:
- Open daily changes and filter for material variance
- Zoom into the affected Scope
- Drill into service and region
- Identify the exact resource, SKU, or usage delta
- Route the finding through Jira or Slack
Spikes are also rarely isolated events. The same review often surfaces adjacent issues such as idle instances, overprovisioned services, or forgotten storage that continue adding cloud costs after the initial change.
Next, we’ll show you how to turn those signals into savings 👇
Detect waste and quantify savings with policy-driven recommendations
Many cloud expenses do not show up as obvious spikes. They build through idle instances, unattached storage, oversized services, and non-production sprawl that stays in the environment longer than planned. This is where waste detection becomes a practical part of cost analysis, not just a periodic cleanup task.
Reducing waste before deeper pricing work is a common FinOps pattern, and Mike Fuller calls this “removing gravity before adding wings.” In practice, teams need a repeatable way to find low-value costs across accounts, regions, and services before the spend compounds.
Common waste categories to analyze
Cloudaware runs a continuous policy scan against usage and billing data across AWS, Azure, Oracle, Alibaba, and GCP. Common patterns include:
- Unattached EBS volumes older than 7 days
- Idle Azure VMs with less than 5% p95 CPU over 14 days
- Underutilized Cloud SQL or RDS instances
- Overprovisioned Kubernetes requests versus observed demand on underlying instances
- Orphaned elastic IPs, snapshots, or load balancers
These checks are especially useful for storage waste, underused instances, and oversized managed services. They also matter later for audit evidence and FinOps accountability metrics.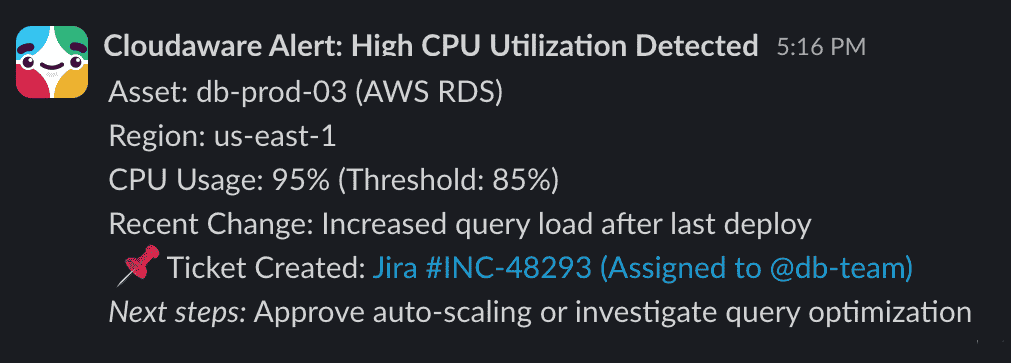 Example of the Slack notification from Cloudaware.
Each recommendation includes:
- Net savings estimate based on amortized cost
- Confidence rating based on historical p95 usage
- Risk flag for stateful workloads or downstream dependencies
Read also: 13 Cloud Cost Optimization Best Practices From Field Experts
Analyze RI/SP/EA commitments to calculate amortized “effective cost”
Cost analysis should measure real spend after discounts and commitments, not just the list price. That means comparing on-demand pricing with reserved capacity, Savings Plans, enterprise discounts, and spot usage at the level where teams actually review cloud costs.
So here’s how to do it right:
The three commitment metrics that matter
Three metrics matter most here:
- Coverage. The share of eligible usage covered by RI, Savings Plans, or other commitments
- Utilization. The share of purchased commitment value that is actually consumed
- Amortized effective rate. The real cost per hour, unit, or instance-backed service after discounts are spread across the term
These metrics are most useful when tracked by Scope rather than only at the cloud-account level. That is where commitment analysis starts to explain whether cloud costs are actually improving for a business unit, application, or service.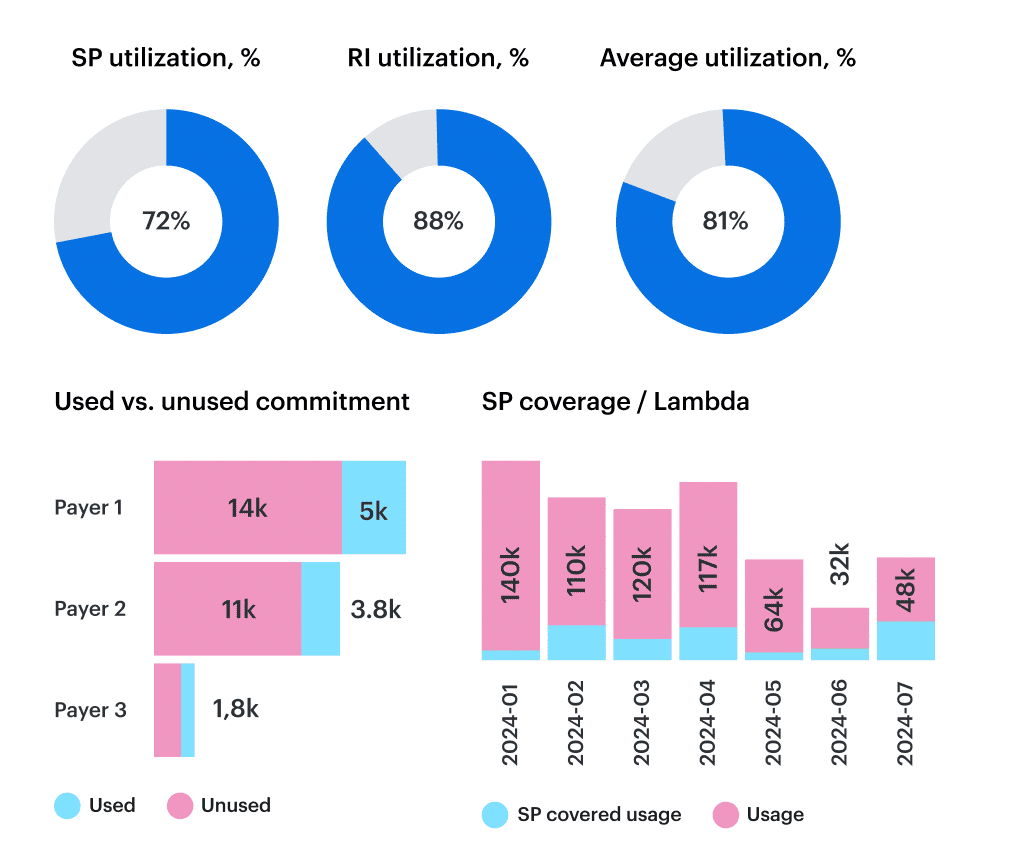 Element of the cloud spend optimization dashboard in Cloudaware.
That view helps surface cases like:
- AI experiments burst into on-demand instead of covered instance types
- Azure discounts drop after a region migration
- GCP commitments stay underused while spot is overused elsewhere
This is also where cloud cost optimization becomes easier to defend, because teams can connect plans, pricing, and effective cost to the workloads that actually consumed them.
Create forecasts and budgets, then monitor variance with threshold alerts
Cloud forecasting makes cloud cost analysis useful before month-end. Budgets, forecasts, and variance alerts help teams catch cloud costs that are moving off plan while there is still time to respond.
The FinOps Foundation makes it clear: at Walk maturity, every team with meaningful usage should own a budget, a forecast, and a variance alert.
A simple budget escalation model
A practical threshold model should trigger action before budget overrun becomes a reporting problem:
- 80%: Review the trend
- 90%: Validate assumptions and check recent service or usage changes
- 100%: Escalate, reforecast, and review the affected Scope
That structure gives teams a repeatable way to respond to budget pressure without waiting for a monthly cloud bill review.
Key metrics for cloud cost analysis
These formulas make forecast review easier to standardize across teams and Scopes:
- Allocation coverage %: Allocated cloud costs / total cloud costs × 100
- Forecast variance %: (Actual cost - forecast cost) / forecast cost × 100
- Unit cost: Total cloud costs/business volume
- Commitment utilization %: Consumed commitment value / purchased commitment value × 100
- Amortized effective rate: Total amortized cost / total covered usage units
If a team forecasts $48K and lands at $65K, the follow-up usually sits in one of four places: scale, instance sprawl, allocation drift, or a real change in service demand.
Map Kubernetes requests/limits to spend and rightsize without breaking SLOs
Kubernetes is the black box of cloud cost analysis. You do not just see “EC2 spend” or “GKE usage.” You see clusters, nodes, pods, and namespaces without a clean line to shared instances, spend, ownership, or service impact. When requests and limits are not tuned, teams usually end up with avoidable cloud costs or unnecessary performance risk.
To make Kubernetes cost analysis usable, teams need to connect requests and limits to billing data across AWS, Azure, and GCP, then review cloud costs by namespace, cluster, deployment, or business owner rather than relying on theoretical CPU-hour views.
What Kubernetes cost analysis should show
A useful Kubernetes cost analysis should show:
- Cost by cluster, namespace, deployment, and team
- Requests versus p95 usage over a rolling window
- Overprovisioned workloads
- Unit cost by application or service
- Rightsizing recommendations with risk context
Typical findings include over-requested deployments, inflated memory reservations, and workloads that remain within SLO even after lower targets are modeled.
For example, a payments-prod deployment may request 4 vCPU and use 1.2 at p95, while ml-training-staging pods reserve 16 GB RAM and average 4 GB.
Each recommendation should include a savings estimate, a risk rating based on p95 or latency thresholds, and a target configuration that can be reviewed before changes are applied. This helps teams connect cost optimization to workload behavior instead of treating Kubernetes as a separate cost problem.
Read also: What Is Rightsizing in Cloud Cost Optimization? Pro Insights
Automate reporting for teams
Scheduled reporting makes cloud cost analysis easier to act on. Stakeholders should not wait for month-end reviews to understand cloud costs, variance, or commitment performance. A repeatable reporting cadence gives teams a shared view of what changed, where attention is needed, and which actions are already in motion.
What finance usually needs
Finance needs repeatable cost reporting with ownership, variance, and commitment visibility. Monthly or MBR-ready summaries should support budget review, forecasting, and cost management without forcing teams to rebuild the same views every cycle. They usually include:
- Executive summary of top Scope variances
- Effective cost by cloud and business unit
- Forecast versus budget variance
- RI, Savings Plans, or EA utilization rollup
What engineers usually need
Weekly operational summaries work better for application and platform owners when they are delivered automatically through email, Slack, or reporting workflows. That keeps cloud costs tied to services, instances, and follow-up actions without adding manual export work. Those views often include:
- Spend by environment
- Service-level changes
- Anomalies with owner routing metadata
- Rightsizing status such as accepted, ignored, or snoozed
- Kubernetes over-request findings with risk level
- Instance or cluster usage shifts
- Open cost optimization backlog
Read also: 10 Cloud Cost Optimization Benefits & Why It’s a Must In 2026
Enforce governance: policy-as-code checks to prevent cost regressions
Cloud cost optimization rarely holds if teams only review costs after the fact. One untagged database, one oversized instance family, or one missed exception can reverse earlier savings and push cloud costs back up before the next reporting cycle.
The FinOps Foundation calls this the “regression loop”, and it’s exactly why governance is a Walk-level requirement in the FinOps maturity model.
Governance checks that reduce cloud costs
A governance model only works when cost policy shows up where teams already make changes. That usually means the same delivery and review workflows used for provisioning, approvals, and exceptions. Common controls include:
- Required tags for allocation
- Approved instance families by environment
- Budget thresholds by team or application
- Storage lifecycle and retention rules
- Non-production uptime controls
- Review gates for exceptions
- CI checks before merge
- Slack alerts for policy violations
- Jira tickets for ignored findings
- Auto-remediation when usage drifts from policy
In practice, that can mean allowing only t3.medium allowed in dev, require owner_email__c, or setting tag compliance above 95%.
Since each policy action is tied to a Scope, teams can review the exact rule, owner, and impact without switching context. Over time, that also creates a usable set of governance metrics, including tagged resource coverage, cost delta from rejected changes, and forecast variance tied to missed policy controls.
Common cloud cost analysis mistakes
Governance also helps prevent the same cloud cost analysis mistakes from repeating across teams. The most common issues are:
- Analyzing totals instead of deltas
- Using tags that do not allocate enough cost
- Ignoring storage and network costs
- Treating Kubernetes as a shared black box
- Measuring list price instead of effective cost
- Reporting without owner routing
That structure gives teams a more durable way to support cost optimization, because cloud costs are reviewed together with standards, ownership, and follow-up action.
Read also: 12 FinOps Use Cases + Solutions for Multi-Cloud Spend
How to choose the best cloud cost analysis tools to make it real?
Once billing exports, allocation, anomaly review, commitments, and governance are in place, tool selection becomes more specific. A useful platform has to support the full FinOps workflow across multi-cloud environments, shared ownership models, and ongoing cloud cost optimization work.
Must-have criteria for modern FinOps tools are:
- CMDB context linked to business ownership
- Cross-cloud support across AWS, Azure, and GCP
- Scoped filtering by team, environment, service, and the business views your tools need to support
- Commitment visibility by Scope
- Anomaly routing into operational workflows
- Forecasts and budgets tied to real usage patterns
- Kubernetes cost mapping
- Policy controls and audit history
5 cloud cost analysis tools compared
A comparison table is useful only if it reflects the full workflow, not just dashboard coverage. The most important gaps usually appear in ownership mapping, anomaly routing, policy controls, Kubernetes cost visibility, and how well each tool supports day-to-day cloud cost optimization.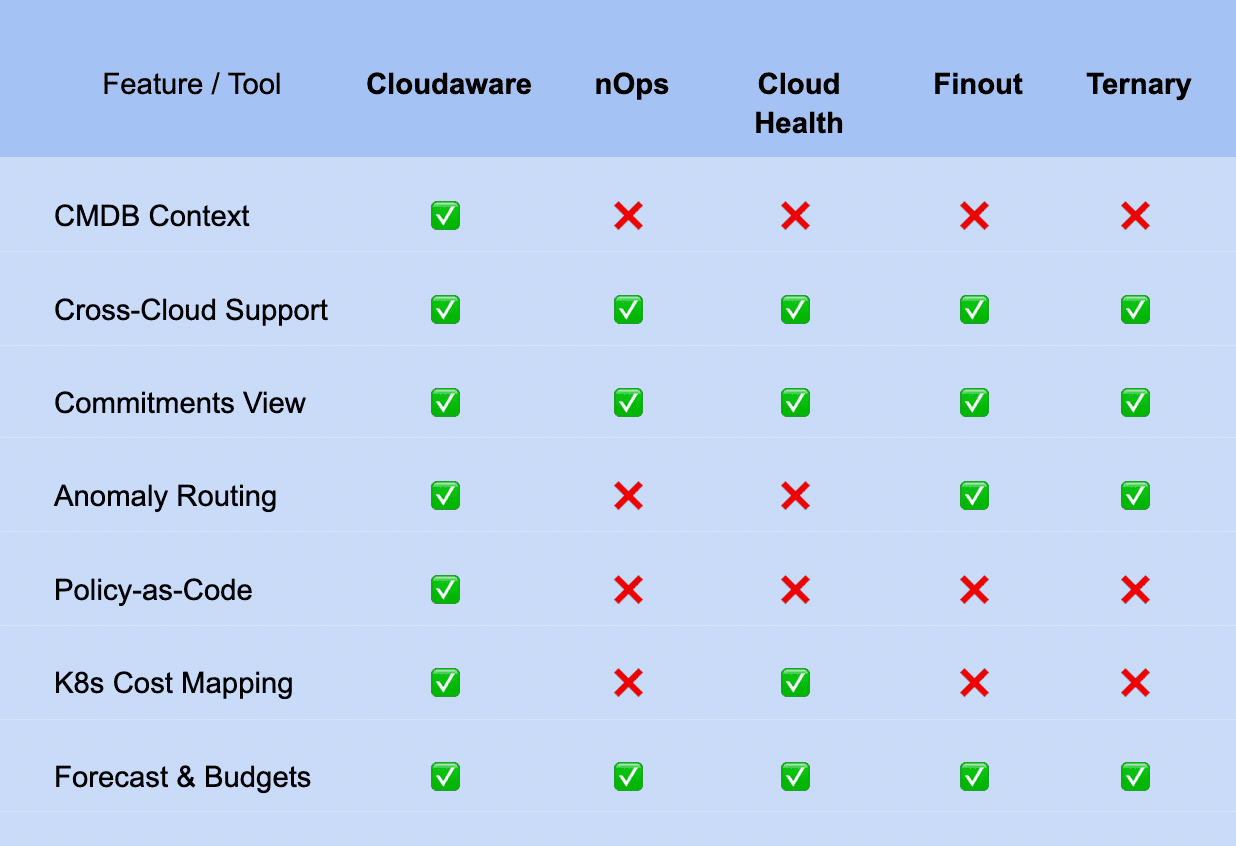 If this table narrows the shortlist, that is already useful. Final fit still depends on your operating model, reporting cadence, cloud complexity, and the way cost analysis connects to governance and remediation.
For a deeper vendor-by-vendor comparison, see our cloud cost optimization tools guide.
Cloud cost optimization analyst
After tool selection, the next practical question is ownership. Even strong platforms do not create FinOps discipline on their own. Someone still needs to review deltas, track findings, monitor commitment performance, and keep cloud cost analysis tied to follow-up action.
In many teams, this role sits between finance, platform, and service owners. The work usually centers on turning cloud cost analysis into a repeatable operating process rather than a monthly reporting exercise.
- Core responsibilities: Allocation quality, anomaly review, waste backlog, commitment reporting
- Key KPIs: Allocation coverage, forecast variance, commitment utilization, remediation rate
- Weekly cadence: Review daily deltas, track open findings, route actions to owners