


If you own cloud budgets, RI/SP strategies, or the “why did our spend spike?” Slack channel, welcome — this is for you. FinOps managers, DevOps leads, cloud architects juggling AWS accounts, Azure subscriptions, and GCP projects know the feeling: five dashboards, three billing exports, and no single truth.
84% of respondents believe that managing cloud spend is the top cloud challenge for organizations today.
In this article, we show how Cloudaware customers fix the exact cloud cost management challenges you deal with daily — fragmented billing files, shared-cost chaos, RI/SP commitment regret, Kubernetes drift, slow anomaly routing, ugly forecasts, SaaS + Marketplace lock-in.
Every step comes straight from Cloudaware ITAM & FinOps teammates — people with 10+ years in hybrid estates, working with mid‑to‑enterprise orgs and cloud heavyweights.
Here’s what you’ll walk away with:
- How to enforce chargeback without tagging wars?
- How to rightsize Kubernetes without guesswork?
- How to plan commitments without vendor lock‑in?
- How Cloudaware turns daily spend into decisions, not surprises?
Let’s make the bill make sense.
Why is cloud cost management so difficult?
- Because the data model you need doesn’t exist out of the box. AWS CUR, Azure Cost Management exports, and GCP BigQuery billing all describe usage differently. And most enterprises run multi-cloud anyway — 89% this year — so “one bill, one owner, one truth” collapses before the meeting starts. (Source: Flexera 2024.)
- Because Kubernetes hides who actually spent the money. Nodes are easy; jobs, pods, autoscaling, and spot/preemptible churn are not. 49% of teams said k8s increased their cloud spend due to overprovisioning and sprawl.
- Because “moving data” can quietly cost more than “running compute.” Internet egress from EC2 starts around $0.09/GB for the first 10 TB/month, with only 100 GB free — petabytes turn “small fees” into line-items. (Source: AWS pricing.)
- Because forecasting has to keep pace with release trains, data growth, and commitment expiries.
- And because the macro picture backs your gut. 84% of organizations say managing cloud spend is the top challenge right now — AI and container adoption aren’t lowering bills.
That’s why cloud cost challenges feel constant — you’re not overreacting. Let’s dive deeper into the most common issues multi cloud companies face and how to fix them 👇
Fragmented cloud billing sources make spend non-allocatable
This is one of the most common cloud cost management challenges Cloudaware users walk in with. You're exporting AWS CUR, downloading Azure EA data dumps, and querying GCP billing tables in BigQuery. Each cloud provider uses its own taxonomy, field structure, and granularity — and none of them agree on how to tag, group, or track resources across shared services.
Now add SaaS, Marketplace, and on-prem. You're looking at five billing files, three cost centers, and zero accountability.
For FinOps managers, this kills showback and delays chargeback.
For DevOps leads, it makes tag-driven dashboards look broken.
And for cloud architects, it makes any kind of unit cost modeling borderline impossible — because who owns what? Who’s burning budget? And what’s the true cloud cost of that Kubernetes workload with shared ingress, cross-region egress, and managed DB?
What good looks like
The cloud spend should be ≥90% allocatable across all scopes (account, project, subscription, team, service). The allocation model needs to update daily, not post-mortem. And cost management should include auto-tagging enforcement at deploy, not just dashboarding after the fact.
Read also: 6 Ways to (not) Fail AWS Cloud Cost Optimization in 2026
How Cloudaware users fix it
They centralize all billing data — AWS, Azure, GCP, plus Marketplace and SaaS — into a normalized warehouse. Fields are aligned. Tags are mapped. Then they layer in CMDB context, so untagged S3 buckets or unknown NAT gateways inherit business metadata (like application__c, environment__c, owner_email__c) from surrounding assets.

That’s how companies move from “65% unallocated” to clean, trackable costs across hybrid platforms. No extra agents. Just data joining and smart object linking that scales across enterprises.
It’s not flashy — but it works. And once allocation works, you finally see where the unexpected cost spikes come from.
Which brings us to the next challenge 👇
Read also: 10 Cloud Cost Optimization Tools That Actually Reduce the Bill
Shared costs without policy-backed allocation keys distort unit economics
Once you centralize billing data, the real cloud cost problem shows up: shared services with no owner.
Think NAT gateways, cross-AZ traffic, platform observability stacks, shared storage, even CI/CD runners. They live in infra accounts or shared projects. But without a defined allocation key — requests, bytes, team headcount, % usage — you can’t break the cost down by service.
So teams undercharge, Finance over-absorbs, and everyone starts doubting the dashboard.
Companies that schedule a demo with me see this all the time. One had a $40K/month egress bill, no one would claim. Turned out, three teams were routing ML training traffic through the same VPC endpoint — with no tracking.
What good looks like
You want ≥90% of shared cloud costs allocated by agreed policies. Variance between raw vs allocated cost per unit (e.g., cost per API call, job, or order) should trend under 10%. And policy changes should be versioned and visible — so no one gets blindsided during QBRs.
How companies fix it
First, they inventory shared services (like logging, security tooling, control planes). Then they define a per-service allocation key. Not gut feel — actual numbers: GBs transferred, jobs run, cluster hours.
Cloudaware ingests the raw billing + usage data, applies those keys, and tags the cost records so they roll up cleanly into the business hierarchy. That’s how teams go from “shared soup” to per-team, per-app clarity — without spreadsheet acrobatics.

That level of cloud cost management unlocks real optimization work. You finally know which teams drive which spend. And when you charge it back, it sticks.
But clean allocation alone won’t fix coverage gaps.
Next: why commitment strategies built in silos break under pressure, and how smarter pricing and capacity planning can shift your entire cloud spend curve 👇
Read also: 12 Multi Cloud Management Platforms: Software Features & Pricing Review
Commitments planned in a silo (RI/SP/EA) don’t match workload reality
You buy Savings Plans for three years. Meanwhile, your engineers move workloads across AZs, regions, even cloud providers. Happens every quarter.
Anna, ITAM expert at Cloudaware:
That’s the problem. Commitments planned in isolation — by finance, without DevOps input — end up misaligned. And cloud cost coverage without usage context doesn’t deliver cost optimization. It locks you in instead.
Each cloud provider structures commitments differently. Term lengths, scope, prepay types, flexibility — it’s not just pricing, it’s complexity. Add sprint-level release cycles, AI workloads, or migration cost risks and your coverage math unravels fast.
What good looks like
- 60–85% coverage for steady workloads.
- 90% utilization, tracked by service/team.
- Commitment plans revisited quarterly.
- Effective hourly rate monitored against baseline.
Read also: Rightsizing in Cloud Cost Optimization? Pro Insights
How multi cloud companies fix it
They centralize commitment data across AWS, Azure, Oracle, Alibaba, and GCP. Usage is linked to workloads via CMDB tags like application__c or product_line__c. They model trade-offs (1-yr vs 3-yr), simulate regional shifts, and review utilization alongside actual cloud cost trends.

Expiry cliffs, coverage deltas, and savings gaps show up in one place — no spreadsheets needed.
And when unused commitments start stacking up? Convert. Sell. Reallocate. You’ve got options, because your commitment strategy runs alongside your roadmap.
Next: all that clean math breaks when you can’t see who’s spending in Kubernetes. Let’s dig into ephemeral compute and ownership blind spots.
Read also: Cloud Cost Analysis Guide 2026 - Steps, Tools & Expert Tips
Kubernetes & ephemeral compute hide true owners
When a team tells you, “we don’t know whose pod this is,” you’re already in the thick of it.
Cloudaware users in mid-to-large orgs run into this challenge constantly. They centralize billing data and fix tag coverage, but the minute they look at Kubernetes — everything blurs. Nodes are billable. Pods are ephemeral. Namespaces span multiple apps.
And cost allocation? That’s gone unless your workloads are fully labeled, active, and consistently right-sized.
In multi-tenant clusters, one customer found 20% of their cloud costs tied to default namespaces — no team, owner, or service labels. Just invisible spend.
And then there's autoscaling. It sounds great until you realize how it actually works: pods spin up for a cron job, use GPU for 10 minutes, then disappear. The cost sticks around. The owner doesn’t.
What good looks like
- ≥90% of cloud container spend attributed to a team/service.
- Request vs usage delta tracked weekly.
- Cost reports segmented by namespace, deployment, and owner tag.
- Idle cost alerts triggered when request/usage ratio >1.3x.
Read also: 10 Cloud Cost Optimization Strategies From FinOps Experts
How Cloudaware users fix it
They start with OpenCost (or Cloudaware-integrated collectors) to export per-pod and per-namespace spend. Then they join that data with CMDB context. Cloudaware links cost records to labeled workloads — so untagged pods inherit metadata from their controller, app, or cluster.
That lets them surface costs at the right layer: per application__c, per service line, per environment.
It also makes cost optimization actionable — teams can see if they’re paying for over-requested CPU, unused volumes, or stale deployments.
All of this rolls into daily cloud cost reports that reflect what’s actually running — AWS, GKE, or AKS — without any guesswork. Because if your containers are invisible, your chargeback will fail — and your cost reporting will get ignored.
Next: What happens when the spike does get noticed — but the alert lands 3 days late?
Read also: IT Asset Disposition (ITAD): How to Close the Loop on Retired Assets
Anomaly detection & routing are slow, so finance learns monthly and engineering reacts next sprint
From my observations during demo calls, 50% Cloudaware customer has felt this: an unexpected cost hits, no one sees it in time, and the explanation shows up three weeks later — in the MBR.
That’s the pattern. Spikes happen when a dev leaves a debug instance on, a new AWS service gets misused, or a deployment loops. The problem isn’t the overage — it’s that alerts don’t reach the right person when they’re still fixable.
One enterprise user shared this: their Lambda spend jumped 6x overnight. By the time the anomaly showed up in the cost management deck, it had already added $42K in cloud costs. The engineer? They found out after the invoice.
What good looks like
- MTTA (Mean Time to Acknowledge): <1 hour.
- MTTR (Time to Resolution): <24 hours.
- ≥95% anomalies routed with tag-based owner context.
- Suppression rules to ignore known changes; focus on true cost overruns.
Read also: AWS Cloud Cost Management: A Practical Guide
How Cloudaware users fix it
They define anomaly rules at the cloud service and CMDB group level — by team, app, or tag. Cloudaware flags unexpected cost jumps using custom thresholds (percent + absolute value).

Anomaly detection report element. See it live
Then, using metadata from the CMDB (owner_email__c, product_line__c), it routes alerts directly to Slack or Jira — no ticket triage, no shared inbox dead ends.

That means anomalies are caught in near-real-time, routed with context, and fixed before they roll into Finance’s burn report. And since every alert includes usage data, it’s fast to verify and act.
This is the heartbeat of cost optimization: real-time feedback for engineering, visibility for Finance, and zero finger-pointing at month’s end.
Next up: why your cloud cost forecasts keep missing — and how budgets built on averages can’t keep up with your delivery velocity.
Read also: 7 Best Cost Allocation Software for FinOps Teams in 2025
Cloud cost forecasts ignore drivers; budgets ride trailing averages
Most cloud cost forecasts don’t break because they’re wrong — they break because they’re detached.
Cloudaware users often come in using rolling 3-month averages to set their cloud budgets. It’s quick, looks stable, and satisfies Finance — until that AI training run, global launch, or surprise data migration wrecks the model.
One team had a product rollout that tripled storage use across two regions overnight. Their budget missed by 38%. And no one caught it, because the cloud cost forecast didn’t account for new drivers.
That’s one of the biggest cloud cost management challenges in hybrid teams: too many moving pieces, not enough linked signals.
What good looks like
- MAPE (mean absolute percentage error) ≤10–15% by cost center.
- Forecasts driven by usage inputs: users, jobs, GBs, instance hours.
- Linked to engineering calendars, decomm schedules, release timelines.
- Budget reviews per product, not just per cloud account.
How Cloudaware users fix it
They build driver-based forecasts tied to actual usage data — like ingestion volume, user sessions, GPU hours. CMDB tags (e.g. application__c, product_line__c) help align cost trends with business timelines.
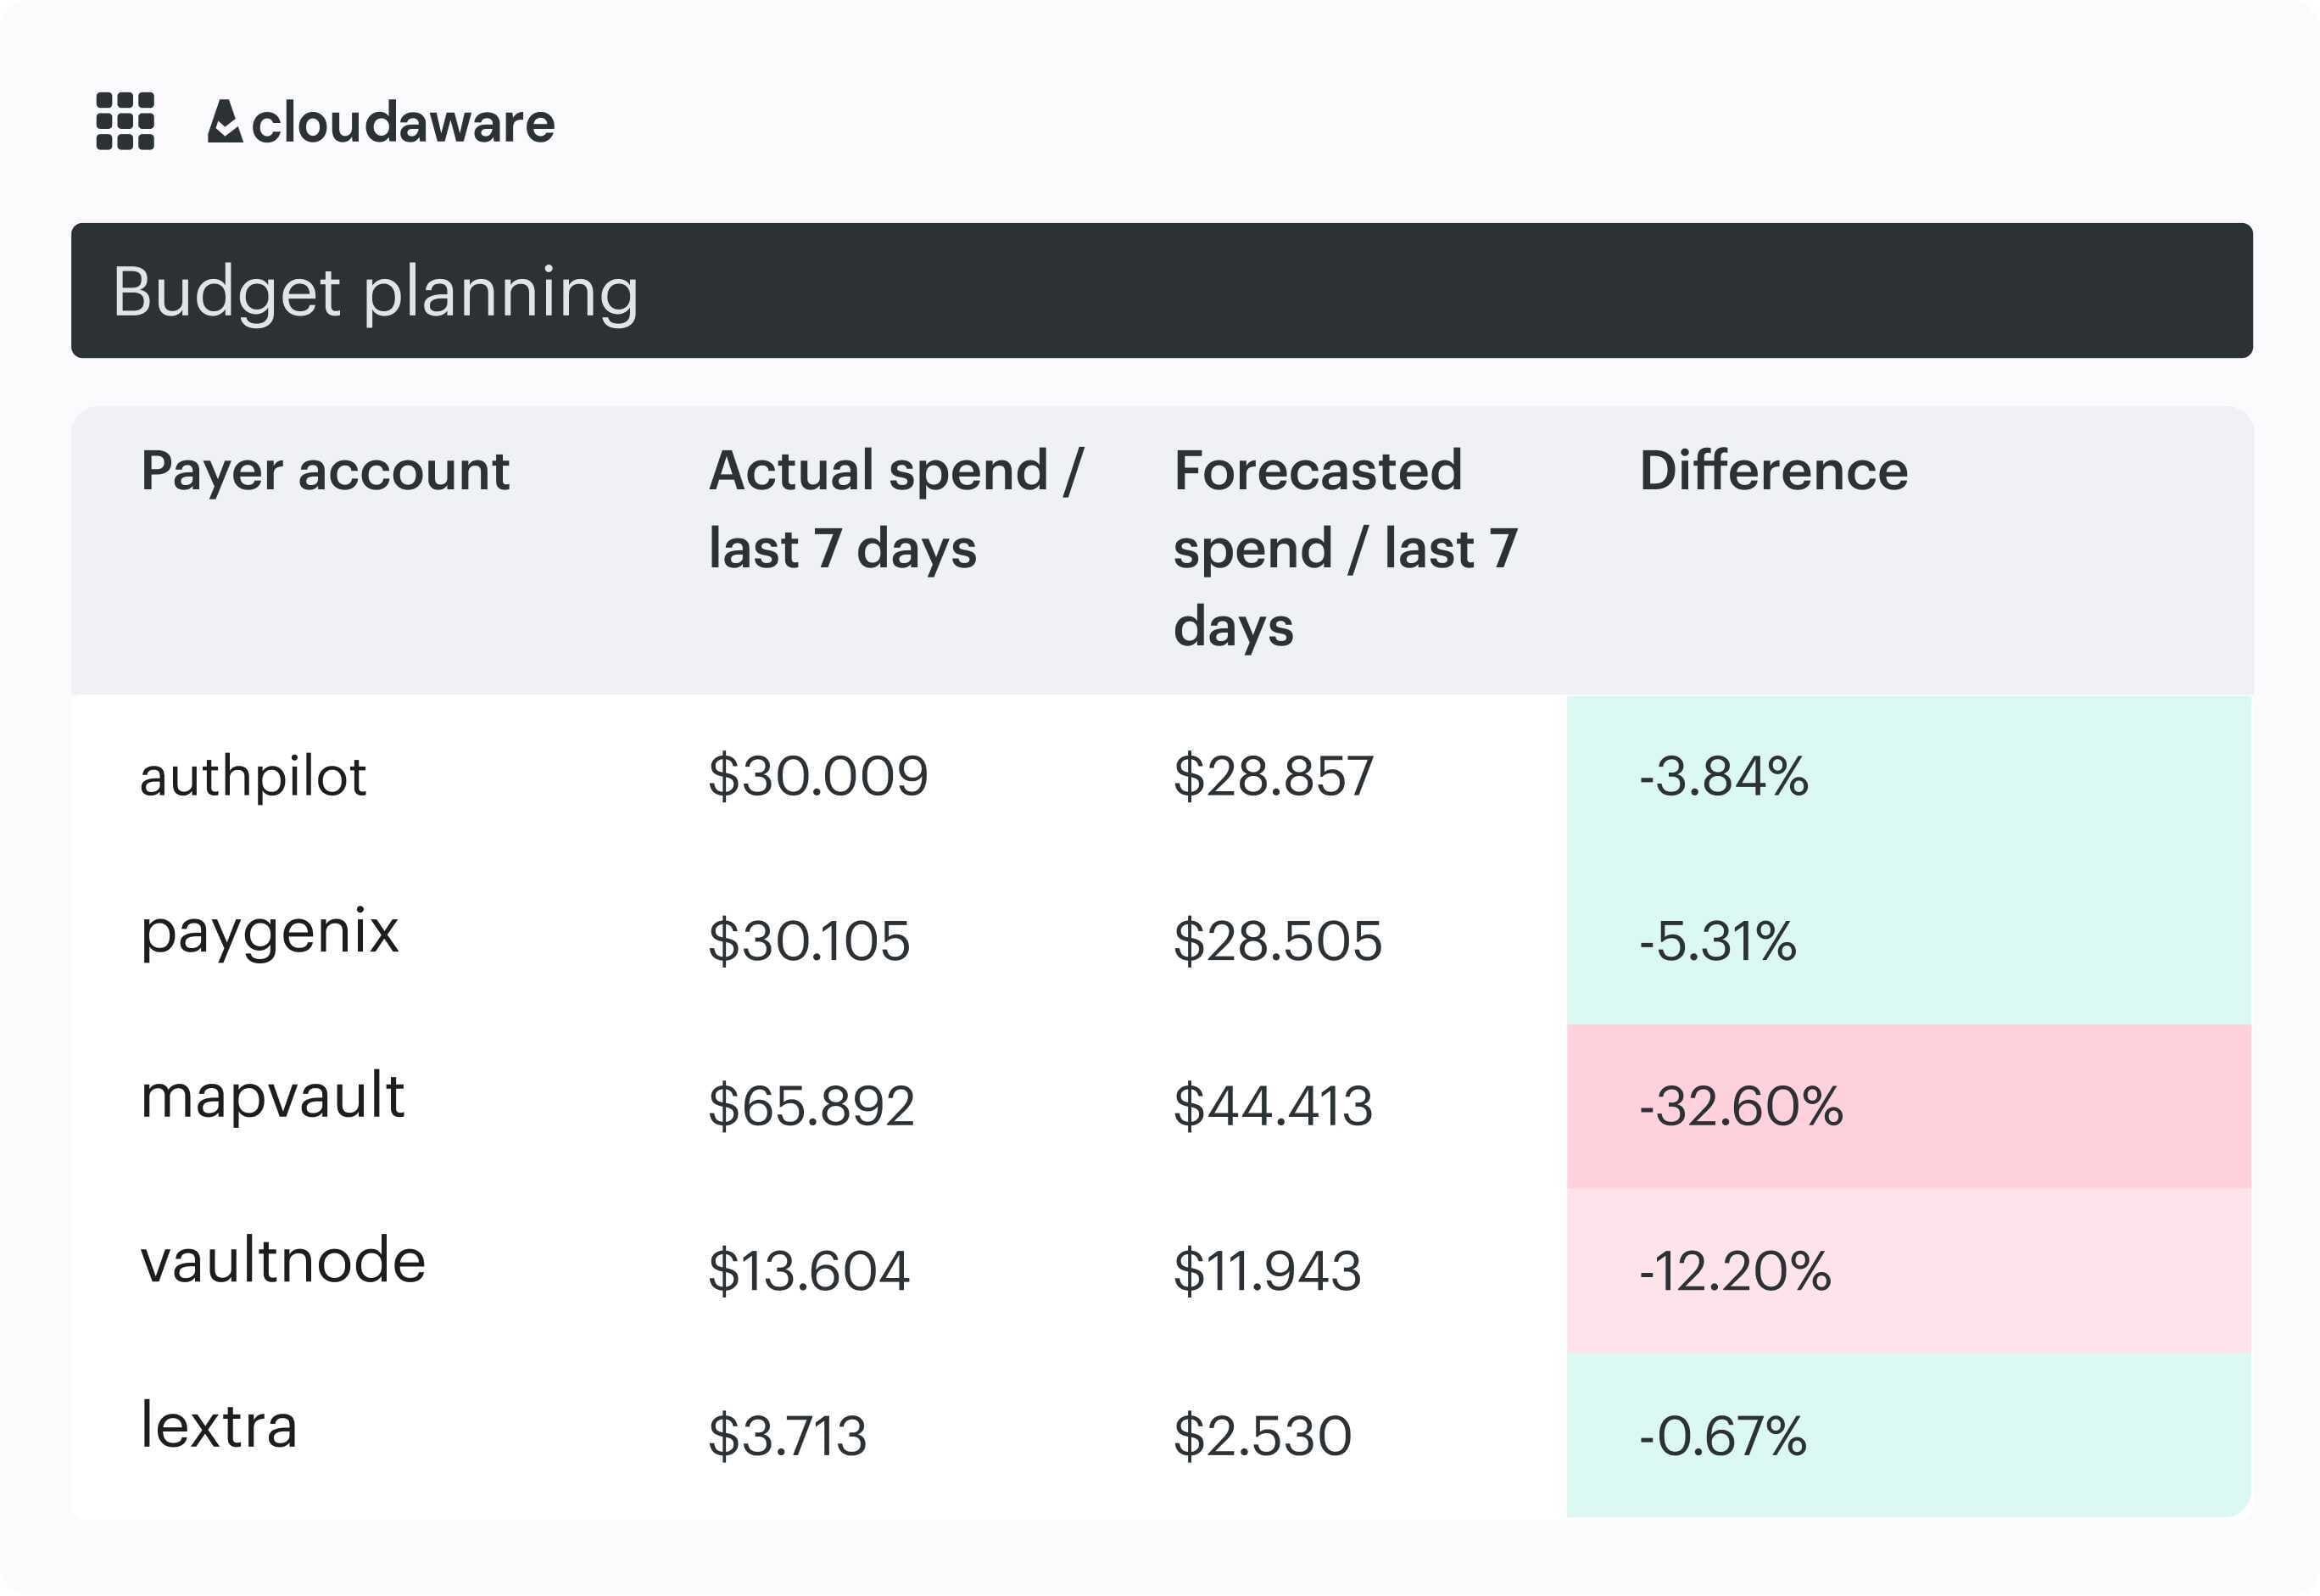
Cloud cost forecast dashboard element at Cloudaware. Schedule a demo to see it live.
Engineering inputs feed in from Jira, pipelines, and product ops — so forecast strategies evolve with what’s really being shipped.
Budgets become real FinOps tools, not approvals. Teams model scenarios (e.g. rollout + SP purchase), track deviations, and re-forecast weekly. Especially in hybrid estates, this helps link spend back to the cost center owners who actually influence delivery.
No more setting numbers in Q1 and hoping the infra follows. That’s not cost optimization — that’s wishful thinking.
And remember, even the sharpest forecast falls apart if half your cloud spend is stuck in SaaS, Marketplace, or licensing silos. Let’s tackle that next 👇
Read also: Cloud Cost Optimization Framework
Licensing, marketplace & SaaS cloud spend sits off to the side — no linkage to services or chargeback
This is the quiet drain on your cloud budget: SaaS, Marketplace AMIs, BYOL licensing — none of it shows up in your per-service cost reports. Cloudaware customers regularly find 15–25% of total cloud costs floating outside their main dashboards, tied to contracts, not workloads.
You can’t optimize what you can’t map. One enterprise team uncovered $120K/year in database licensing buried under shared infra — but they couldn’t trace it to a single product. So it never hit chargeback. And it never got questioned.
The risk here isn’t just wasted spend — it’s deep vendor lock-in. When your workloads rely on opaque licensing agreements, it’s hard to pivot, refactor, or switch services without rewriting the budget and rejustifying the tech.
What good looks like
- 100% of software, SaaS, and Marketplace costs mapped to services, teams, or cost centers.
- Renewals tracked with owners + lead time.
- “All-in” unit economics (infra + license) available at service level.
- Real-time flags for unallocated contract-based spend.
How Cloudaware users fix it
Companies ingest contract terms and license SKUs into their CMDB. From there, they attach each license to a service, environment, or product_line__c. They align billing data with spend owners, track renewal cycles, and flag unused or double-billed instances.

Any questions on how it works within Cloudaware? Schedule a free call with our expert.
That’s how SaaS optimization becomes a repeatable practice, not a last-minute scramble.
They also use these insights for expense management, rolling all software and Marketplace pricing into the broader cost optimization picture.
Because real cloud cost clarity doesn’t stop at infra. And your CFO wants the whole solution, not half the stack.
Read also: $1.5M in Cloud Cost Savings: Real Examples and FinOps Insights
Optimize multi cloud cost management with Cloudaware
If your estate spans AWS, Azure, GCP, Oracle, or Alibaba — and your costs are split across five billing files, three dashboards, and one very tired spreadsheet — you already know the chaos. Cloudaware pulls it together.

This isn’t just another tool in your stack. It’s your FinOps control center. Cloudaware connects every cloud, every cost, and every service to one real-time source of truth — so you stop guessing and start allocating, forecasting, and optimizing like it’s your job. Because it is.
With Cloudaware, teams monitor cloud cost daily across AWS, Azure, GCP, Oracle, and Alibaba. They allocate spend per product, app, or cost center — backed by 95%+ coverage. Commitments? Tracked and optimized across services, scopes, and regions.
They catch unexpected cost spikes early, route alerts straight to the right owner, and forecast budgets based on live usage — not outdated averages. Even SaaS, Marketplace, and BYOL licenses get pulled into view — linked back to actual services and owners so nothing slips through the cracks.
Cost optimization features:
- Cost Allocation, Showback, Chargeback.
- Commitment Management (RI/SP/EA tracking + modeling).
- Anomaly Detection & Routing (Slack, Jira, ServiceNow, Email).
- Forecasting & Budgeting.
- SaaS & Marketplace Cost Linking.
- Kubernetes & Ephemeral Cost Visibility.
- Cost per Unit Tracking (€/API call, job, GB).
- Custom Dashboards built for real FinOps reviews.
- CI/CD Tag Compliance (automated policy enforcement).