


You're not the only one who has pushed a new version and seen your AWS bill go up overnight. You open Cost Explorer, check AWS Budgets again, and look through the Terraform logs, but nothing makes sense. Finance needs answers, but all you have are guesses.
For most teams today, that's what cloud cost management looks like. All vendors say they can save you money. Most tools essentially put the same charts you already have in a new packaging. People on Reddit, Slack, and at FinOps meetups all claim the same thing: most cloud cost optimization tools don't work.
So we tested what was truly out there, ourselves.
We found AWS, Azure, and GCP to be good examples of public cloud third-party solutions. This paper compares them. Each one was linked to real billing outputs, tagged resources, and workloads that were similar to those in production.
The point wasn't to look at the features; it was to find out which cloud cost optimization services really cut costs.
How did we test cloud cost optimization tools?
Each platform was evaluated for how effectively it detects waste, performs rightsizing, and manages commitments, such as RIs and Savings Plans. Testing also measured how smoothly the tools integrate with Kubernetes environments, CI/CD pipelines, and active FinOps workflows. A solution that can’t adapt to daily deployments won’t deliver real savings in the long run.
The analysis combined cloud cost optimization tools Gartner insights with feedback from experienced FinOps engineers and architects. Some platforms proved ideal for multi cloud hosting cost optimization services for enterprises, where governance and scalability matter most. Others fit agile SaaS teams searching for tools for cloud cost optimization that automate routine actions without the overhead of a full FinOps program.
Here you will find out which platforms actually help cut cloud costs and which ones only look good in demos.
Cloudaware
Capterra: ★★★★☆ 4.5/5
Trial days: 30
Best for: multi-cloud enterprise FinOps teams and cloud architects needing deep cost visibility and optimization control
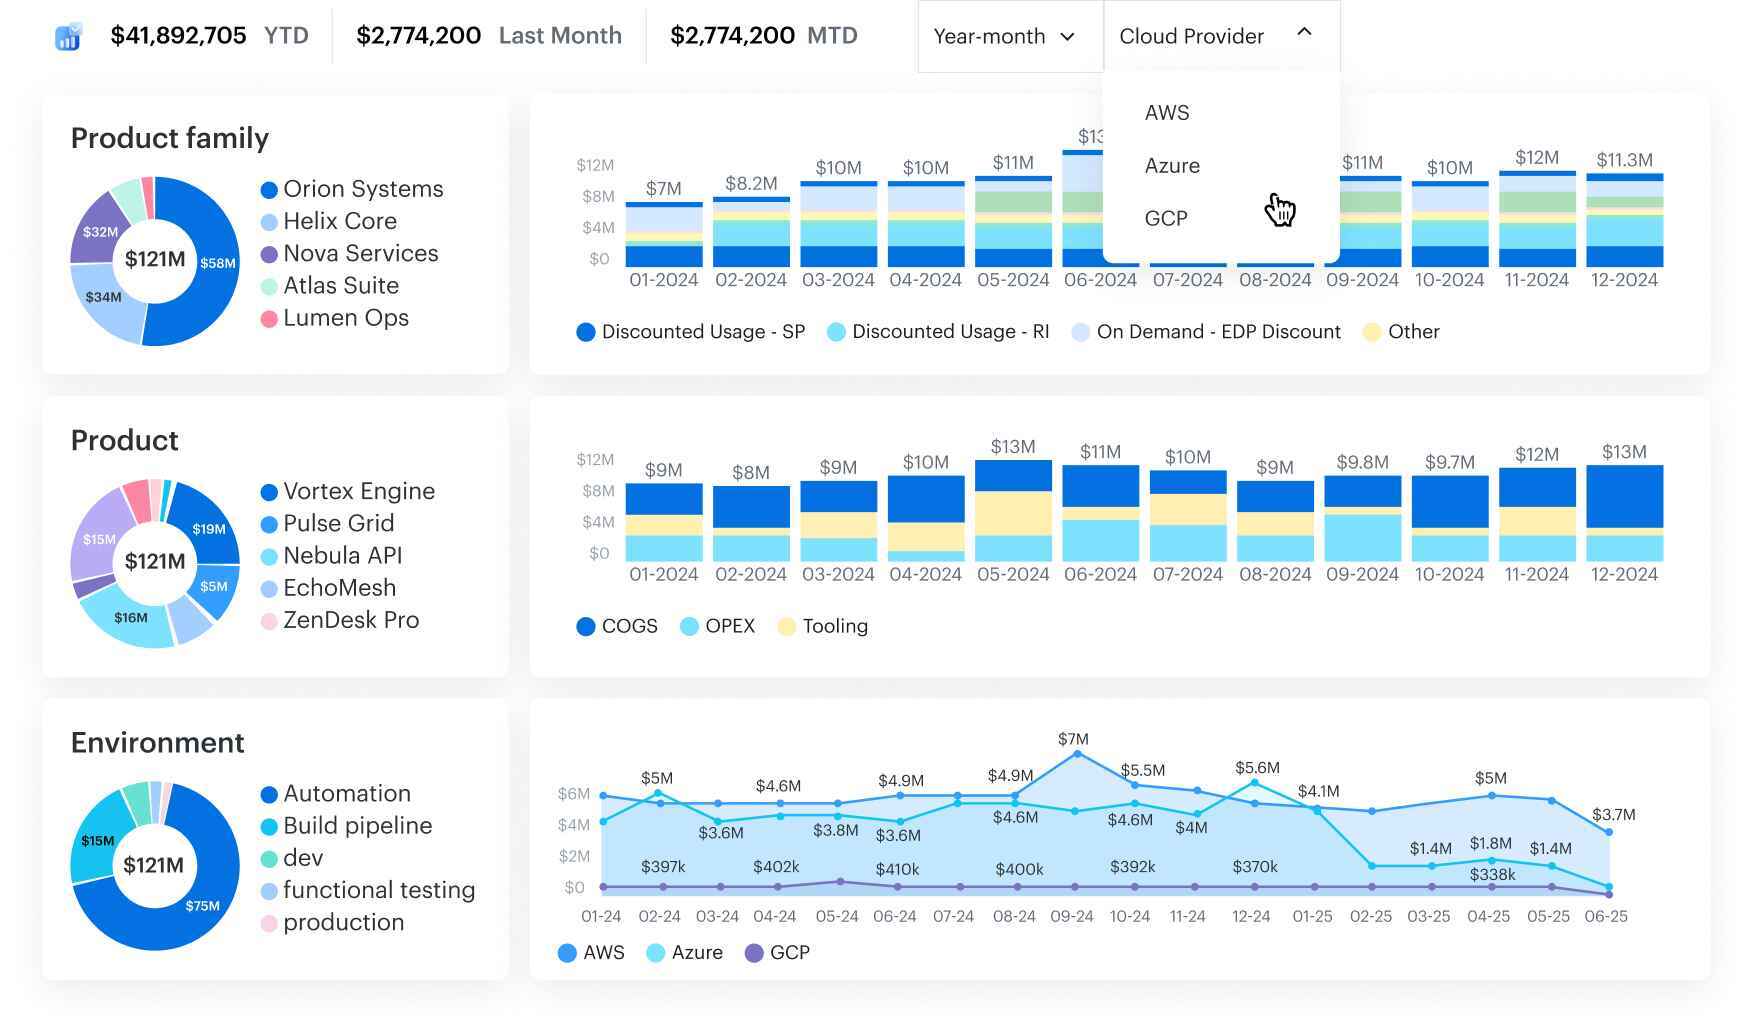
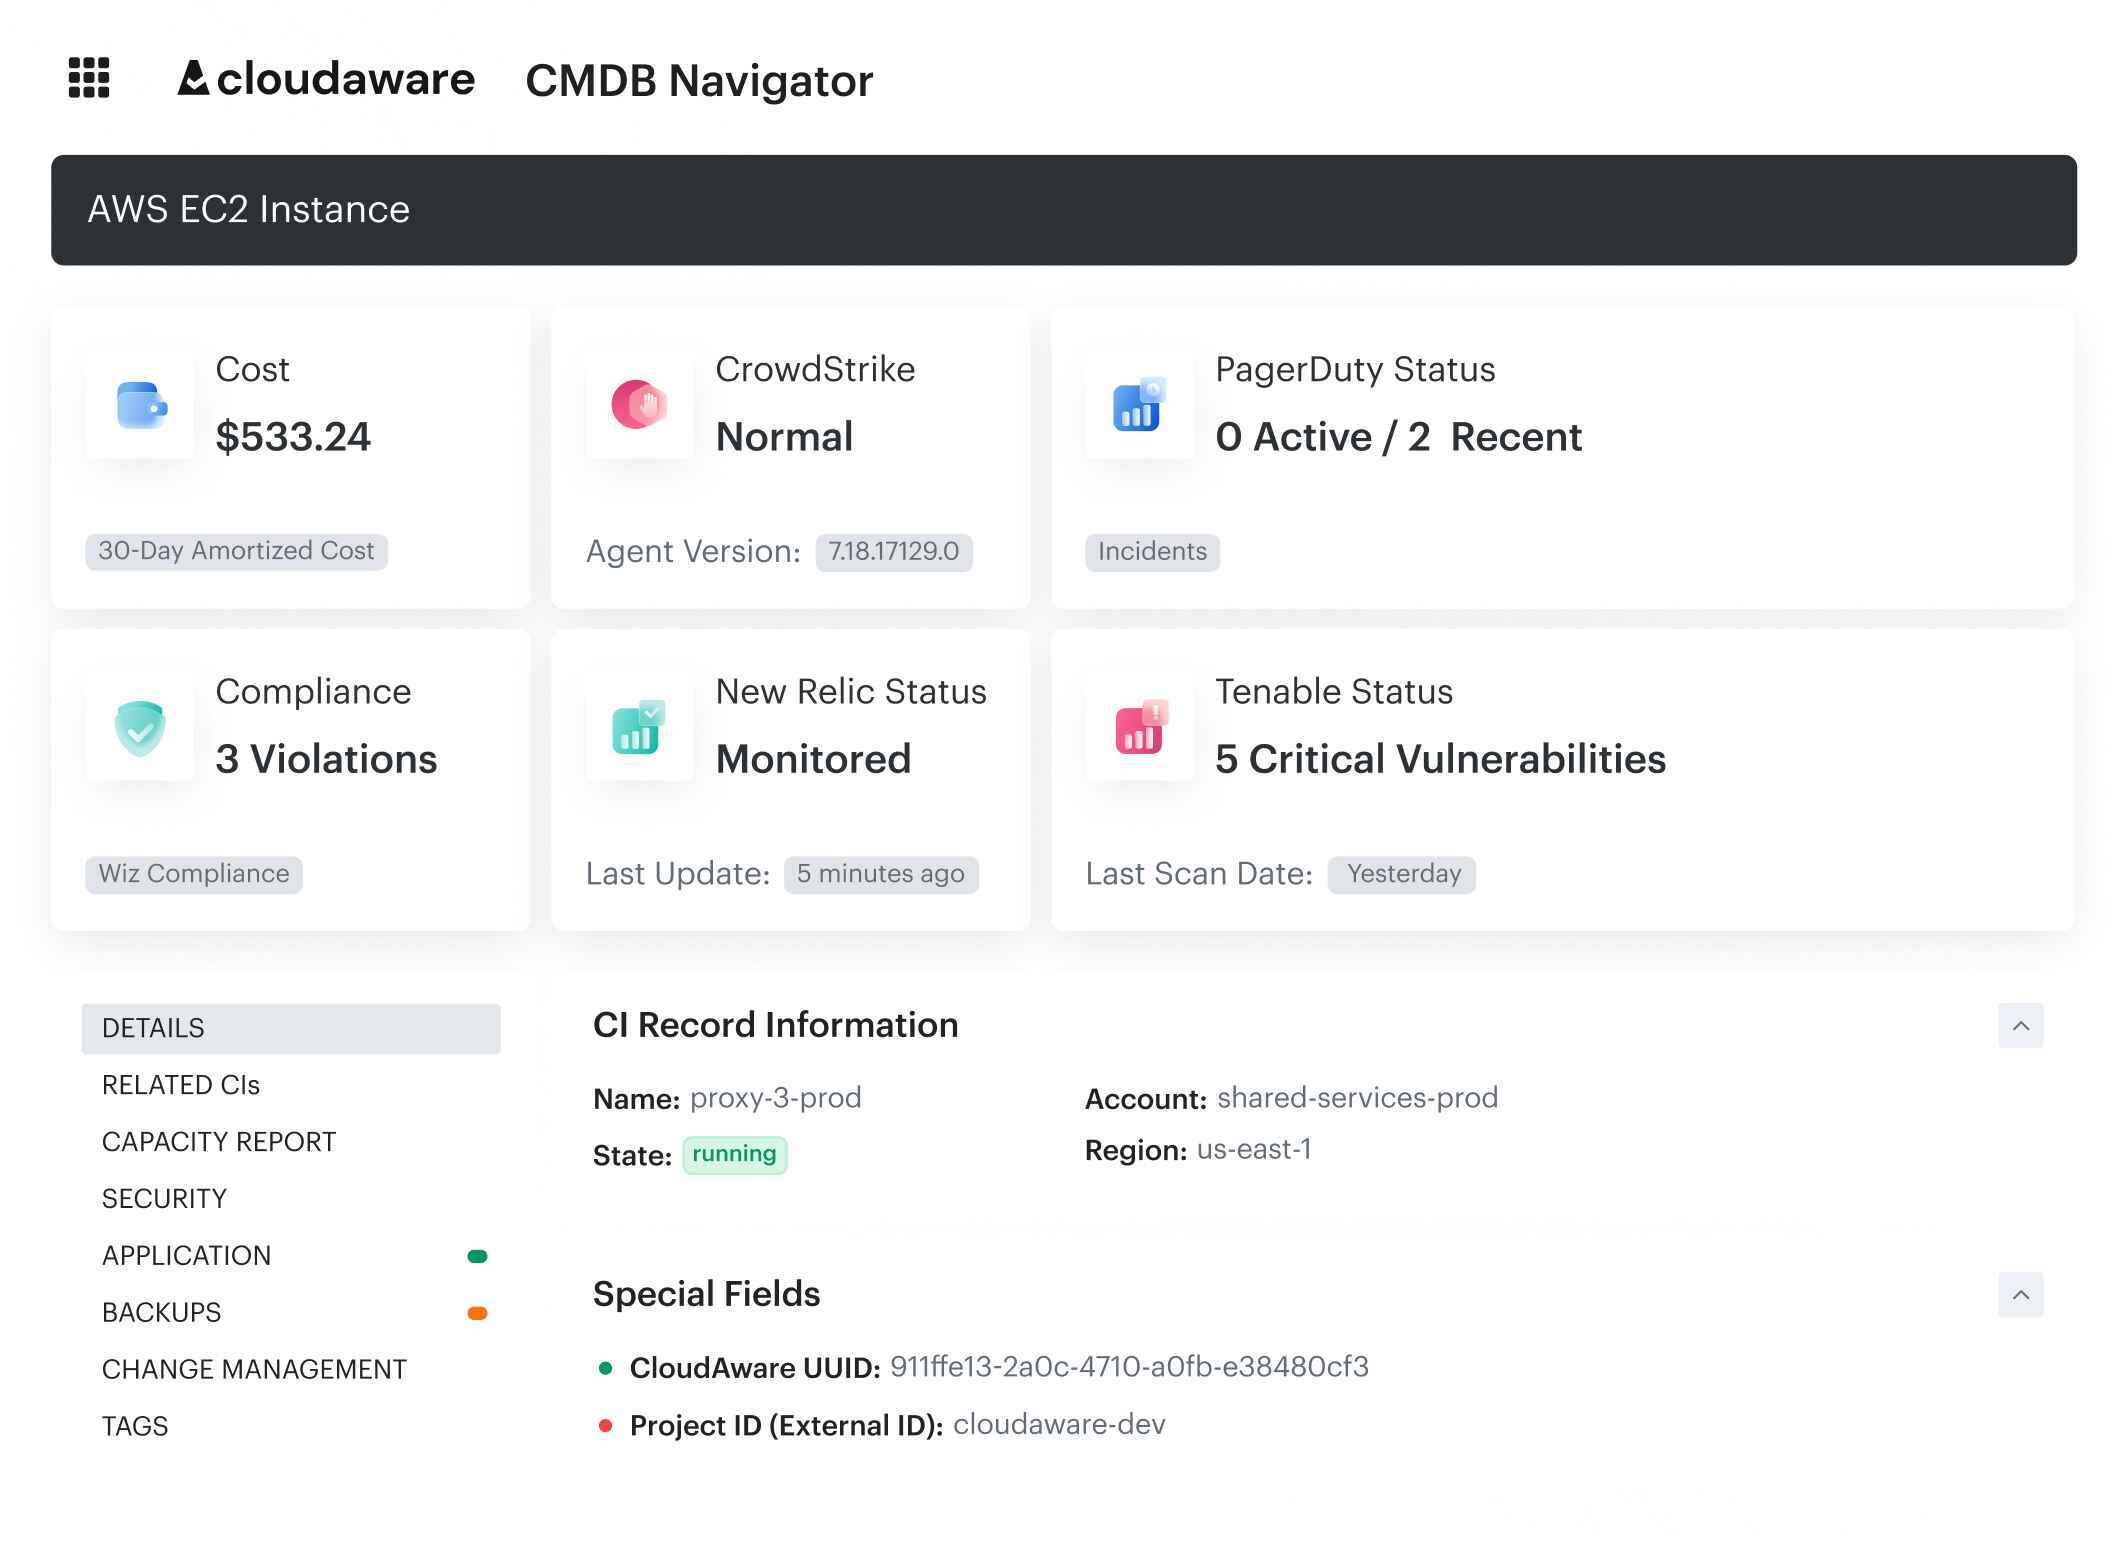
Cloudaware connects directly to AWS, Azure, GCP, and other environments, collecting usage and billing data in real time. Every dollar of cloud cost is tied to a specific CI, giving teams live visibility into what drives spend and where to optimize.
The platform’s CMDB links billing data with infrastructure metadata, transforming raw usage metrics into actionable insights. This structure allows tools for cloud cost optimization, such as idle resource detection, overprovisioned storage analysis, and tag compliance checks, to be fully operational. Cloudaware also triggers automated remediation workflows in Jira or Slack, closing the loop between detection and action.
Optimization tools inside Cloudaware
- Idle detection: Create rules like “unattached EBS > 7 days” or “EC2 < 5% CPU.” Findings are logged, ticketed, and routed for cleanup.
- Rightsizing insights: Daily performance dashboards show oversized compute across AWS, Azure, and GCP with actionable recommendations.
- Custom alerting workflows: Built on Force.com and provide trigger on cost thresholds, tag violations, or idle policies, then escalate automatically.
- Allocation + CMDB linkage: Every optimization is tied to a cost center or service owner, preventing orphaned alerts.
- Forecasting and RI/SP management: Visibility into reserved instance and savings plan coverage, utilization, and amortized cloud cost.
- Anomaly detection: Real-time detection of spend spikes with root-cause links to specific accounts, workloads, or owners.
- Usage Analytics dashboards: Correlate CPU, memory, and network utilization with spend across environments. Cloudaware experts help build tailored dashboards based on your data and FinOps use cases.
- Tag governance and enrichment: Auto-derive “virtual tags” from account to application mappings to maintain allocation integrity.
- Automated budgeting: Daily rollups and policy-driven alerts that turn cost guardrails into routine FinOps workflows.
Cloudaware’s architecture also supports performance-driven optimization. Its Usage Analytics module tracks CPU, memory, and network usage for every instance. You can create automated rules like
“If CPU < 5% for 10 days → open Jira ticket → notify owner in Slack.”
That makes the platform both preventive and corrective — it finds inefficiencies and acts on them automatically.
Pricing
Cloudaware doesn’t do flat licensing. Its pricing scales with what you actually manage.
- Base CMDB: ~$0.008 per configuration item (CI) per month.
→ Example: 100 cloud servers = ~$400/month. - FinOps Module: Adds cost management and optimization features for +20% of CMDB spend.
→ Total: ~$480/month in the same setup.
This model aligns cloud cost management directly with infrastructure scope, so no invoice skimming or hidden multipliers. It fits FinOps teams that prefer transparent, infrastructure-aware pricing instead of percentage-based fees.
Pros and cons
Based on reviews from real users.
✅ Deep CMDB integration, linking every dollar to a real asset or owner. G2.
✅ Proven waste detection and automated cleanup workflows.
✅ Advanced analytics for both FinOps and ITAM.
✅ Multi-cloud visibility for AWS, Azure, and GCP. G2.
✅ Concierge dashboard service at no extra cost.
⚠️ Steeper learning curve for new users due to data depth. G2
⚠️ Pricing may feel high for small teams with large numbers of minor CIs.
VMware Tanzu by CloudHealth
G2: ★★★★☆ 4.1/5
Trial days: available
Best for: enterprise FinOps teams managing budgets, chargeback, and cost governance
VMware Tanzu CloudHealth makes idle, oversized, and untagged resources visible to the people who own them — and triggers action automatically. Its Perspectives framework embeds cost data directly into operational context. Each group sees its slice of the cloud spend, complete with rightsizing recommendations, anomaly alerts, and automated cleanup policies.
While it’s not as lightweight as newer tools for cloud cost optimization, CloudHealth’s strength is governance at scale. FinOps leaders use it to align cost optimization with security, while engineering teams trust it to highlight inefficiencies before the next invoice.
Optimization tools inside CloudHealth
- Rightsizing recommendations: Detect underutilized EC2, Azure VMs, EBS, and RDS instances with clear actions by resource type or owner.
- Idle detection: Policies automatically surface untagged or idle resources (like unattached volumes) and route them for cleanup.
- Anomaly detection: Hourly and daily spend analysis with root-cause visibility; alerts can flow via email, Slack, or any webhook endpoint.
- Policy automation: Set thresholds for spend, coverage, or performance; CloudHealth applies remediation workflows or escalations automatically.
- Tag and asset reporting: Identify tag gaps, compliance violations, or orphaned assets, even in large environments.
- Commitment planning: Track Reserved Instance and Savings Plan coverage across AWS and Azure.
- Forecasting: Time-series projections that combine historical spend and commitment utilization.
- Cross-cloud visibility: Unified dashboards for AWS, Azure, GCP, and VMware vSphere environments.
- Role-based perspectives: Finance sees chargeback; DevOps sees rightsizing; security sees compliance costs.
CloudHealth focuses on turning cost visibility into cost management discipline. You define guardrails once and the platform enforces them continuously through policies, perspectives, and integrations.
Pricing
VMware doesn’t publish public pricing for CloudHealth, but most deployments follow the spend-tier model from AWS Marketplace and partner offers.
Typical examples:
- Up to $100K/month AWS spend → about $41,900/year (12-month term).
- Up to $150K/month AWS spend → about $45,000/year.
Contracts usually run 12–36 months, with longer terms offering ~10–15% discounts. Above your contracted tier, additional spend is billed at roughly 3% of overage.
This structure fits enterprise FinOps teams with stable usage patterns — predictable billing, clear guardrails, and strong compliance alignment.
Pros and cons
Based on reviews from real users.
✅ Proven multi-cloud visibility and deep governance alignment. G2.
✅ Reliable rightsizing and anomaly response tools
✅ Strong policy automation and budget enforcement. Capterra.
✅ Mature integrations with VMware, AWS, and Azure ecosystems
⚠️ No direct remediation — engineers must apply changes manually
⚠️ Requires disciplined tagging and data hygiene for best results
⚠️ Initial setup can feel heavy for smaller or fast-moving teams. Capterra.
Read also: Cost Anomaly Detection: 6 Steps to Catching Cost Spikes Fast
CloudZero
Capterra: ★★★★☆ 4.5/5
Trial days: 14
Best for: engineering-led FinOps teams that need precise visibility into where and why cloud costs change
CloudZero is built for teams that already manage well-tagged AWS environments but need faster, contextual signals inside their daily work. The platform excels at correlating cloud spend with engineering decisions. You can track cost per feature, per customer, or per environment, and map every dollar to a team or service owner.
That visibility helps FinOps engineers move from reactive reporting to proactive cost optimization — fixing inefficiencies while development is still in motion.
CloudZero cloud cost optimization features
- Rightsizing Recommendations (Advisor): Highlights over-provisioned EC2, K8s, storage, and Lambda instances with owner and deployment context.
- Idle Detection (Tagless Ready): Surfaces idle compute or unused resources even when tags are incomplete, using account, service, and environment logic.
- Real-Time Anomaly Alerts: AI models flag spikes within an hour and deliver alerts via Slack, email, or webhooks straight to the DevOps or FinOps team responsible.
- Engineering Workflow Integration: Cost data connects directly to Git commits, features, or sprint metrics, embedding optimization into everyday DevOps work.
- Tag governance: Define and enforce tagging policies across teams with flexible mapping and “virtual tags.”
- Anomaly dashboards: Drill down into root causes, e.g., “Which Lambda spike caused this week’s variance?”
- APIs and exports: Push curated cost datasets to your BI or FinOps pipelines.
Pricing
CloudZero uses a tiered pricing model linked to cloud spend. Pricing typically starts around $1,500 per month, which usually covers 1–2 cloud accounts and up to $100K in monthly cloud costs.
- $50K–$100K spend: about $1,500/month
- $200K+ spend: $3,000/month and up
The more cloud spend the platform processes, the higher the cost. Despite this, the model remains predictable and scales according to actual usage rather than relying on arbitrary licenses. Larger teams can negotiate enterprise pricing based on annual spending commitments.
Pros and cons
Based on reviews from real users.
✅ Real-time anomaly detection and rightsizing recommendations. G2.
✅ Deep integration into DevOps and engineering workflows
✅ Tagless cost correlation with strong unit economics visibility
✅ Fast setup; useful even before tagging hygiene is perfect. Capterra.
⚠️ Pricing scales with cloud spend, not infrastructure size
⚠️ No built-in CMDB or ITAM functions — reporting only. G2.
Read also: 6 Finops Domains: The Essential Map For Cloud Spend Control
Flexera Cloud Cost Optimization
G2: ★★★★☆ 4.3/5
Trial: 60 days
Best for: large FinOps and IT governance teams managing multi-cloud estates with strict compliance requirements
The Flexera Cloud Cost Optimization module combines visibility, governance, and automation into a single framework. It ingests billing data from AWS, Azure, and GCP, normalizes it, and applies custom business rules. That lets teams analyze cloud expenses without rebuilding dashboards every month. On top of that, Flexera uses policies and workflows to drive action.
For example, idle instances can trigger alerts/automated decommissioning/oversized VMs to surface in rightsizing reports, and then untagged resources are routed through governance checks before they inflate next month’s bill.
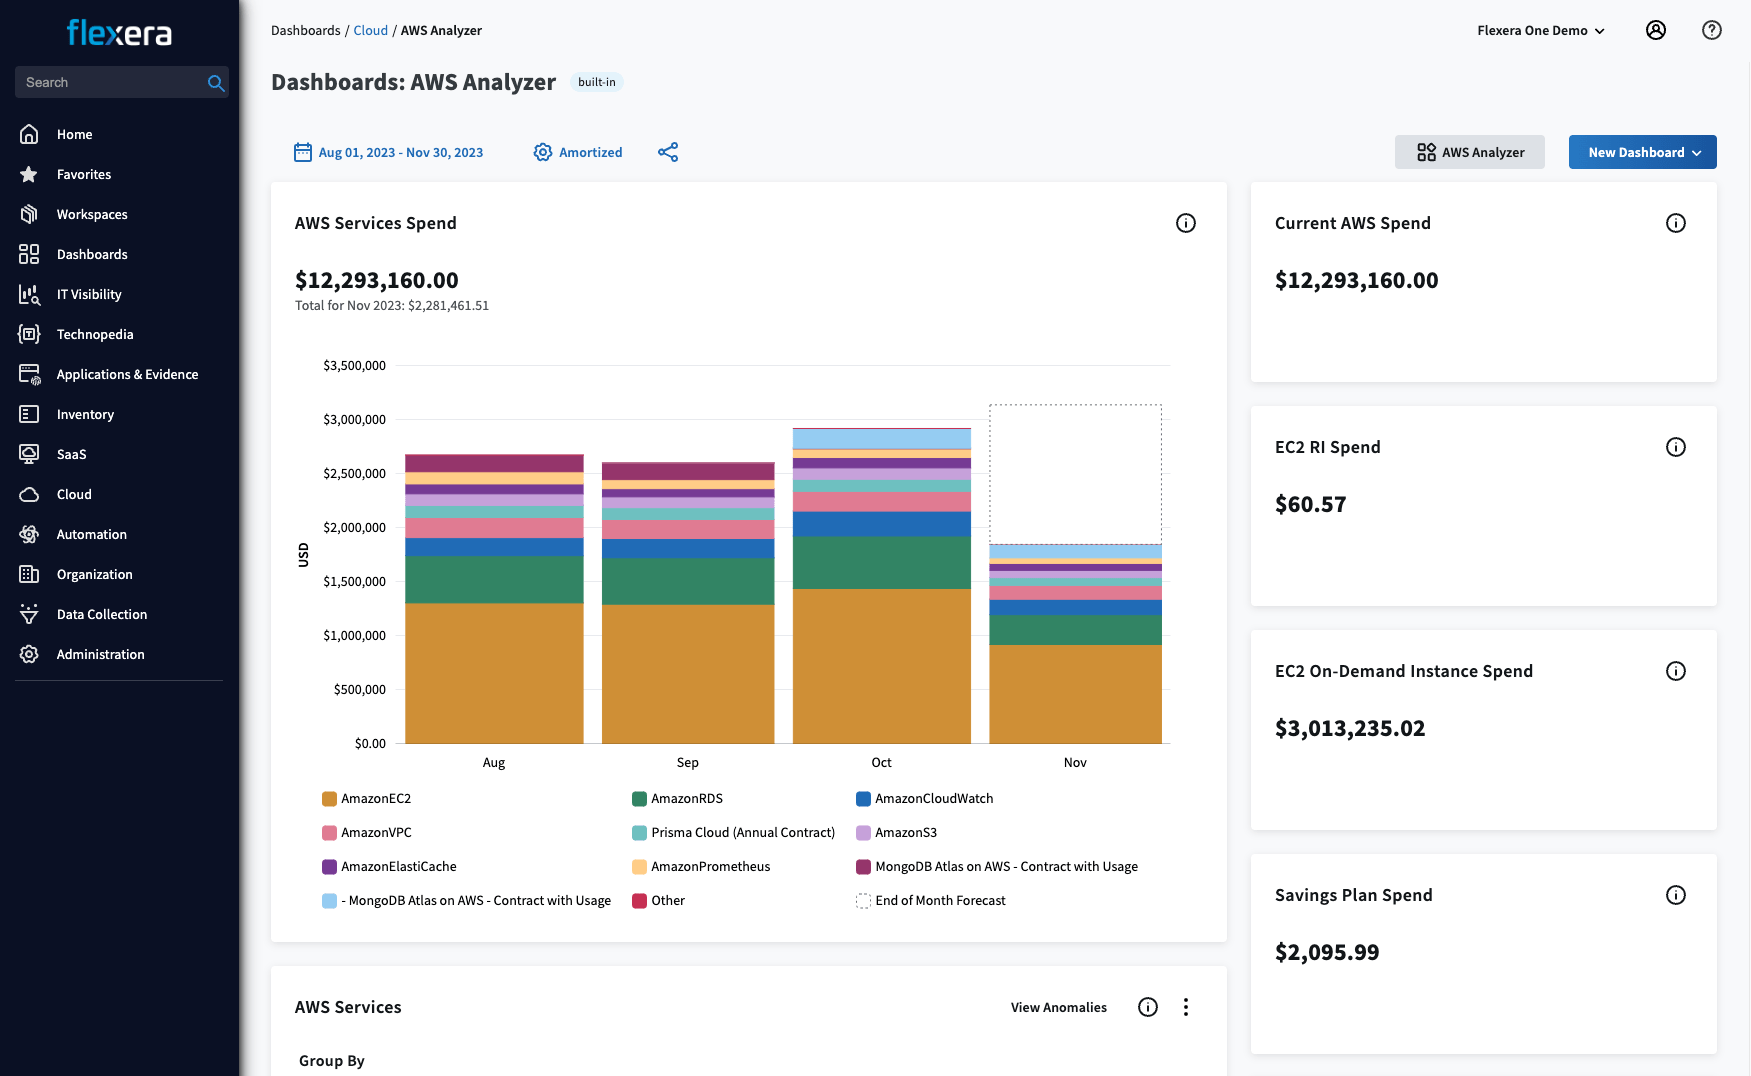
Optimization tools inside Flexera One
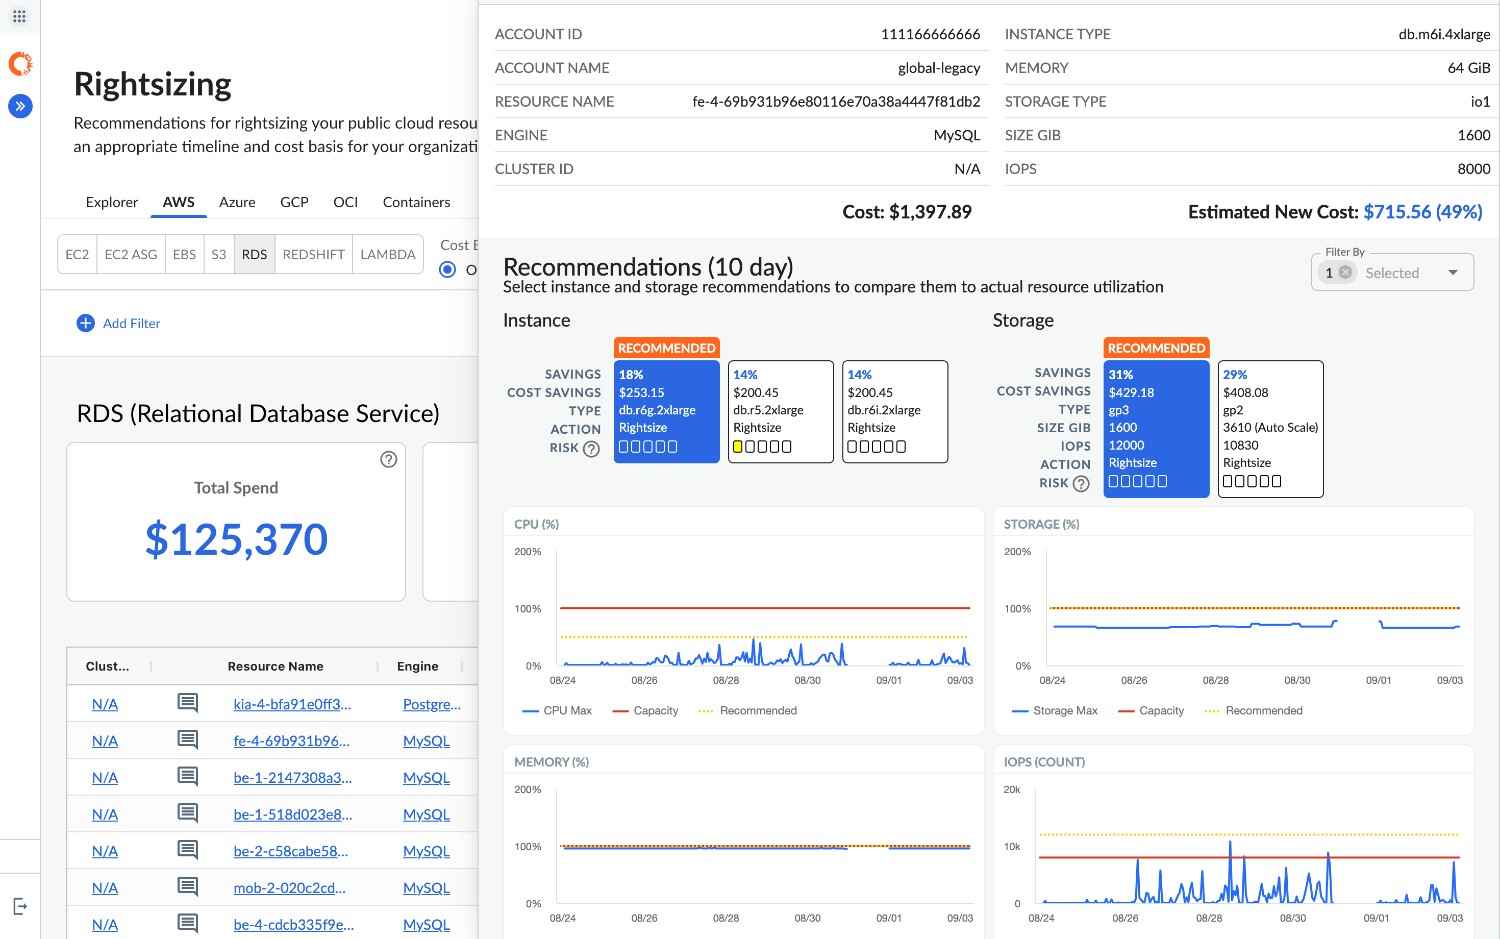
- Rightsizing recommendations: Analyze compute, database, and storage usage across clouds; apply utilization-based resize policies.
- Idle resource detection: Identify underused or unattached resources and automate shutdowns.
- Commitment optimization: Plan and manage RIs and Savings Plans across AWS and Azure, with clear coverage and utilization metrics.
- Anomaly detection: Detect cost spikes across accounts or services and correlate to the underlying changes.
- Budget tracking and variance alerts: Keep teams aligned on spend forecasts and overage prevention.
- Chargeback/showback reports: Allocate cloud cost by product, business unit, or team.
- Multi-cloud analytics: Unified dashboard for AWS, Azure, and GCP with normalized data and service mapping.
- Integration-ready APIs: Connect cost signals to ITSM tools like ServiceNow or CMDBs for compliance.
Pricing
Flexera uses an enterprise spend-based pricing model, usually starting around $50,000 per year for managing up to $1M in annual cloud spend. Beyond that, pricing scales predictably with usage and module selection.
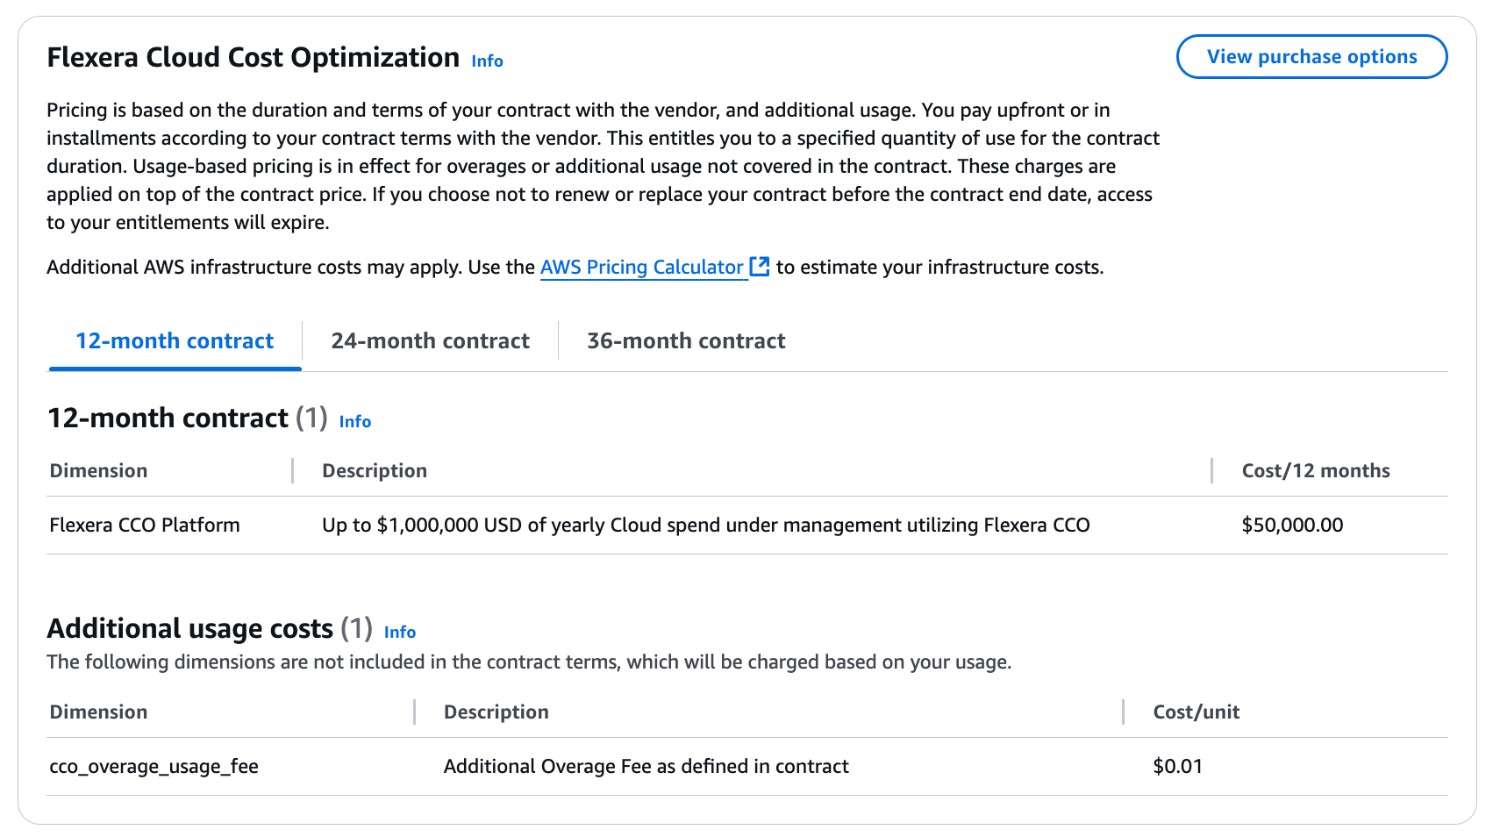
Contracts are typically annual and negotiated per customer scope, including modules for governance, automation, and FinOps analytics. This pricing structure fits enterprises that need predictable budgeting and centralized cost optimization control across multiple cloud environments.
Pros and cons
Based on reviews from real users.
✅ Mature cost optimization and governance automation. G2.
✅ Advanced rightsizing and idle resource management.
✅ Deep integration with CMDB, ITSM, and financial systems.
✅ Scales well for regulated or audited environments. Gartner.
⚠️ Initial setup and data normalization can be time-intensive. Gartner.
⚠️ Real-time actions require custom policy configuration.
Read also: What Is Rightsizing in Cloud Cost Optimization? Pro Insights
IBM Cloudability (Apptio Cloudability)
G2: ★★★★☆ 4.3/5
Trial days: 30
Best for: large enterprises that need full control and visibility over multi-cloud and Kubernetes costs
IBM Cloudability ingests billing data from AWS, Azure, and GCP and connects it to resource metrics. This way, you can see exactly how workloads, services, and teams drive total cloud cost. Cloudability focuses on accountability, forecasting, and rightsizing instead of automated remediation. That makes it ideal for mature FinOps programs that already have governance workflows in place.
A key strength is IBM Cloud Kubernetes cost optimization. It links CPU, memory, and storage data from clusters to billing exports. You can break down cost by namespace or workload, find underused pods, and track how resource changes affect monthly costs.
Optimization tools inside Cloudability
- Kubernetes cost allocation: Visibility from cluster to namespace, workload, and owner.
- Rightsizing recommendations: Detect and optimize underused EC2, RDS, and containerized workloads.
- Forecasting and trend analysis: Predict future cloud spend based on historical data and seasonal usage patterns.
- Anomaly detection: Identify unexpected spending changes and surface root causes.
- Chargeback/showback automation: Allocate cloud cost by team, project, or product line.
- Integration-ready reporting: Export cost and utilization data to BI, accounting, or FinOps systems.
- Multi-cloud visibility: Unified billing analytics across AWS, Azure, and GCP environments.
Pricing
Cloudability is sold as part of ApptioOne Cloud, priced by managed cloud spend. For most mid-size enterprises, costs start around $30,000 per year, depending on modules and integrations. Here’s the table with the cost breakdown we found:
| Plan | Managed Cloud Spend | Annual Cost |
|---|---|---|
| CLDY1MYEAR | Up to $1M | $30,000 |
| CLDY3MYEAR | Up to $3M | $76,680 |
| CLDY6MYEAR | Up to $6M | $132,480 |
If your spend exceeds the contracted amount, overage fees apply. These start at about $3,300 per extra unit and vary by plan type. It’s a predictable model for stable usage but can get expensive if your workloads grow faster than planned.
Pros and cons
Based on reviews from real users.
✅ Detailed financial and technical analytics in one platform. G2.
✅ Strong Kubernetes cost visibility through IBM cloud kubernetes cost optimization.
✅ Accurate forecasting and RI/SP tracking.
✅ Trusted by large enterprises for governance and audits. Gartner.
⚠️ Optimization actions require manual engineering follow-up. Gartner.
⚠️ Pricing is not suitable for startups. G2.
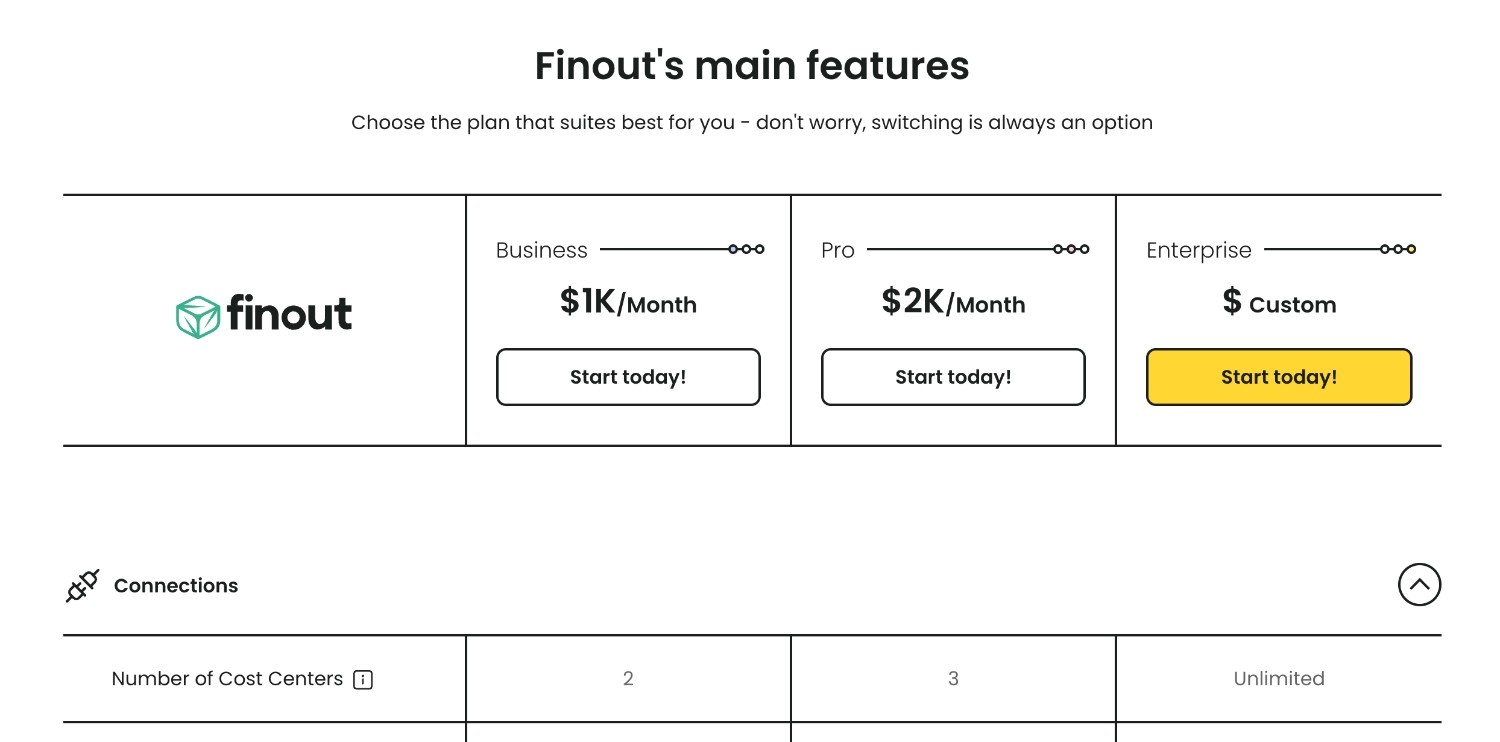
Finout
G2: ★★★★☆ 4.5/5
Trial days: 14
Best for: startups and scale-ups using multiple cloud and SaaS vendors that need a single source of truth for their spending
Finout treats optimization like a teammate. It taps you on the shoulder with simple advice: shrink this, stop that, and here’s why. Its CostGuard engine finds real savings across your clouds. It highlights oversized instances, idle resources, and missing commitments before you start paying on-demand rates.
The platform connects to AWS, GCP, and Kubernetes. It also pulls in Datadog signals so you don’t have to switch between dashboards. Rightsizing tips aren’t vague. CostGuard tells you which instance class to move to or which node to resize based on usage data. That means engineers know exactly what to fix without wasting time.
Idle detection works the same way. It flags cloud costs tied to underused compute, storage, and clusters. Then it groups them by team, feature, or customer through Virtual Tags. This way, cleanup decisions are fast and clear.
Optimization tools inside Finout
- Rightsizing recommendations: Detailed compute, database, and Kubernetes rightsizing based on usage.
- Idle detection: Highlights unused resources across compute, storage, and clusters, grouped by business context.
- Commitment tracking: Surfaces gaps in Reserved Instances and Savings Plans.
- Anomaly detection: Sends real-time alerts for unexpected spend changes.
- Virtual Tags: Groups cost by feature, team, or customer.
- Cross-cloud visibility: Tracks AWS, GCP, Azure, Snowflake, Datadog, and more.
- Budget monitoring: Flags when spend nears defined limits.
- API access: Sends data to BI tools or FinOps dashboards.
Pricing
Finout uses fixed monthly plans based on your yearly cloud spend. Pricing stays predictable. You choose a plan and connect your bills. There are no hidden fees or overage charges.
For example, a company managing $500,000 in annual cloud spend might pay around $12,000–$15,000 per year to run Finout. Finout typically offsets this cost by uncovering 5–10% of hidden inefficiencies in shared infrastructure or underutilized instances. The model fits teams that want to achieve cost optimization through visibility and actionable data before automating changes.
Pros and cons
Based on reviews from real users.
✅ Fast and practical cost recommendations. G2.
✅ Real-time anomaly detection and alerts.
✅ Works across AWS, GCP, and SaaS platforms. G2.
✅ Easy setup with Virtual Tags.
⚠️ No auto-remediation or scheduling features.
⚠️ Tag-based setups work but limit visibility. G2.
⚠️ Lacks some dashboards and views, making common metrics harder to monitor. G2.
Read also: 7 Best Cost Allocation Software 2025 - Tools, Features & Pricing
Zesty
G2: ★★★★★ 4.8/5
Trial days: 14
Best for: DevOps and FinOps teams managing dynamic AWS workloads that constantly change in size and demand
Zesty connects directly to AWS and tracks how your workloads behave throughout the day. It watches CPU, memory, and storage usage and automatically adjusts capacity to match demand. When activity slows down, Zesty releases or resizes idle resources. When traffic picks up, it scales them back up instantly. This way, performance stays steady while unnecessary cloud costs quietly disappear.
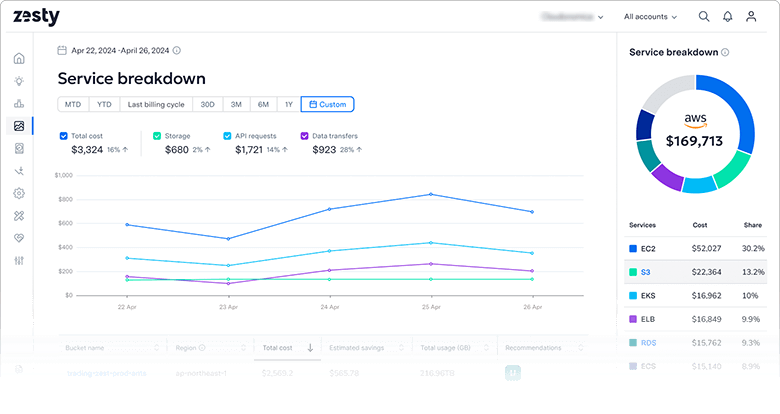
The system learns usage patterns and plans capacity ahead of time. That means fewer sudden cost spikes and better control over unpredictable workloads. You can track everything in a simple dashboard that shows current utilization, savings, and total impact on your AWS bill.
Optimization tools inside Zesty
- Automatic rightsizing: Adjusts EC2 and EBS resources based on real usage data.
- Dynamic commitments: Optimizes Reserved Instances and Savings Plans automatically.
- Predictive scaling: Anticipates workload changes and adjusts capacity before demand shifts.
- Continuous monitoring: Tracks CPU, memory, and I/O utilization across all instances.
- Idle detection: Identifies resources that stay unused for extended periods.
- Anomaly alerts: Sends notifications when spend or utilization moves outside normal patterns.
Pricing
Zesty uses a performance-based pricing model. You only pay when the platform saves you money.
Most customers spend around 10–20% of their verified monthly savings. For example, if Zesty cuts $10,000 from your AWS bill, your cost would be between $1,000 and $2,000 for that month. This model works well for teams that prefer measurable results and transparent pricing over fixed subscriptions.
Pros and cons
Based on reviews from real users.
✅ Hands-free optimization with real savings. G2.
✅ Predictive scaling that reduces waste before it happens
✅ Clear dashboards with easy tracking. G2.
✅ Fast setup and quick ROI.
⚠️ Focused on AWS, so no native multi-cloud support.
⚠️ Limited manual control for teams that prefer to approve changes. G2.
Read also: Compare 12 Best FinOps Tools: Features, Price, Pros & Cons
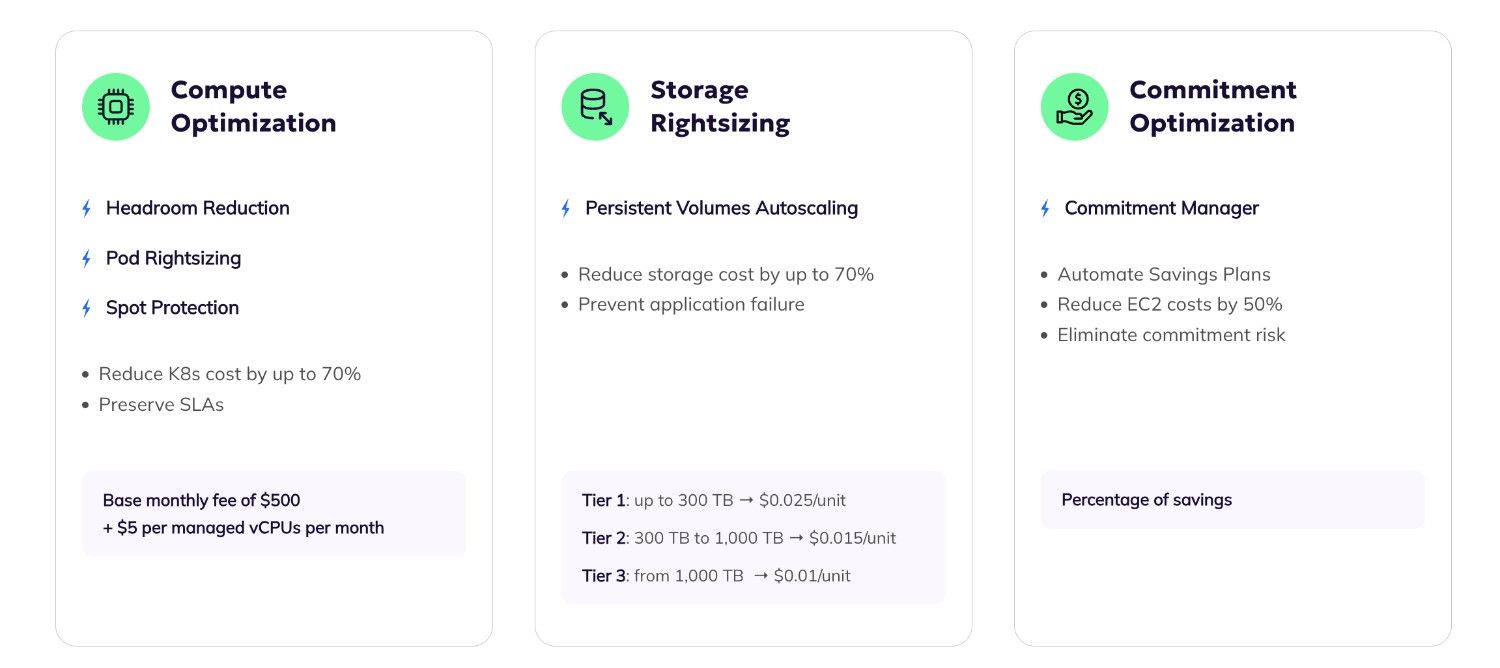
Akamas
Featured Customers: ★★★★☆ 4.8/5
Trial days: 30
Best for: SRE and platform teams running complex Kubernetes or hybrid environments that need to balance performance and cost
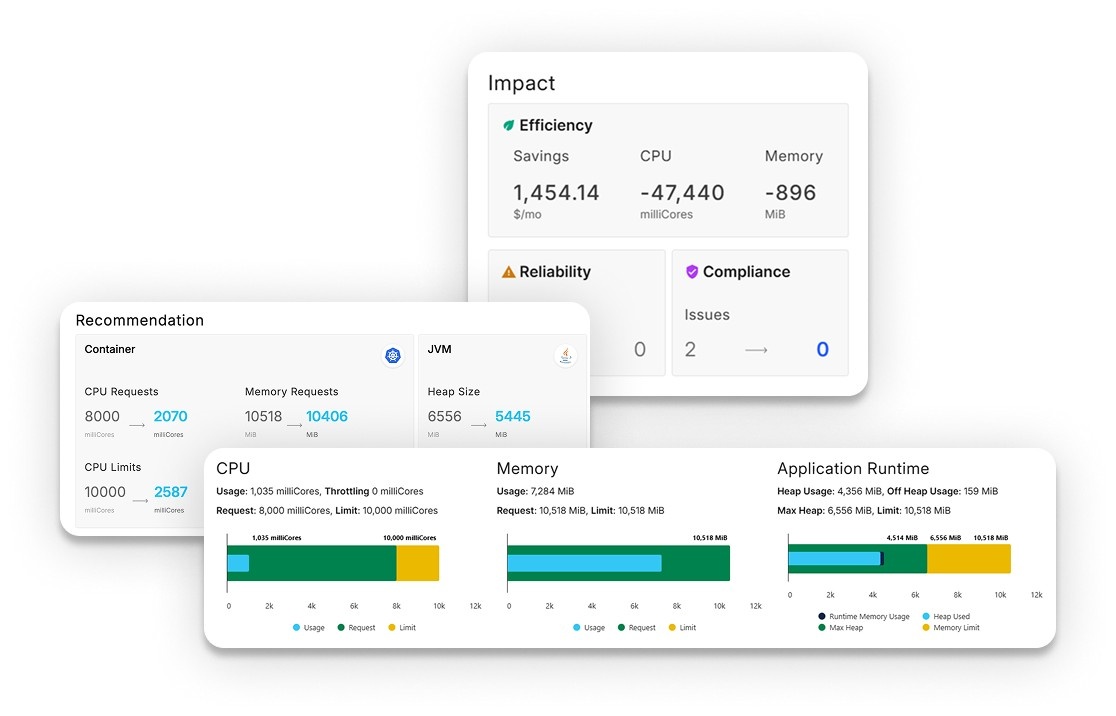
Akama is one of the cloud cost optimization services. The platform uses machine learning to analyze runtime data such as CPU, memory, JVM flags, and autoscaling thresholds. It tests different settings automatically and identifies combinations that reduce waste while keeping performance stable. This approach turns tuning into a measurable, repeatable process.
The core of Akamas Cloud Infrastructure Kubernetes cost optimization lies in its ability to link performance data with actual spend. You can run experiments to see how parameter changes affect both latency and cost. That means engineers can make decisions based on real data, not assumptions.
Optimization tools inside Akamas
- AI-driven optimization: Uses machine learning to test and tune system parameters automatically.
- Kubernetes optimization: Adjusts CPU, memory, and autoscaler settings for pods and nodes.
- Scenario testing: Runs experiments to compare configuration options and predict outcomes.
- Continuous optimization loop: Adapts automatically as workloads evolve.
- Performance analytics: Correlates runtime metrics with cloud cost impact.
- Multi-cloud support: Works across AWS, Azure, and on-prem clusters.
- Integration with observability tools: Connects with Prometheus, Grafana, and Datadog for real-time data.
- Policy control: Sets optimization goals like lowest cost, best throughput, or latency target.
Pricing
Akamas uses a subscription model based on optimization credits. Each credit represents one active optimization study, such as tuning a Kubernetes cluster or application. Credits can be reused across projects during the subscription period.
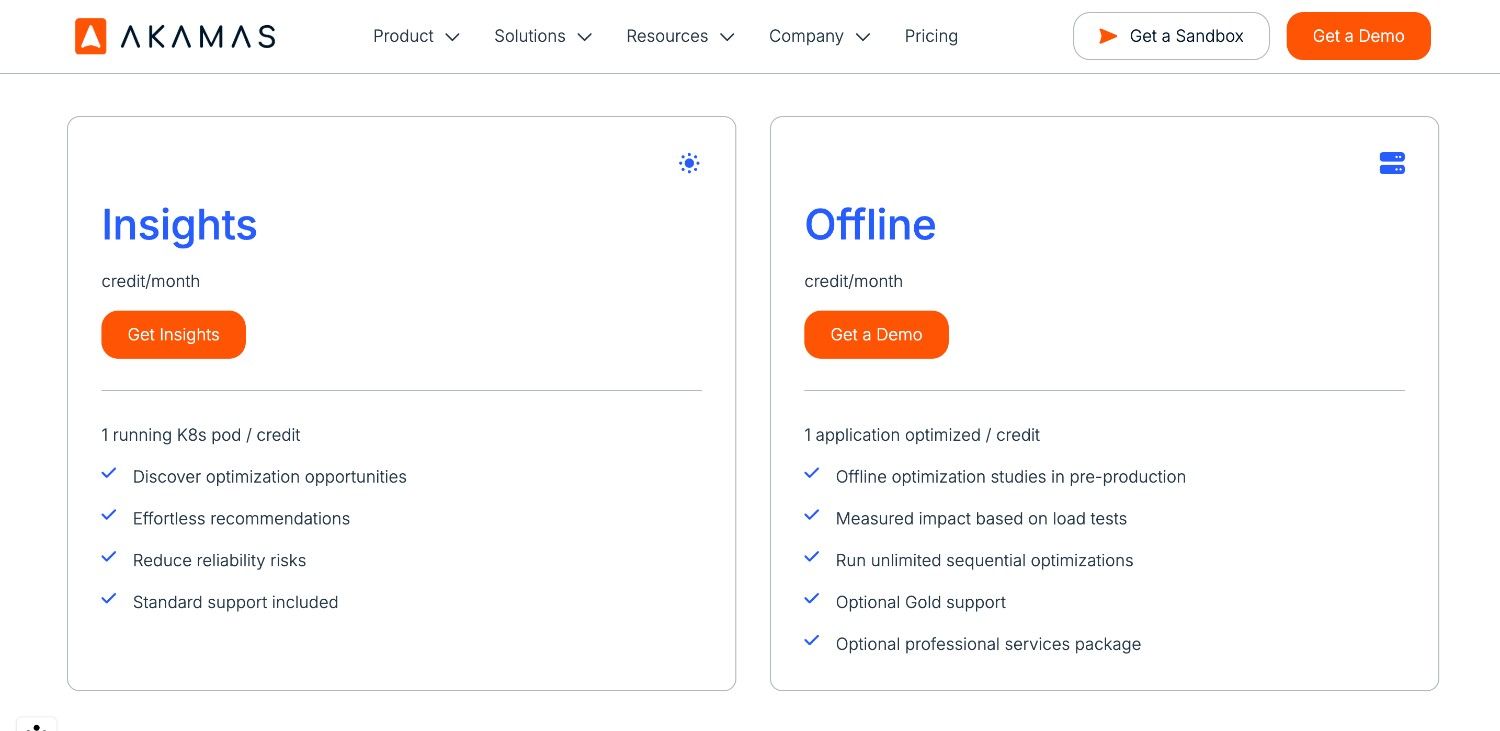
Pricing depends on how many optimization studies run in parallel. For example, if your cloud infrastructure costs about $50,000 per month, tuning that reduces CPU and memory usage by 20% could save around $10,000 monthly. The subscription cost is typically a fraction of those savings, scaling with usage and complexity.
Pros and cons
Based on reviews from real users.
✅ AI-driven optimization that improves both performance and cost.
✅ Strong focus on Kubernetes and hybrid environments.
✅ Integration with leading monitoring and observability platforms.
✅ Continuous learning and adjustment as workloads change.
⚠️ Requires initial setup and time to define optimization goals.
⚠️ Limited financial reporting, so best used alongside a FinOps platform.
Read also: 10 Cloud Cost Optimization Benefits or Why It’s a Must In 2026
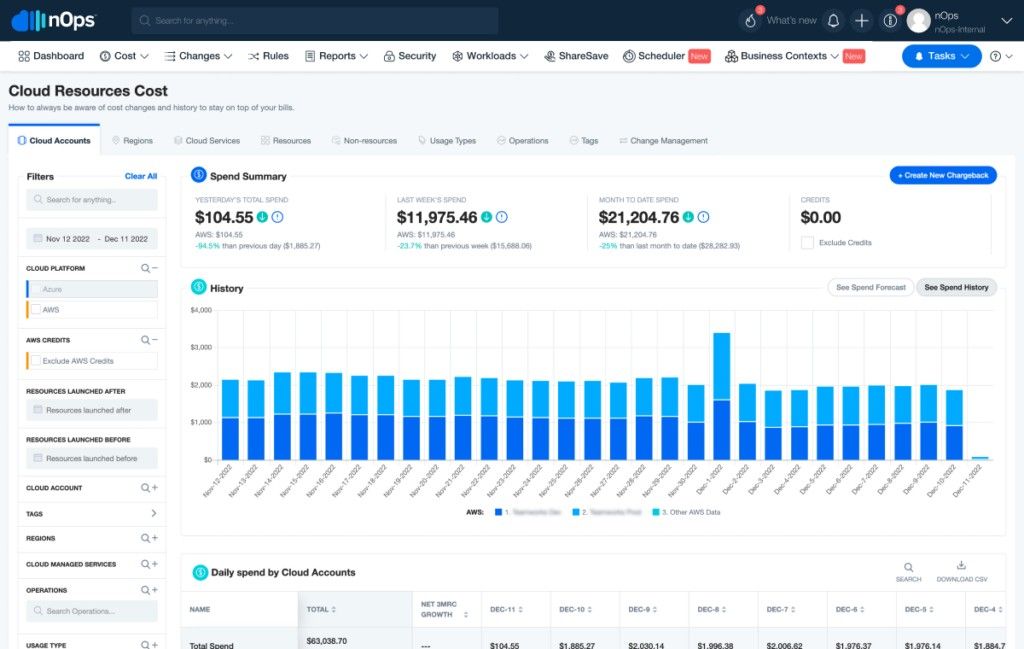
nOps
Capterra: ★★★★☆ 4.6/5
Trial: 30 days
Best for: AWS-native DevOps and FinOps teams seeking automation and continuous optimization.
nOps uses ML to understand usage patterns and take action automatically. It turns off unused instances, reconfigures over-provisioned resources, and shifts workloads to cheaper spot capacity when possible. That means you get measurable savings without manual work or daily reviews.
You can also use nOps to optimize container clusters and align operations with the AWS Well-Architected Framework. Its compliance checks flag inefficiencies, security risks, and over-spending patterns in one place.
So, how does nOps compare to other cloud cost optimization tools? It’s more proactive. Tools like CloudZero or Finout focus on visibility and reporting. nOps focuses on automation and acts directly on your resources instead of just recommending changes.
Features
- Automated rightsizing: Continuously optimizes EC2, RDS, and EKS resources based on live usage.
- Idle detection: Finds and stops unused environments automatically.
- Commitment optimization: Manages Reserved Instances and Savings Plans to match workload demand.
- Spot instance automation: Runs eligible workloads on cost-efficient spot capacity.
- Anomaly detection: Flags unusual spend and identifies the root cause.
- Compliance automation: Aligns cloud configurations with AWS Well-Architected best practices.
- Forecasting: Predicts monthly cloud spend and highlights variance early.
- Integrations: Connects to Slack, Jira, and email for real-time notifications and reports.
Pricing
nOps uses a spend-based subscription model that scales with your AWS usage. Smaller environments usually start around $1,000 per month, with larger deployments priced by total managed spend.
For example, a company spending $250,000 per month on AWS could expect 15–20% savings after automation, often offsetting the license fee within one billing cycle.
This model fits teams that want continuous optimization and clear ROI without manual tuning.
Pros and cons
Based on reviews from real users.
✅ Fully automated cost optimization across AWS workloads.
✅ Uses spot instance automation for real-time savings. Capterra.
✅ Aligns with AWS Well-Architected best practices.
✅ Simple setup and fast measurable ROI. G2.
⚠️ AWS-only focus (limited support for Azure or GCP). G2.
⚠️ Limited customization for complex enterprise reporting. Capterra.
Read also: 13 Cloud Cost Optimization Best Practices to Use in 2026
Snowflake
Capterra: ★★★★☆ 4.6/5
Trial: 30 days
Best for: data engineering and analytics teams managing large compute and storage workloads.
Snowflake grew into more than just a data warehouse. It added features like Snowpark, a data marketplace, and support for Python and Java workloads. These additions allow engineering and analytics teams a lot of freedom, but they also add complexity and cost.
As one engineer on Reddit put it, “Snowflake is plug and play with great performance, but it can get expensive fast.”
Snowflake cloud cost optimization software is strong for teams that care about reliability and concurrency. It handles multiple workloads at once without resource contention. Many users call Snowflake one of the best cloud cost optimization software solutions for data workloads — as long as you know how to manage it properly.
Optimization tools inside Snowflake
- Warehouse auto-suspend and resume: Turns off idle compute automatically to reduce spend.
- Query profiling: Shows which queries use the most resources and where optimization can save time and money.
- Credit tracking: Monitors usage in near real time and forecasts monthly spend.
- Workload tuning: Adjusts virtual warehouse sizes to match usage patterns.
- Multi-cluster scaling: Adds or removes compute clusters automatically for concurrency.
- Integration with FinOps tools: Connects to platforms like Finout or CloudZero for unified cost analytics.
- Alerts and reporting: Flags spikes in usage or credit consumption with detailed breakdowns.
Pricing
Snowflake uses a pay-per-use model based on credit consumption. Each query, compute cycle, or storage operation consumes credits depending on the warehouse size and duration.
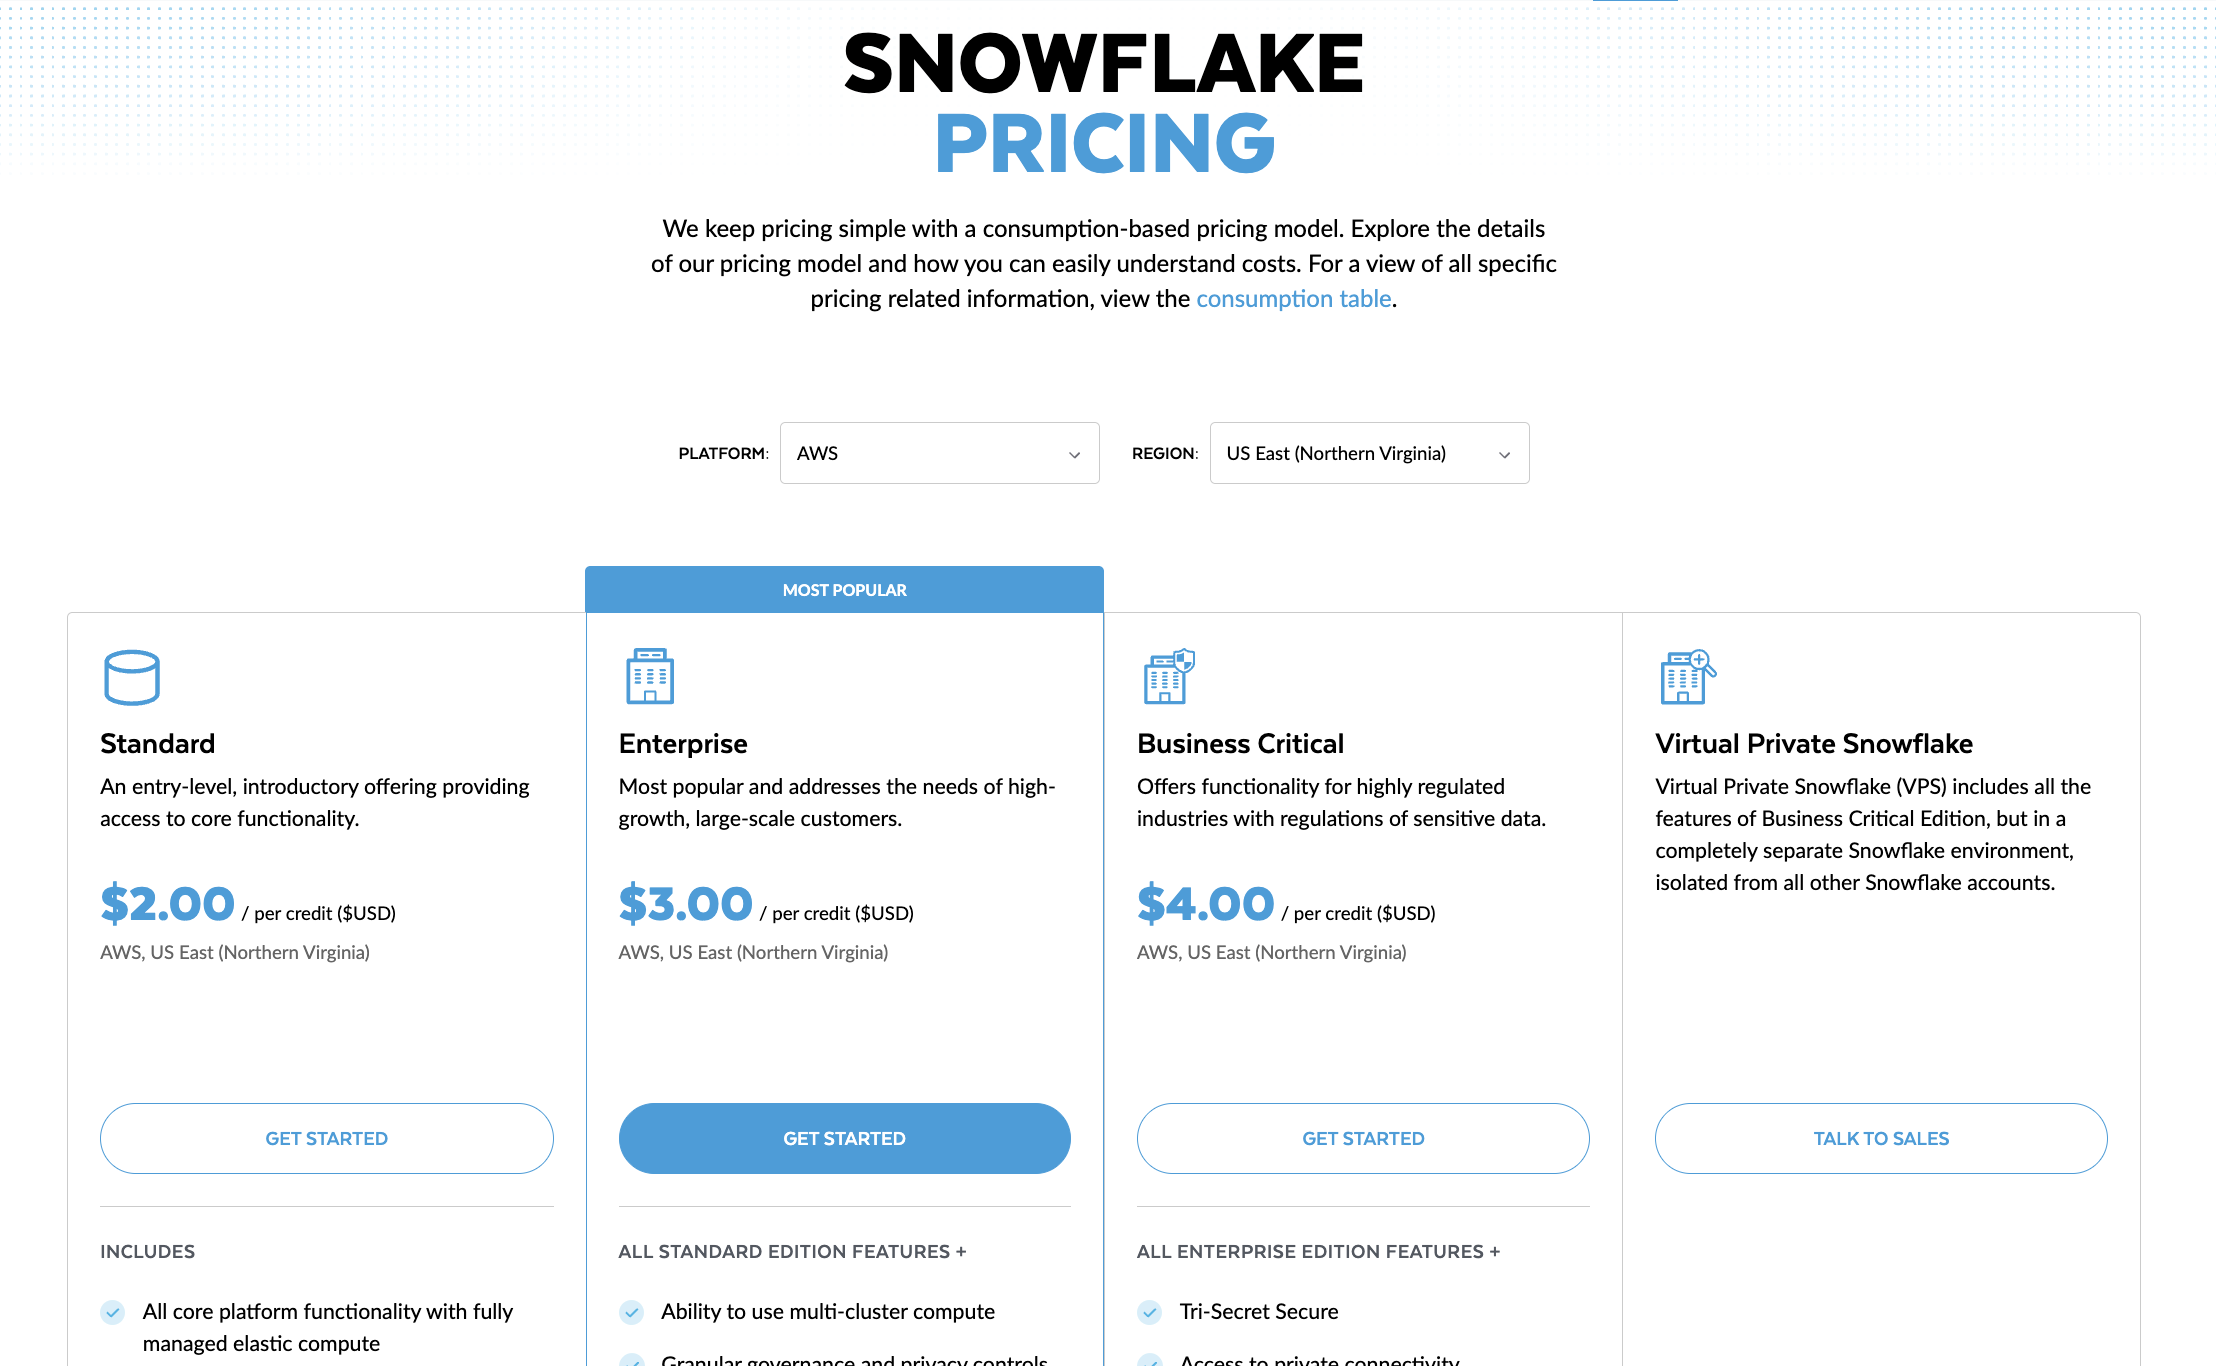
For example, a medium data warehouse running 8 hours per day might consume around 250 credits monthly, translating to roughly $1,250–$2,000, depending on region and negotiated rate. Optimizing query efficiency and scheduling jobs during off-hours can lower costs by 20–40%.
Snowflake’s pricing structure fits teams who actively monitor compute usage and want direct control over how their resources scale with demand.
Pros and cons
✅ Strong performance and concurrency for analytics workloads. G2.
✅ Simple setup with automatic scaling and high reliability.
✅ Effective credit and storage optimization controls. G2.
✅ Easy integration with FinOps and BI tools. Capterra.
⚠️ Can become expensive without active cost monitoring. G2.
⚠️ Requires tuning and experience to optimize efficiently.
Cloud cost optimization tools comparison table
Here is solution comparison for public cloud third party cost optimization tools to help you make a choice:
| Solution → Tool ↓ | Cloudaware | VMware Aria Cost | CloudZero | Flexera One | IBM Cloudability | Finout | Zesty | Akamas | nOps | Snowflake |
|---|---|---|---|---|---|---|---|---|---|---|
| Idle Detection | ✅ | ⚠️ | ⚠️ | ✅ | ⚠️ | ✅ | ✅ | ✅ | ✅ | ✅ |
| Rightsizing | ✅ | ✅ | ⚠️ | ✅ | ✅ | ✅ | ✅ | ✅ | ✅ | ⚠️ |
| Commitment Management (RIs/SPs) | ✅ | ✅ | ⚠️ | ✅ | ✅ | ✅ | ✅ | ❌ | ✅ | ⚠️ |
| Anomaly Detection | ✅ | ✅ | ✅ | ✅ | ✅ | ✅ | ⚠️ | ⚠️ | ✅ | ✅ |
| Kubernetes Optimization | ✅ | ⚠️ | ✅ | ⚠️ | ✅ | ✅ | ⚠️ | ✅ | ✅ | ⚠️ |
| Tag Governance / Allocation | ✅ | ✅ | ⚠️ | ✅ | ✅ | ✅ | ⚠️ | ✅ | ✅ | ⚠️ |
| Automation Level | ⚠️ | ⚠️ | ❌ | ⚠️ | ⚠️ | ⚠️ | ✅ | ✅ | ✅ | ⚠️ |
| Cross-Cloud Support | ✅ | ✅ | ✅ | ✅ | ✅ | ✅ | ❌ | ✅ | ❌ | ✅ |
Key Takeaways
1. Cloudaware is the most balanced tool overall. It blends multi-cloud coverage, deep CMDB integration, and policy-based automation that connects directly to workflows in Jira or Slack. Engineers can act on cost anomalies instantly, and every alert ties to a real asset or owner.
2. Zesty and nOps lead in full automation. Zesty automates optimization for AWS in real time, while nOps continuously manages commitments and spot usage without manual review.
3. Akamas dominates Kubernetes optimization. Its AI tuning adjusts cluster parameters dynamically, improving both performance and cost efficiency — ideal for hybrid and large-scale environments.
4. Finout and CloudZero win on cost visibility. Both make cloud costs understandable for engineers, mapping spend to teams, features, and products.
5. IBM Cloudability and Flexera remain enterprise staples. They deliver the deepest analytics and governance frameworks, though they rely on manual execution.