


Your AWS CURs are throttling S3, Azure invoices arrive in three currencies, and yesterday’s GKE spike still isn’t tied to a cost center — yet leadership wants the numbers tight by Friday. Been there, friend.
In this piece we’ll walk task-by-task through a FinOps day in the trenches:
- Discover & inventory – pulling raw CUR/EA/GCP exports and mapping them to every tag, label, and orphaned VM.
- Allocate & report – slicing spend into unit costs for apps, squads, and that stubborn on-prem VMware cluster.
- Forecast & budget – turning month-end deltas into rolling, multi-cloud runway projections.
- Optimize & commit – rightsizing, RI/Savings-Plan strategy, and container-level kill switches.
- Detect & govern – real-time anomaly pings, policy-as-code guardrails, and exec-ready scorecards.
- Automate & iterate – APIs, Terraform hooks, and Slack workflows that keep the flywheel spinning.
By the last paragraph, you’ll know whether Cloudaware or Cloudability best greases each cog.
Get to know Cloudaware and Cloudability
Pause the forecasting spreadsheets and hold that “delete-or-keep?” EBS debate — first, we need to meet the two FinOps heavy lifters that pop up in every cloud war room: Cloudaware and Cloudability.
If your day revolves around reconciling 500-line AWS CURs, translating Kubernetes pod explosions for Finance, and keeping Azure RGs tagged before midnight, you’re in the right story. These platforms aren’t mere spend thermometers — they’re the operating systems that let FinOps permeate engineering, finance, and operations without a food fight.
Cloudaware
Picture a live, agent-free pipeline that slurps AWS, Azure, GCP, VMware, Alibaba, Oracle Cloud billing data the instant it lands, then bolts every dollar onto the exact CI it powers — app, microservice, environment, even sprint tag. Because Cloudaware is natively welded to a Salesforce-grade CMDB, you’re not staring at raw spend; you’re seeing cost plus rich context: who owns the resource, what team it belongs to, and how it maps to business value — all refreshed in real time.
Quick hits:
- Agentless setup — connects to AWS, Azure, GCP, Oracle, Alibaba through APIs.
- Pulls in billing, security, infra, and CMDB data — so you always know who owns what and why it costs money.
- Tracks cloud costs in real time, mapped to apps, services, regions, and environments
- Includes full ITAM support — cost by asset class, lifecycle, or even SLA compliance.
- Automates workflows with Force.com logic — think budget breaches triggering Jira tickets or idle resources flagged in your CMDB view.
A built-in tag-doctor keeps that context pristine. It hunts for broken or missing Cost Center, Product, Team, and Owner tags, auto-patches them with rules or lookups, and backfills the history so allocation coverage never slips.
The result? Dashboards that stay 100 % allocated, Slack alerts that hit the right engineer on the first try, and finance reports that read like a story instead of a mystery novel.
Used by ops-heavy teams who care about ownership, reporting, and structured cost management that scales.
What is Cloudability
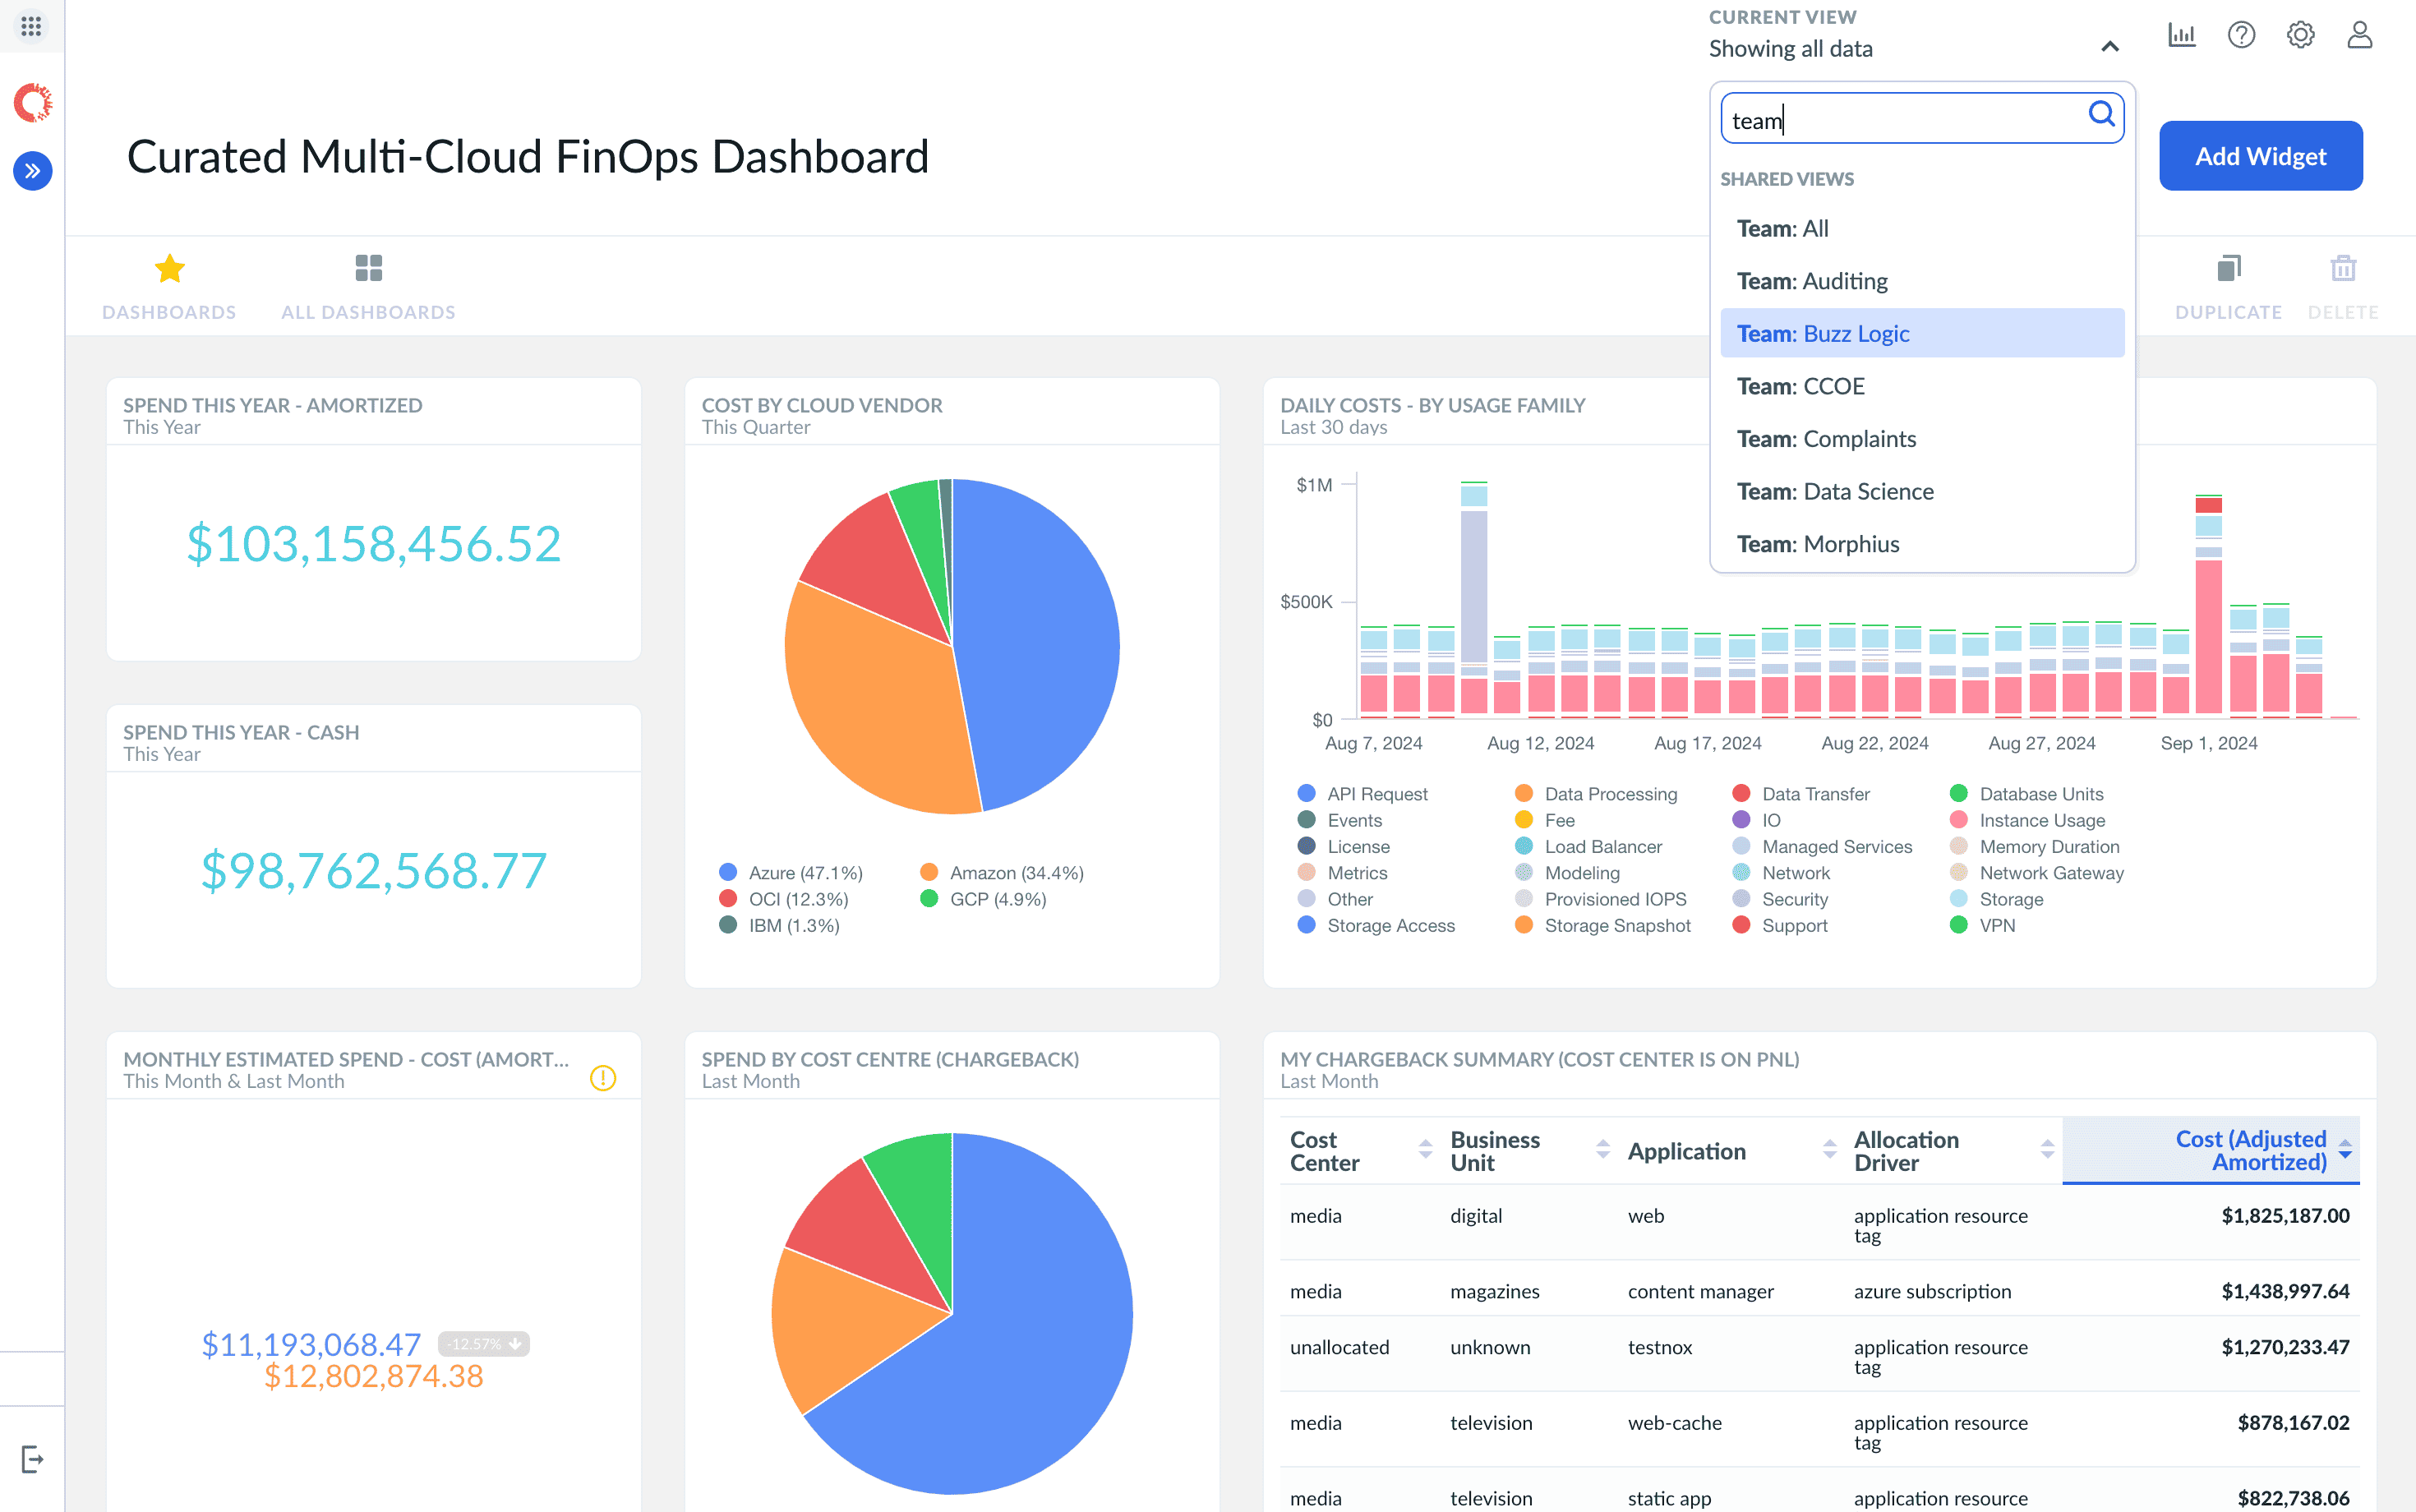
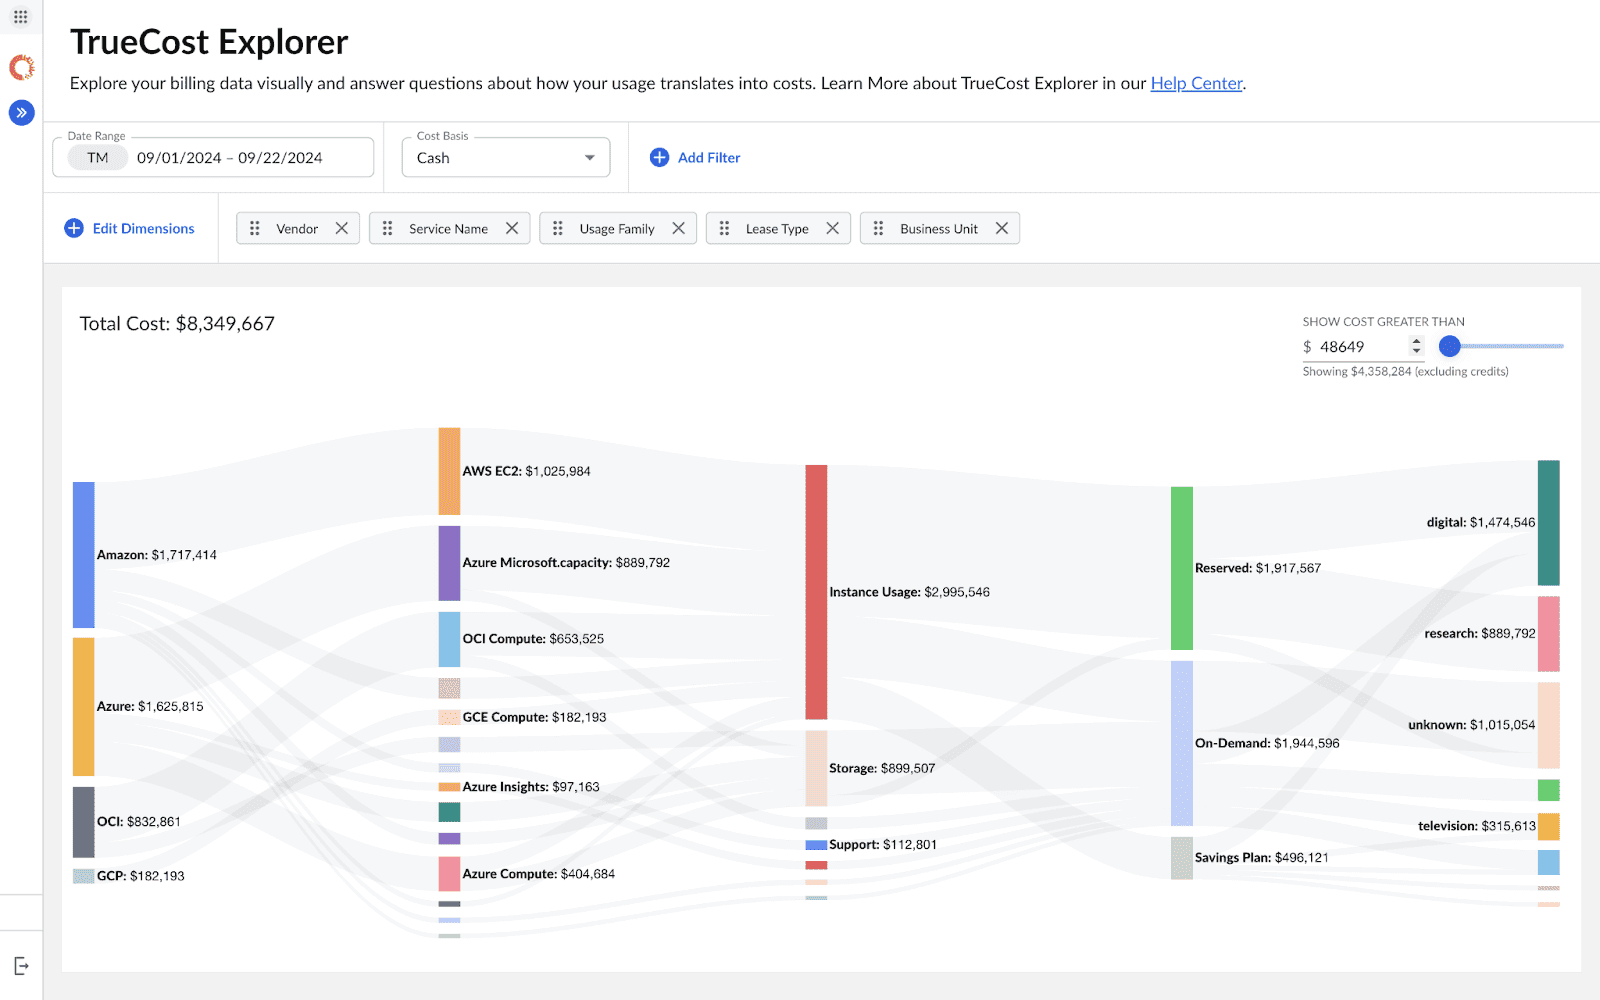
Cloudability dashboard. Image source.
Imagine a financial GPS wired straight into every deployment pipeline. That’s Apptio Cloudability. Its Business Mapping engine reshapes raw CUR lines into cost objects your ledger already understands — think “streaming-api-prod-EU” instead of i-0ff123.
Showback, chargeback, unit economics and TBM alignment land in PowerBI-ready feeds while engineers eyeball the same numbers in Grafana. Commitment-orchestration bots balance Savings Plans and RIs like a Wall Street trader, and anomaly guards ping you the second a stray Helm chart doubles your S3 egress.
In short, Cloudability turns sprawling multi-cloud spend into narratives Finance can defend at the next board call.
Used by product-led orgs who want engineering, finance, and DevOps to speak the same cost language — in real time.
| FinOps Capability | Cloudaware | Cloudability |
|---|---|---|
| Supported Cloud Providers | AWS, Azure, GCP, VMware, Alibaba, Oracle Cloud, Kubernetes, Snowflake, MongoDB Atlas | AWS, Azure, GCP plus Kubernetes/OCI clusters via lightweight cost-metrics agent |
| Agentless Architecture | Yes (via API integrations) | SaaS connectors for billing (no agents) and an optional k8s-metrics sidecar for pod-level costs |
| Billing Data Ingestion to the platform | AWS CUR, Azure EA, GCP billing exports | Native CUR/EA/BigQuery import, currency normalization and FX refresh each ingest cycle |
| Real-Time Data Processing | Real-time via cloud API polling | Sub-hourly pipeline feeds True Cost Explorer and live scorecards |
| Anomaly Detection | Custom thresholds + Force.com alerts/workflows | ML anomaly engine flags spend spikes and emails/SaaS-pings owners |
| Forecasting & Budgeting | Dynamic forecasting, budget thresholds, escalation workflows | Multi-dimensional budgets, what-if sliders & variance KPIs |
| Tagging & Allocation Support | You can tag any object within CMDB automatically and custom | Business Mapping rewrites/augments bad tags and allocates every penny |
| Idle Resource Detection | Idle/underutilized resource views (e.g. EBS, RIs, snapshots), rightsizing recommendations | Rightsizing recommendations include “terminate” for zero-CPU/IO instances |
| Rightsizing Recommendations | Manual and rule-based rightsizing using CMDB relationships | Interactive rightsizing UI with scale-up/down/kill paths & savings tracker |
| Dashboards & Visualization | Analytics Studio + Usage Analytics (custom widgets, CMDB enriched), heat map | Scorecards, True Cost Explorer heat-maps, sustainability widgets |
| Custom Reporting | Any CMDB or cost field is drag-n-drop; scheduled PDF/Excel or Chatter push Cloudaware FinOps | Feed Apptio BI or export to Snowflake/BigQuery via GraphQL API for bespoke dashboards |
| Chargeback & Showback | Unlimited. You can create any report if there is its cost data within CMDB | Exec scorecards & TBM roll-ups for finance; auto-share unallocated spend list |
| CMDB Integration | Native; links cost to infrastructure, ownership, SLA, ITAM lifecycle | Out-of-the-box ServiceNow sync & Apptio One TBM taxonomy |
| ITAM Reporting Support | Yes – cost tracking by asset lifecycle, depreciation, ownership, risk level | ServiceNow incident & asset tables enriched with cost + utilization metadata |
| Workflow Automation | Apex + Force.com logic; triggers, tickets, escalations | Rightsizing tasks auto-open in ServiceNow; webhook into CI/CD for kill switches |
| Integrations | 60+ integrations including Jira, ServiceNow, PagerDuty, New Relic, Snowflake, Datadog, etc. | GraphQL/REST, DataDog, Snowflake, Terraform, ServiceNow & Kubernetes agent |
| Time to Value | 4–6 weeks | Live dashboards & anomaly alerts within first full CUR ingest (often < 24h) |
| FinOps Support Model | Every client has a dedicated Technical Account Manager who provide personalized setup | Dedicated Apptio FinOps practice, community playbooks & Gartner-ranked support |
| Best Fit For | Ops-led orgs with formal chargeback, ITAM, CMDB-driven governance | Enterprises chasing automated RI/SP trading, granular unit-economics & TBM alignment |
You’ve met the platforms. You’re ready for the deep dive.
Visibility: unifying cloud cost insights across clouds
We’re not talking about another pretty line chart. We’re talking capital-T Truth — the timestamped, owner-stamped, SKU-level receipt that lets you answer, “What are we spending, who spun it up, and does the value pencil out?” Two platforms light up that truth for FinOps teams everywhere: Cloudaware and Cloudability.
Cloudaware – FinOps visibility that thinks in context
Cloudaware’s whole thing is precision. It pulls in your AWS CUR, Azure EA, and GCP billing data, normalizes it daily, and gives you clear, tagged, and trackable cost breakdowns across clouds. So instead of “unknown compute resource in us-east-1,” you get “DevOps-Sandbox-EKS-Cluster-Beta.”
What helps most:
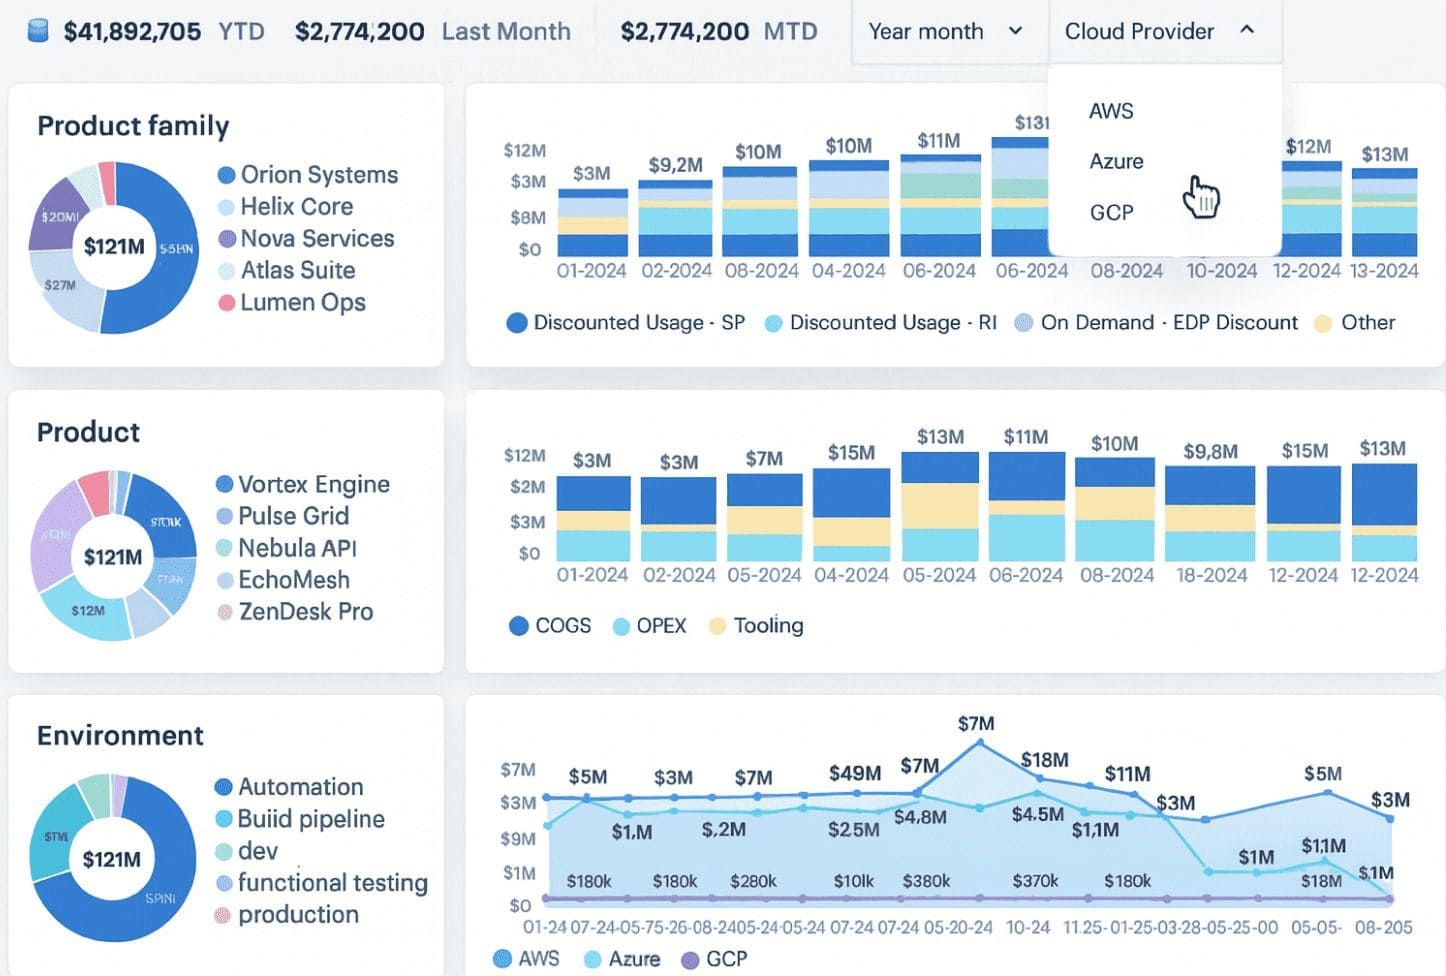
- Daily spend views auto-populate with accurate metadata (project, team, environment).
Element of the Cloudaware FinOps dashboard. See it in action on a live demo. - You can filter by blended, unblended, amortized, or list rate — no guessing what finance is looking at.
Element of the Cloudaware FinOps dashboard. See it in action on a live demo. - Missed tags? Cloudaware’s dashboards don’t just drop them — they flag them.
- Every widget, filter, and view is FinOps-aware: showback, allocation, anomaly outliers, and trending over time — all exportable, all automatable.
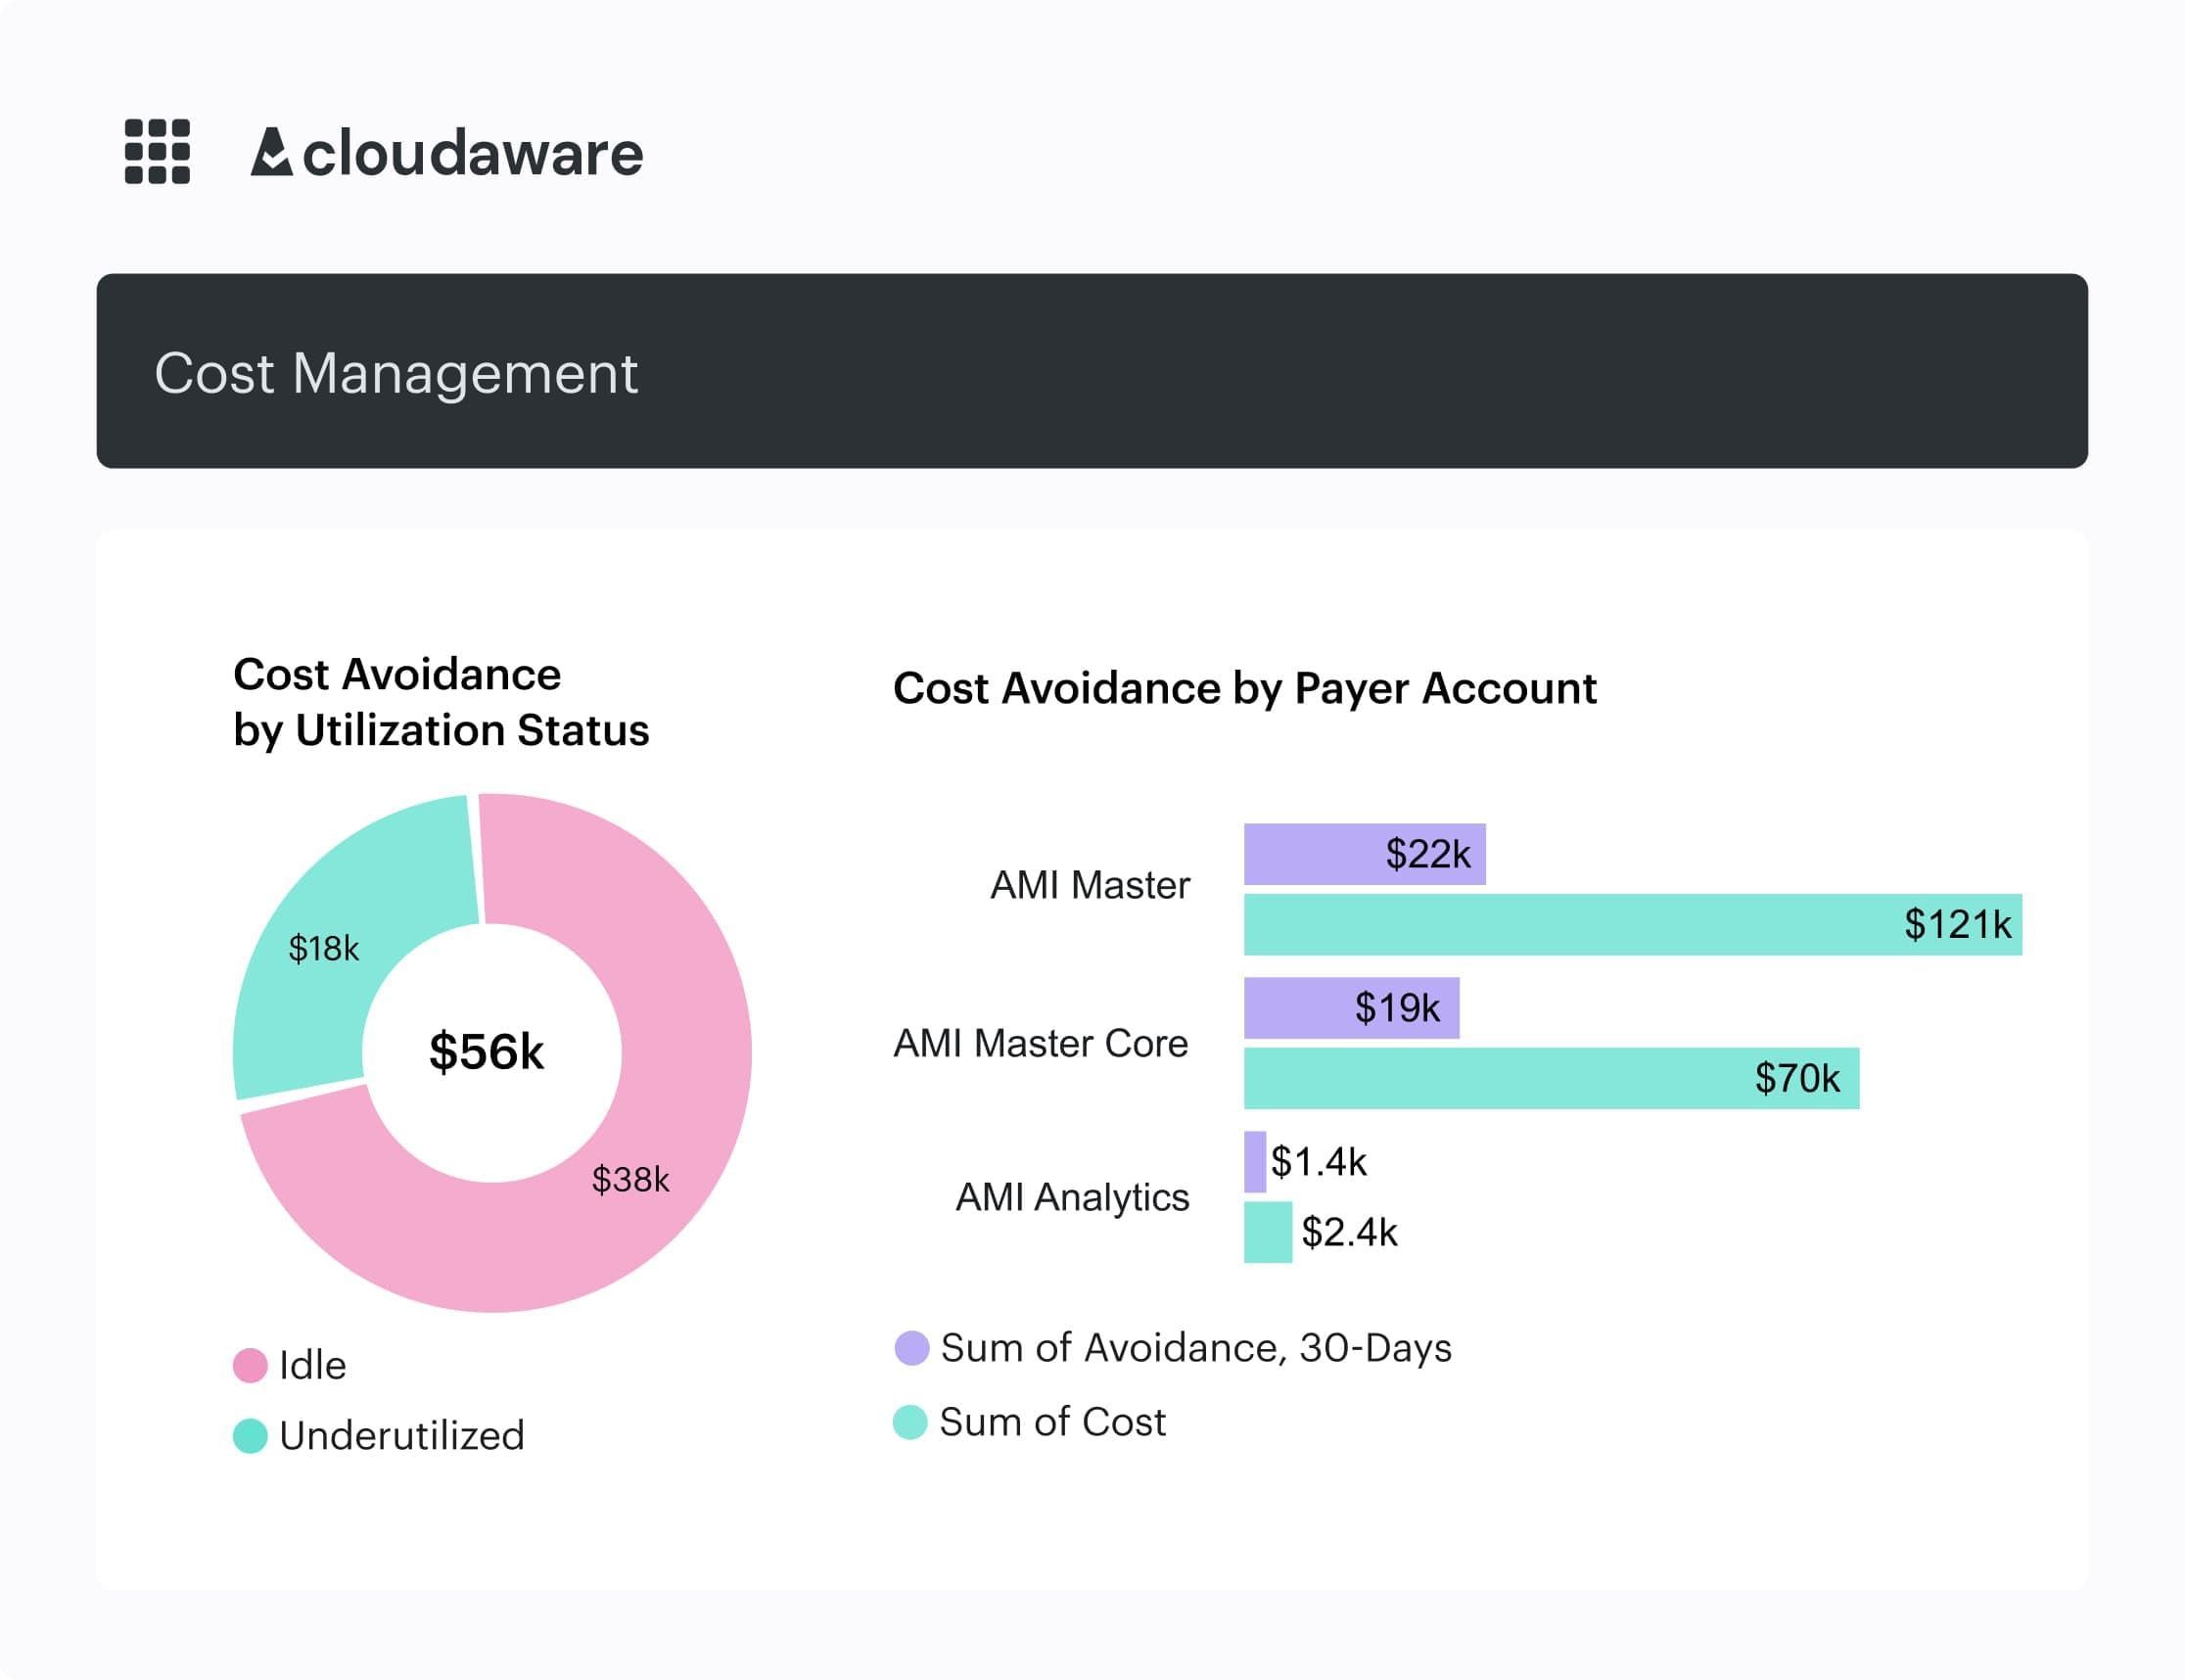
Element of the Cloudaware FinOps dashboard. See it in action on a live demo.
And yeah, it’s not just a read-only layer. You can build alerts, rules, and workflows inside the platform to keep your cloud cost processes aligned.
Cloudability – visibility through business lenses
Cloudability streams the same cloud invoices into its Business Mapping engine, re-labeling cryptic resource IDs into business objects that read like Auth-API-Prod-EU instead of i-0ff123. True Cost Explorer and real-time scorecards surface spend, discount coverage, and tag health, while ML detectors raise a hand when yesterday’s deployment doubles egress. Filters snap between amortized and blended rates, variance columns highlight over/under forecasts, and every view is share-ready with Finance in CSV or GraphQL.
Dashboards integrate seamlessly with Apptio’s broader TBM suite, so engineering and finance speak from the same dataset without endless spreadsheet merges. Cloudability’s visibility stack is all about quick ingestion, rich tagging overlays, and on-demand exports that slot directly into your existing BI or TBM workflows.
This is a dream when you’re trying to link costs back to engineering effort or product value.
| Feature | Cloudaware | Cloudability |
|---|---|---|
| Multi-cloud billing visibility | Native support for AWS CUR, Azure EA, and GCP billing | SaaS pipeline ingests spend from AWS, Azure, GCP |
| Daily spend breakdown | Daily updated views with project/team filters | Real-time cost feed updates views continuously; teams track daily spikes inside dashboards |
| Rate types supported | Blended, unblended, amortized, list — fully selectable | Exposes List, Total, Adjusted, Amortized and Adjusted-Amortized metrics for any slice |
| Custom dimensions for cost grouping | Tag-based filters, custom dashboards and custom by feature, team, etc. | Business Mapping rules engine builds bespoke dimensions (e.g., “Product Line”, “Customer Tier”) at ingest time |
| Tag hygiene handling | Flags missing/untagged resources clearly, fixes tags inconsistencies | Tag Explorer surfaces untagged resources; Business Mapping assigns “Unallocated” defaults until fixed |
| Anomaly detection | Real-time via spend reports or dashboard rules | ML-backed engine flags spend anomalies across all providers and emails or pages owners |
| Engineer-friendly views | More reporting-oriented and customizable | True Cost Explorer, Tag Explorer and Scorecards give engineers live, slice-and-dice charts in the web app |
| Workflow automation | Built-in via Force.com (alerts, thresholds, reports) | ServiceNow and webhook integrations turn rightsizing or anomaly alerts into actionable tasks |
- With Cloudaware, you feel in control. You’ve got consistent data, clean views, and the power to layer FinOps workflows on top of it.
- With Cloudability, you plug into a live cost radar. Real-time dashboards surface spikes, Business Mapping rewrites cryptic IDs into ledger-ready labels, and one-click exports feed your TBM models — so Finance, Ops, and Dev all fly from the same flight plan.
They’re solving the same visibility challenge, just from different angles.
Allocation & Tagging
Every penny of cloud spend should carry a return address — team, product line, cost-center, or feature. On the whiteboard that sounds easy; in the wild it’s trench warfare.
Tags sprawl like unchecked vines: one squad writes Owner, another prefers Team, and someone swore that Stage=Sandbox is totally production-ready. Plenty of resources skip tagging altogether — think that lonely EC2 instance humming for months in a forgotten test account.
While Finance waits for showback sliced by business unit, the platform crew has to carve shared-services costs into fair shares, and your dashboards sit 20 % pixelated because Environment never made it onto the resource.
Cloudaware and Cloudability exist to turn that tag chaos into signal — each marching to its own FinOps drumbeat.
Cloudaware
Cloudaware doesn’t just read your tags — it audits them, slices them, cross-checks them against your organizational metadata, and highlights what’s missing. It's like having a FinOps operations surgeon on your team.
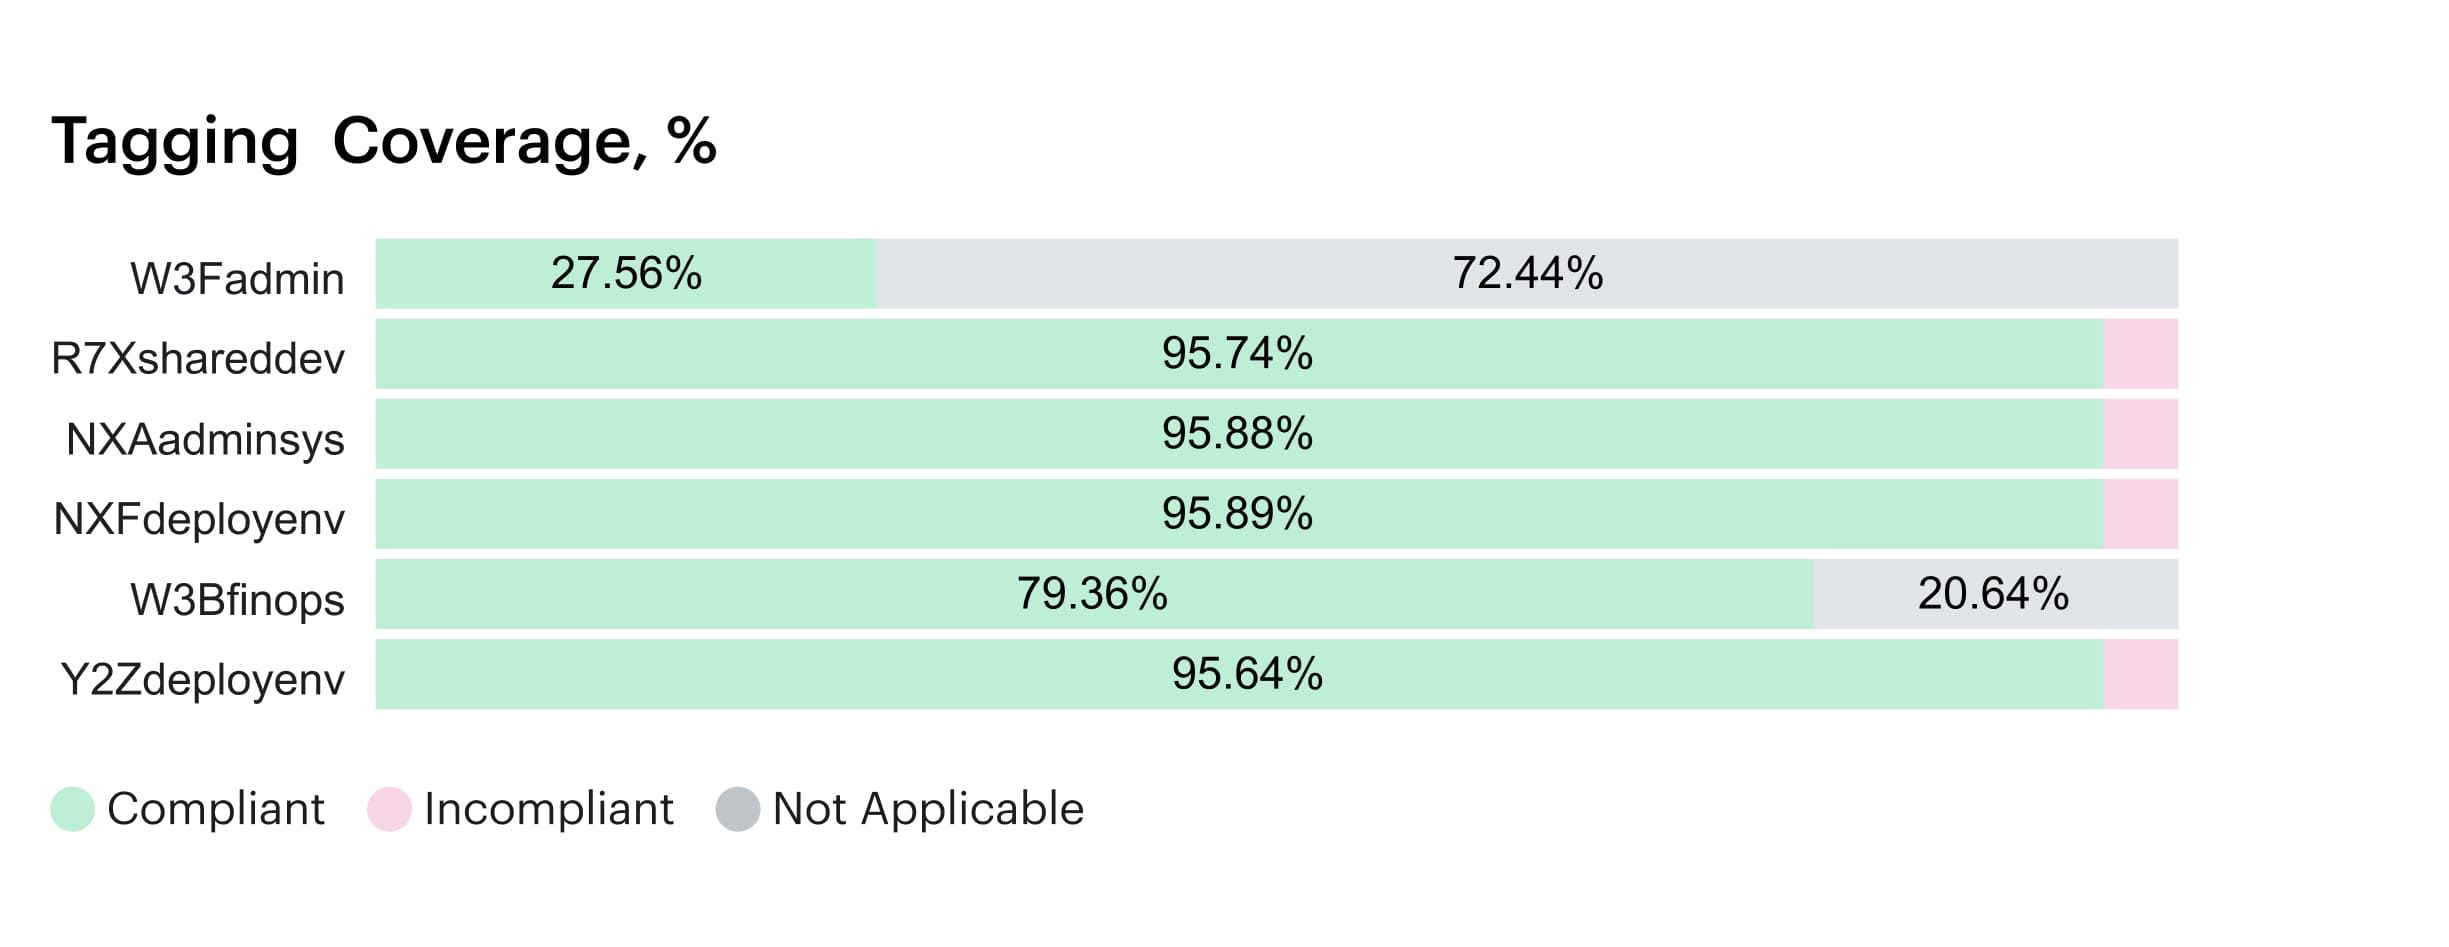
Element of the Cloudaware tagging dashboard. See it in action on a live demo.
Here’s what makes it powerful:
- Daily cost ingestion from AWS CUR, Azure EA, and GCP, with line-item precision.
- Tag completeness tracking: You’ll instantly see what’s missing, malformed, or outdated — across thousands of line items.
- Allocation rules engine: You can allocate spend by tag, account, service, project, or any custom field you define in Salesforce or the Cloudaware CMDB.
- Multi-dimensional allocation views: Filter costs by combinations like Environment:Prod + Team:Data + Application:Kafka-Ingest. It just works.
- Fallback rules for untagged items: Don’t lose sleep over unused resources — Cloudaware routes them to default owners, cost centers, or flags for review.
Element of the Cloudaware FinOps dashboard. See it in action on a live demo.
You get a system where every dollar has a tag, an owner, and a trail, even if you didn’t get your tagging perfect upfront.
Cloudability’s approach?
Here’s the low-down on how Cloudability keeps the tag circus (mostly) in line so Finance can slice spend the way they like it without you searching through CUR files every Friday night:
- Business Mapping engine – when raw CUR lines roll in, you drop JSON-style rules that say “If owner is blank but product contains auth-api, stamp Team=Identity and CostCenter=3342.” It rewrites the data on ingest, so dashboards and APIs show the cleaned-up labels right away. You’ll still craft those rules yourself, but once they’re set, they run on autopilot.
- Tag Explorer + Health scorecards – a live panel sorts every tag key into Healthy, Late, or Missing. It flags the rogues, shows the dollars stuck in “Unallocated,” and lets you export the list to CSV or straight into Jira for manual clean-up duty.
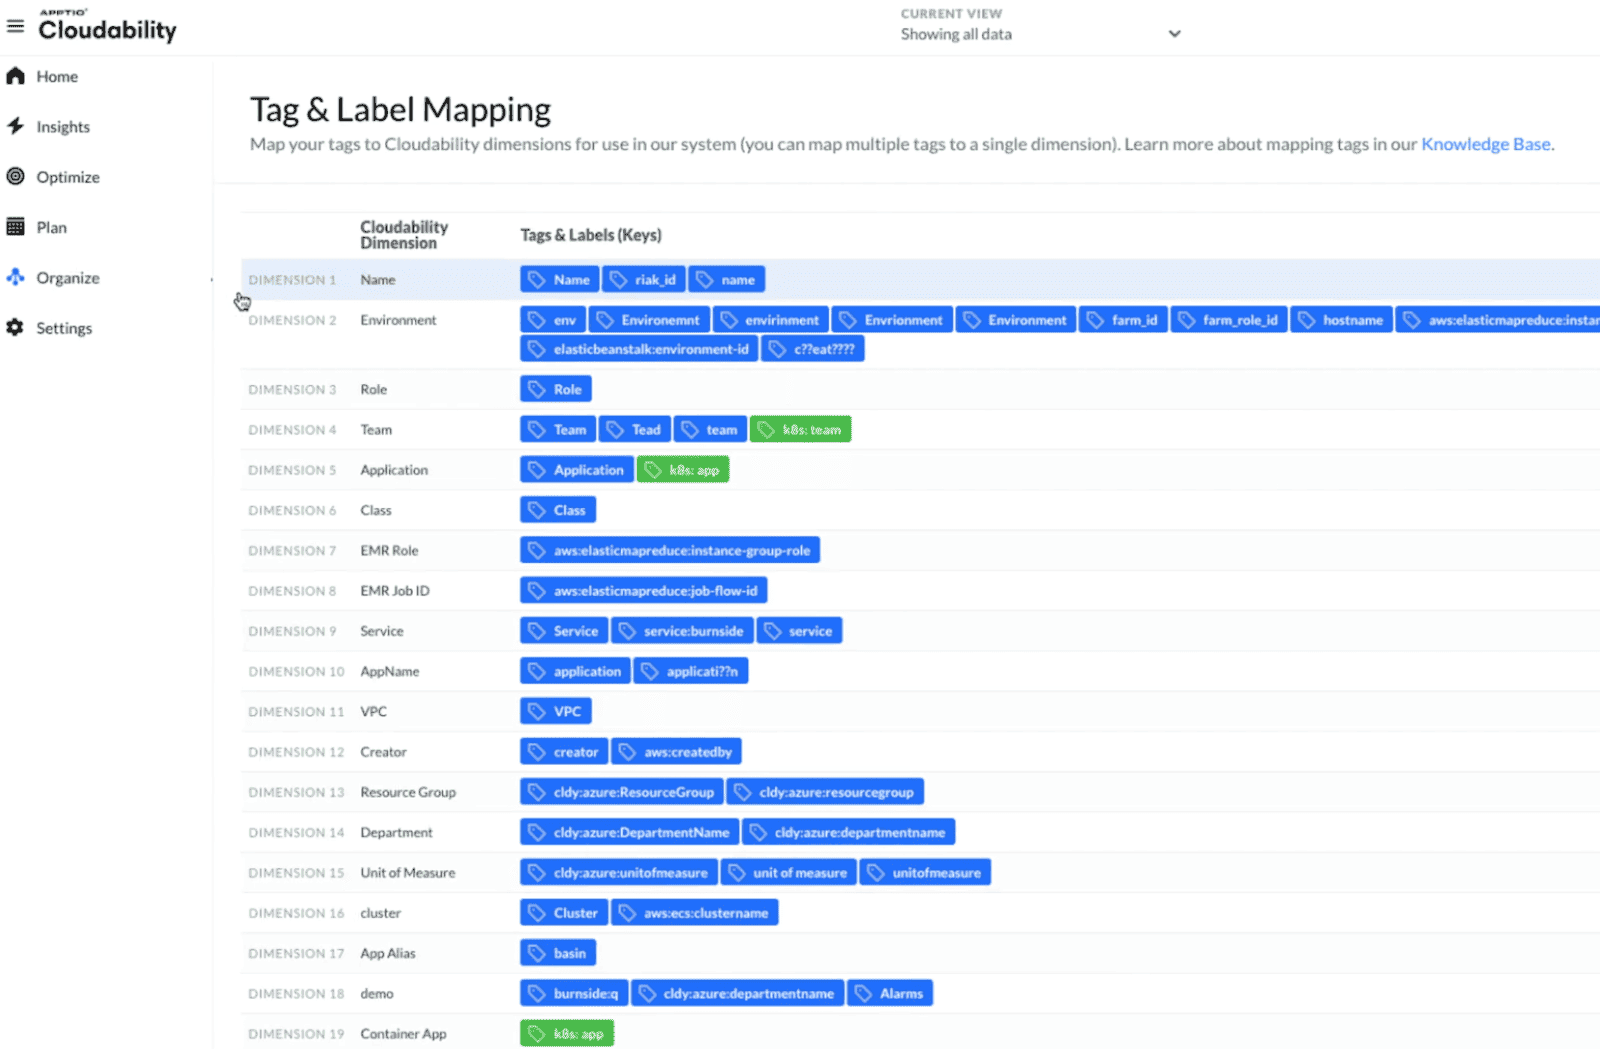
Tag mapping. Image source.
- Custom dimensions – beyond tags, you can create synthetic fields like BusinessUnit, CustomerTier, or ApplicationFamily with a few clicks. Those dimensions become group-by pivots in True Cost Explorer and feed out through the GraphQL API, so your BI stack sees the same mapping as the web UI.
- Slack / Teams nudges – if a resource lands in the Unallocated bucket or a team blows its tag SLA, Cloudability can DM the owner with a templated “hey, fix this” reminder. (You decide the threshold — e.g., 90 % tag coverage by Thursday.)
- APIs for bulk patching – once you hunt down missing tags, pipe a script through Cloudability’s PATCH endpoint to retroactively backfill the CUR history. No need to wait for next month’s bill.
- Cost allocation reports – every widget can show Unallocated vs. Allocated dollars, sprinkle in amortized or blended views, then export the lot as XLSX for the CFO’s deck.
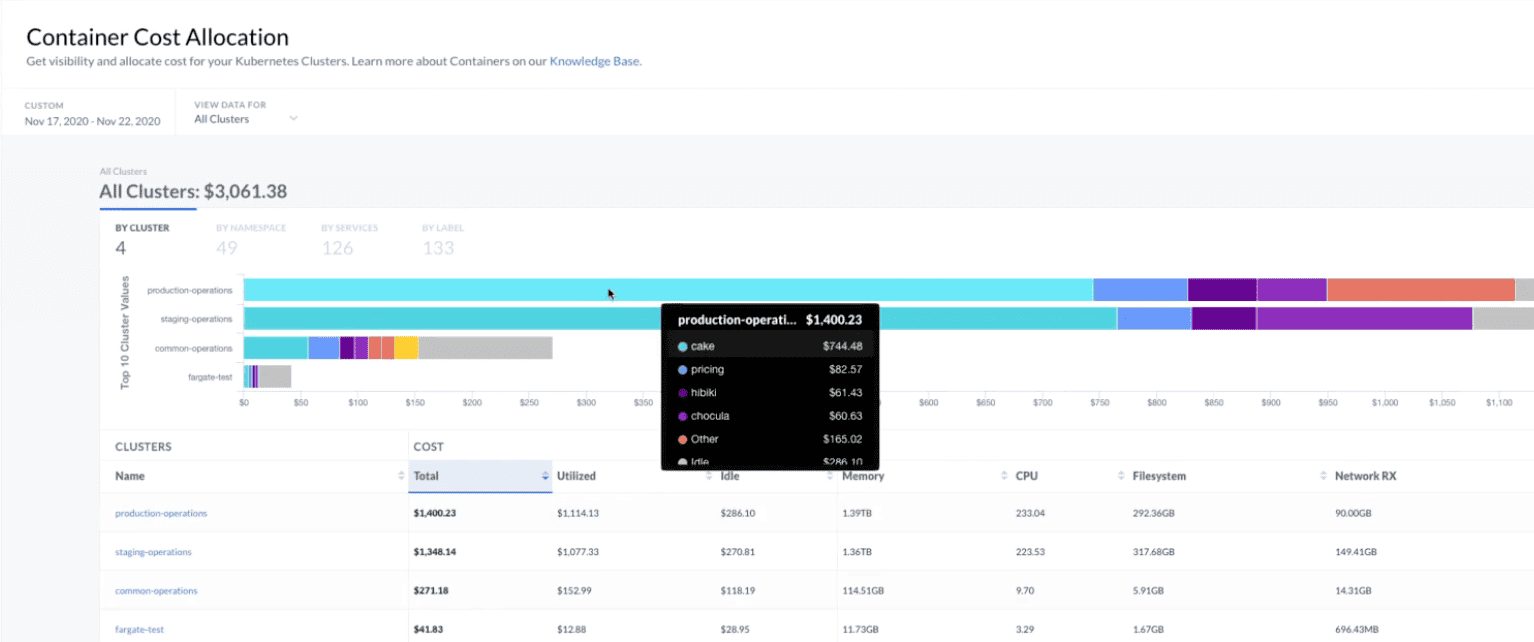
Container cost allocation report. Image source.
It’s a solid toolkit: you get real-time visibility, nudge mechanics for sloppy tags, and enough rule power to keep the allocation grids green — just expect to spend a little elbow grease upfront writing those Business Mapping rules and coaching teams through the Tag Explorer “red zone.”
| Cloudaware | Cloudability | |
|---|---|---|
| Tag-hygiene audit | Compliance Engine scans every new CUR line and shows live “Green / Amber / Red” coverage meters in dashboards | Tag Explorer panel grades keys as Healthy, Late or Missing and totals the “Unallocated” dollars |
| Tag fixes | “Tag Doctor” auto-patches bad keys via rule sets or CMDB look-ups, then highlights anything it couldn’t heal | Business Mapping rewrites tags at ingest; fixes require JSON rules or manual bulk-edit in Tag Explorer |
| Auto-fill missing tags | Yes – deterministic rules or directory look-ups fill Owner, Cost Center, Product etc. before data hits reports | Partial – can assign synthetic values (e.g. “Unallocated-”) but true auto-fill needs custom scripts |
| Push fixed tags back to cloud | Optional write-back: Force.com flows, Google or AWS/Azure APIs update the source resource so tags stay consistent | Read-only: cleaned tags live in Cloudability’s data model; you re-tag resources manually or via IaC |
| Allocation by custom logic | Any CMDB field or tag can become a cost dimension; formulas handle shared-service splits, caps & floors | Business Mapping lets you build rule trees that bucket spend by BusinessUnit, Env, CustomerTier, etc. |
| Dynamic fallback rules | Multi-layer rules cascade: if Owner is blank ➜ look at Jira assignee ➜ else tag “Unknown” and alert | Single fallback per rule — typically drops spend into Unallocated until fixed |
| Business-context mapping | Native CMDB graph ties cost to Apps, Services, Releases, Tickets or any custom dimension visible in every report | Custom dimensions create business lenses, but relationships live outside (Apptio One or ServiceNow) |
| Multi-cloud cost alignment | Normalises AWS, Azure, GCP, Alibaba, Oracle currency & rate types overnight; one toggle flips between blended, unblended, amortized | Aligns multi-cloud spend via common rate metrics and feeds the same view into True Cost Explorer |
Read also: 7 Best Cost Allocation Software 2025 - Tools, Features & Pricing
Cost Optimization: rightsizing, idle detection, and alerts
The mission: put a leash on cloud spend before it turns into a runaway balloon. That means spotting beefy instances you’re funding but barely using, yanking idle services before they sip another cent, and firing off alerts the minute things wobble — long before Finance waves the red flag.
- Rightsizing trims the fat: scaling EC2 nodes, pods, or RDS clusters that have been cruising at 10 % CPU for ages.
- Idle-hunting shines a light on ghost volumes, forgotten snapshots, and databases collecting dust.
- Smart alerts serve as your early siren — triggering when costs spike, thresholds crack, or configs drift out of policy.
FinOps leads, DevOps folks, architects — all need gear that not only points at the leak but hands you the wrench, fast and across every cloud you touch.
So, how do Cloudaware and Cloudability pull that off? Let’s dig in.
Cloudaware
Cloudaware is like having a no-BS FinOps analyst in your corner, armed with x-ray vision and a rulebook.
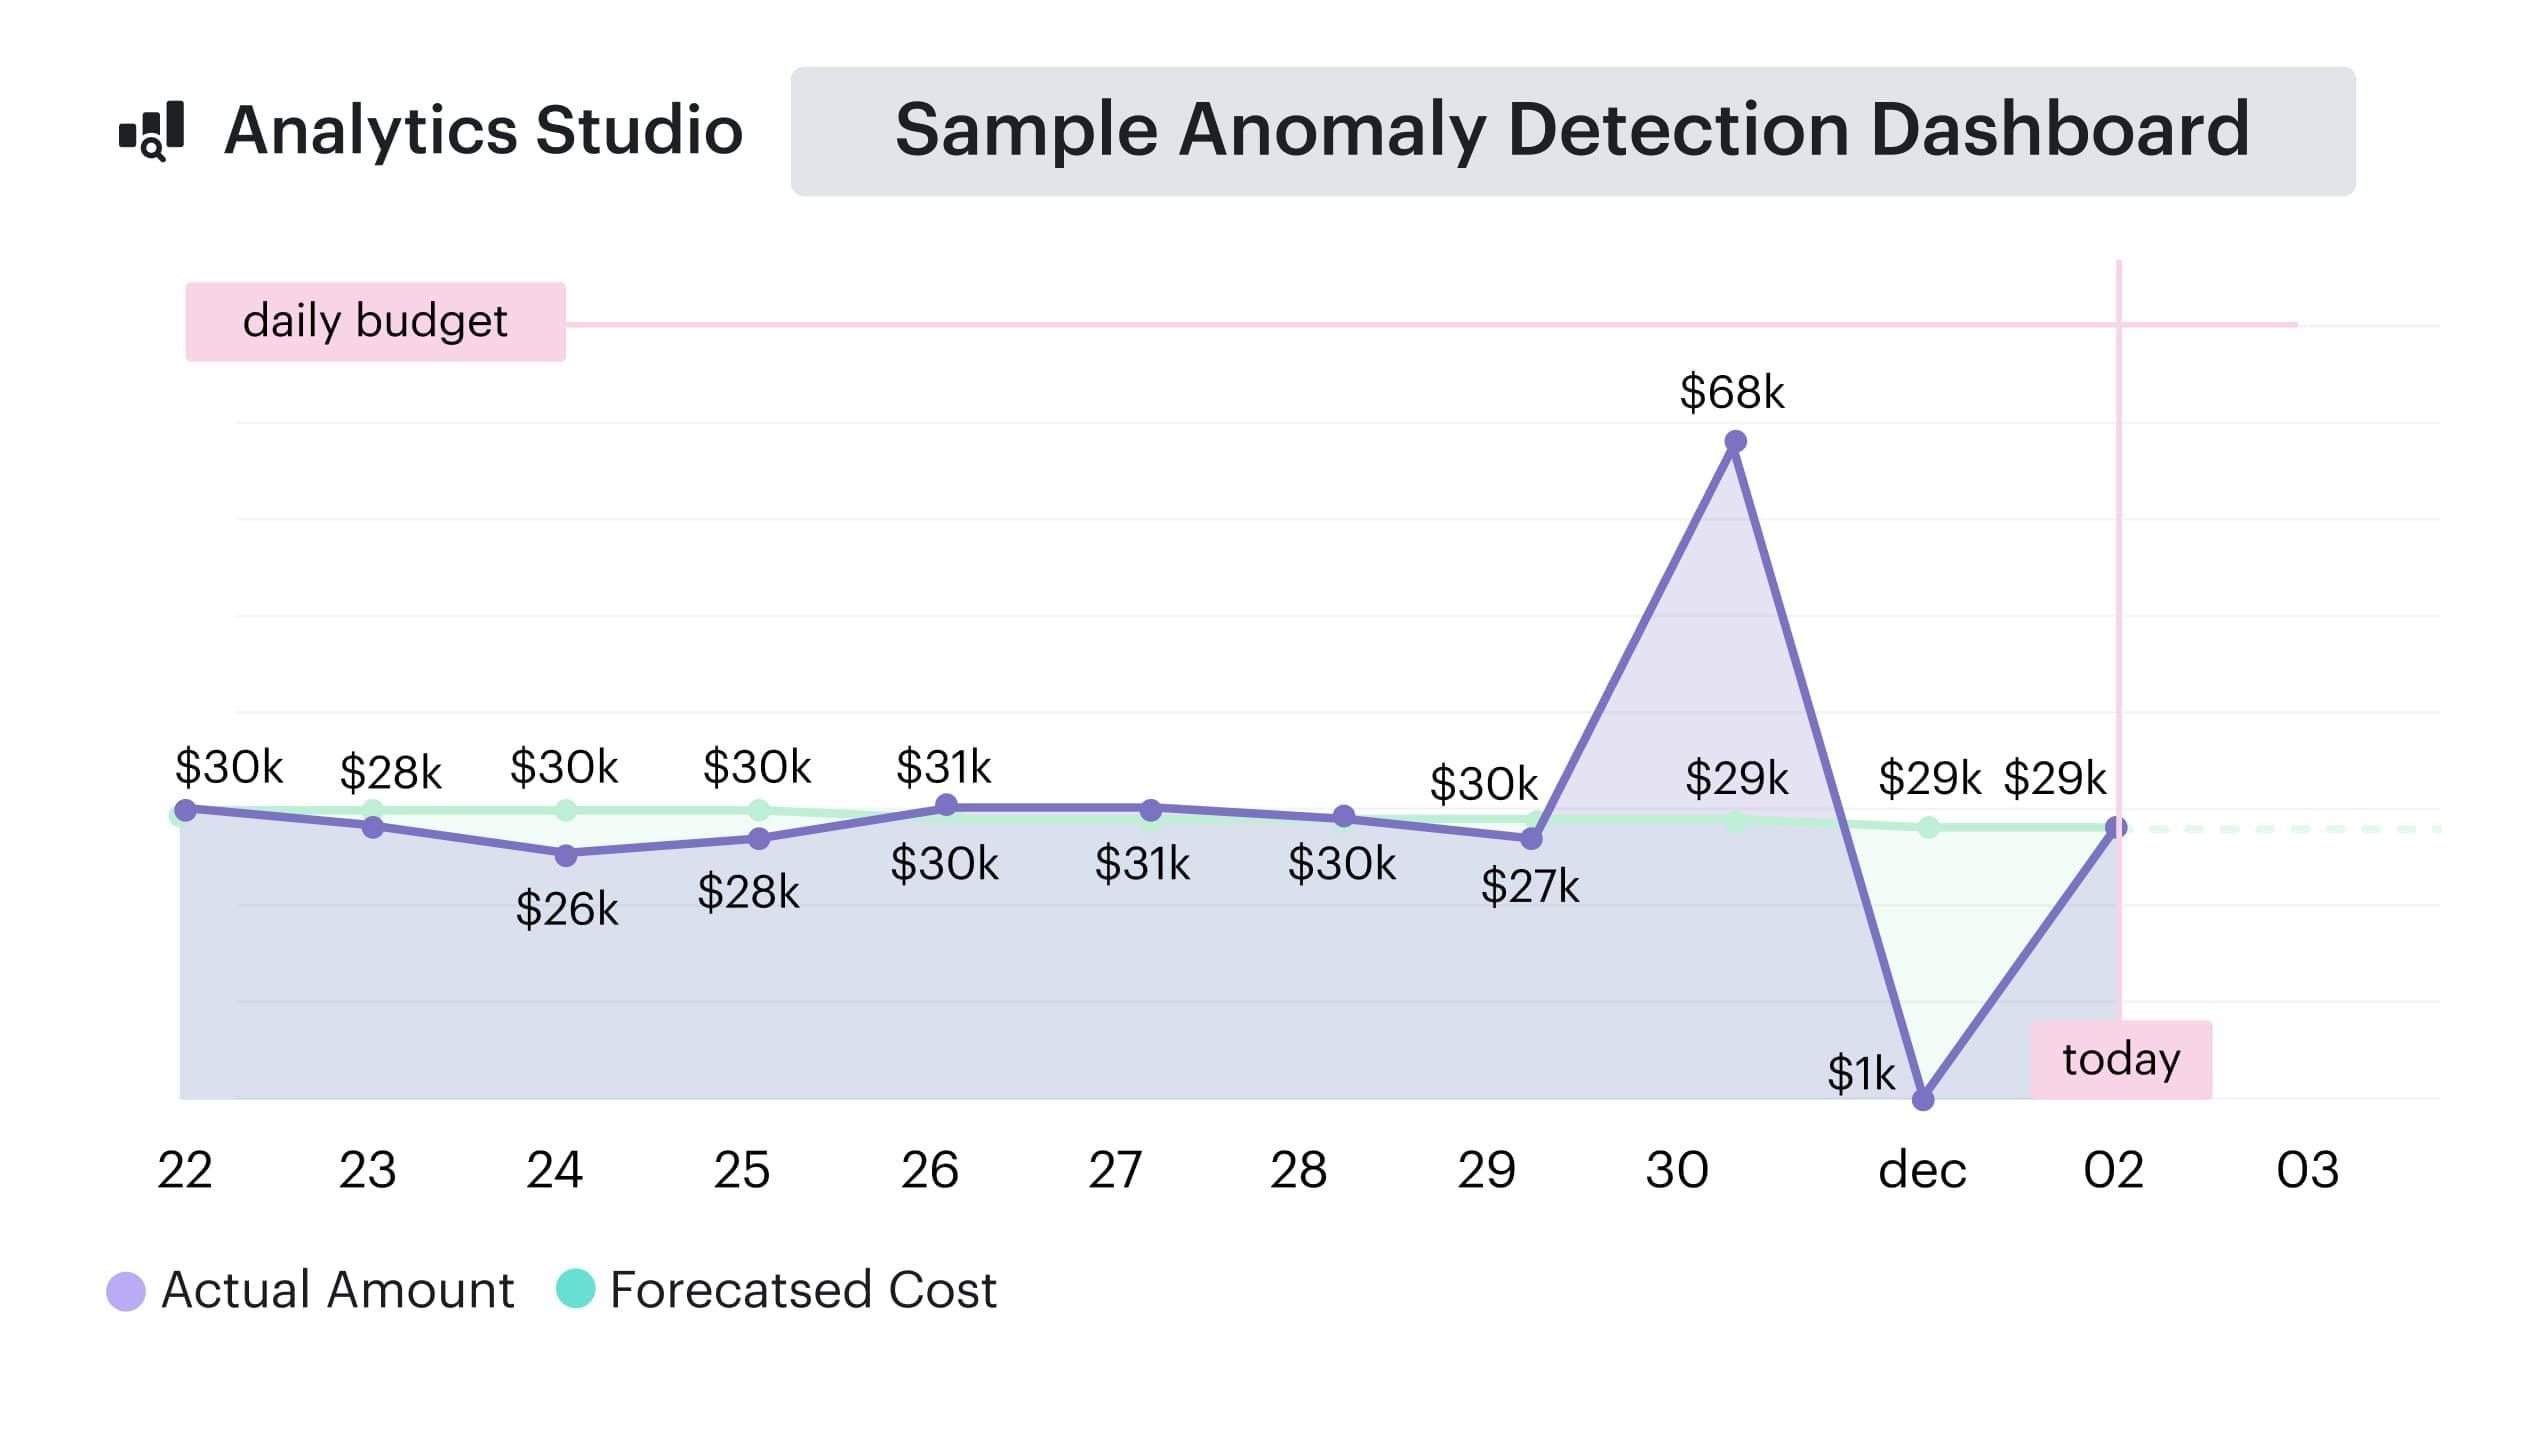
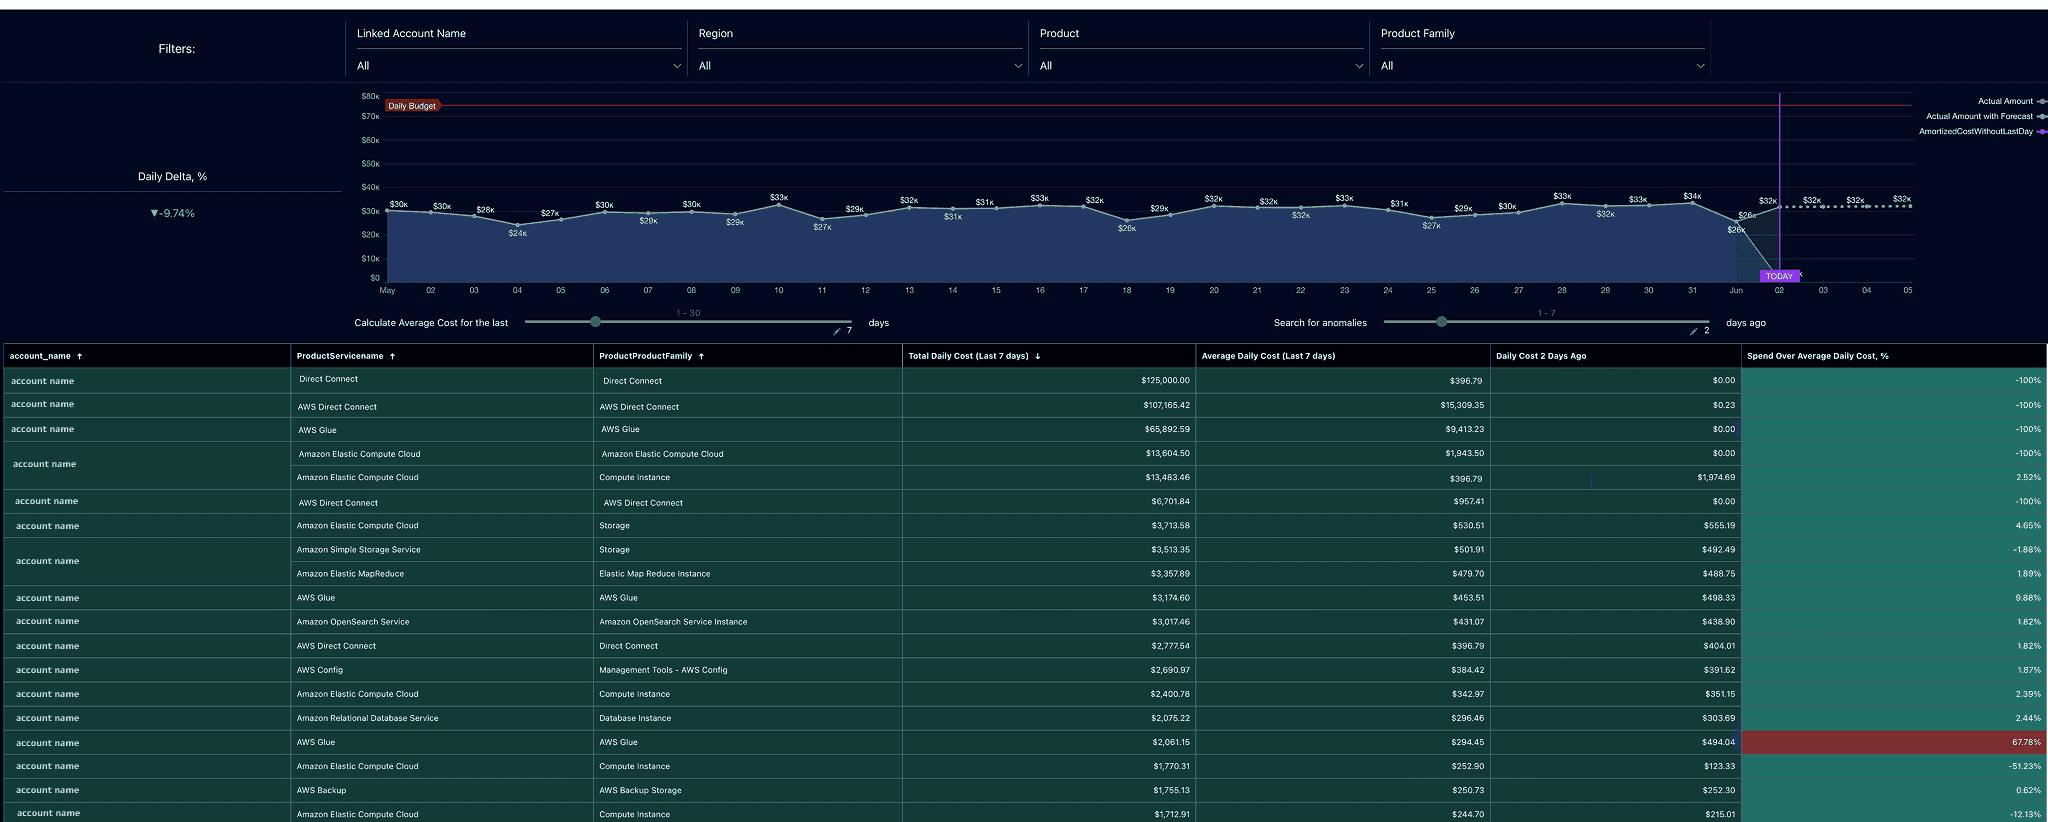
Part of the cloud forecast and anomaly detection dashboard. See it in action on a live demo.
What it actually does:
- ✅ Idle Detection. Define policies like “unattached EBS > 7 days” or “low-util EC2s under 5% CPU” → flagged, logged, and routed for cleanup.
→ Seen teams save $10K+ monthly just by setting EBS rules. - ✅ Rightsizing Insights. Daily views show over-provisioned compute across AWS, Azure, GCP. It won’t just nudge you — it tells you what’s wrong and how to fix it.
- ✅ Custom Alerting Workflows. Built into Force.com. Set alerts for when cost thresholds are hit, tag violations occur, or idle policies trip.
→ Perfect for teams with cost guardrails tied to compliance. - ✅ Integration with cost allocation + CMDB. Optimization tasks are always linked to business units or service owners — so no orphan alerts.
Best for you if: You’ve got well-defined cost policies, compliance needs, and want to automate FinOps workflows from the center.
Cloudability
Imagine it’s 8 p.m., your spend graph just shot up like a caffeine-charged heartbeat, and Slack is blowing up. Before the panic sets in, Cloudability is already warming up the tools. Here’s how it helps you yank costs back into line — rightsizing, idle-hunting, and smart alerts all stitched together:
-
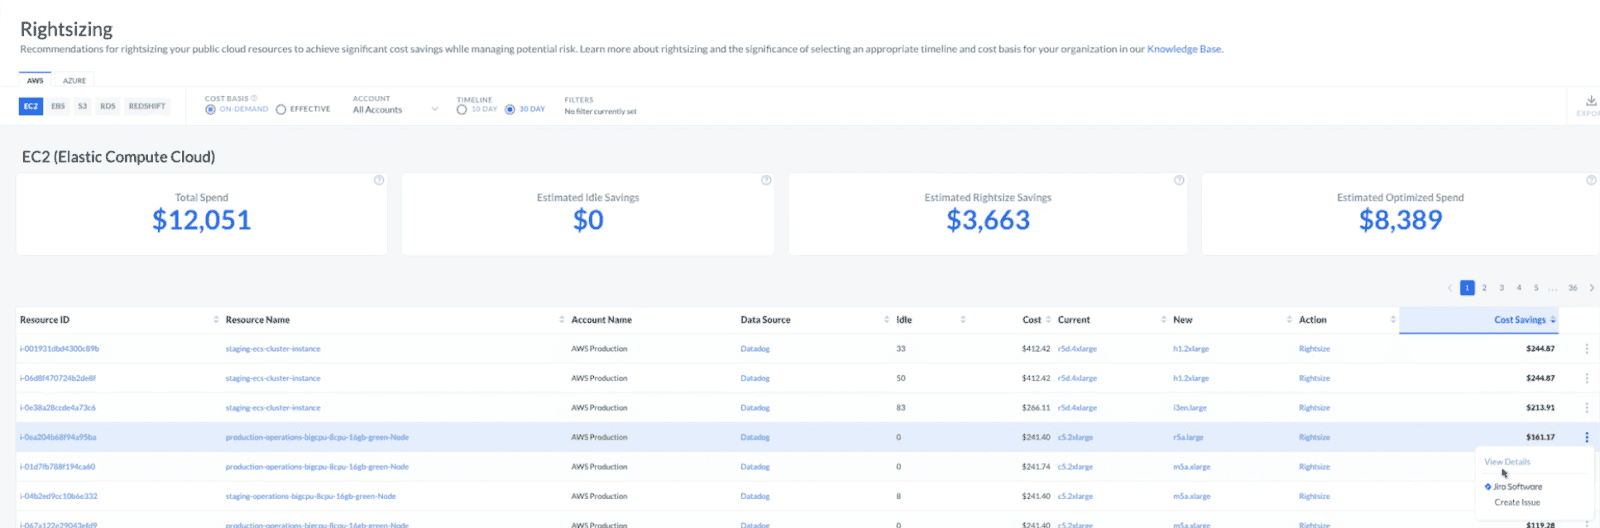
Interactive rightsizing cockpit – point it at EC2, RDS, or Kubernetes nodes and Cloudability crunches 14–90 day utilization curves, then lines up scale-up, scale-down, or terminate choices with risk scores and dollar-savings estimates. One click opens a Jira or ServiceNow ticket so nobody “forgets” to act.
-
Idle-hunter overlays – disks, IPs, snapshots, even forgotten DynamoDB tables that haven’t twitched in weeks are bundled into a “Quick Wins” list you can hand straight to the owning squad.
-
Container smarts – pod-level profiling spots over-provisioned replicas and suggests tighter node-pool shapes (plus kill switches for zombie namespaces).
-
Real-time anomaly radar – an ML engine watches every fresh CUR line; breach a $ or % threshold and it pings the resource owner in Slack/Teams before the finance inbox sees red.
-
Budget & coverage guardrails – ties spend alerts to RI/Savings Plan coverage, warning you if a commitment dip is about to blow up next week’s forecast.
-
Bulk-action APIs – once everyone’s on board, fire a GraphQL call to tag, resize, or shut down the whole “terminate” stack in one swoop.
No Salesforce backbone here, but if you need a fast, dashboard-driven way to whack idle spend and shout at the right people before the CFO does, Cloudability packs plenty of muscle.
Best for you if: You want live, dev-friendly cost insights that fit into engineering cycles and don’t rely on perfect tagging.
| Task | Cloudaware | Cloudability |
|---|---|---|
| Idle Detection | Policy-based (e.g., EBS > 7 d, EC2 < 5 % CPU) | ML-driven idle finder (snapshots, volumes, DBs) |
| Rightsizing | Dashboard + rules identification | Interactive cockpit with scale / terminate picks |
| Alerts & Notifications | Rule-based via Force.com to Slack, email, any tool you use | Real-time spend & anomaly alerts (Slack/Teams) |
| Actionability | Tied to allocation rules + CMDB | One-click tickets & GraphQL bulk actions |
| Workflow Integration | Salesforce-native automation | Jira, ServiceNow, Slack, webhooks |
Forecasting & Budget Management
You know the drill: the quarter kicks off, budgets look tight and tidy, and — boom — a staging cluster keeps humming all weekend. Now you’re in front of Finance spinning a tale worthy of a lightning strike.
The real game is crystal-balling spend off live usage trends, watching those budget dials in real time, and pinging the right folks before things veer off course. No post-mortems, no “my bad,” just early warnings and clean books.
So, how do Cloudaware and Cloudability pull that off? Let’s see what magic each one brings to the forecasting and budget-guarding party.
Cloudaware
Cloudaware is for the ops-driven brain — you know, the kind that likes organized dashboards, defined budgets, and rules that actually work. It pulls in your cloud billing data (AWS, Azure, GCP) and overlays it with your tags, CMDB, and project ownerships.
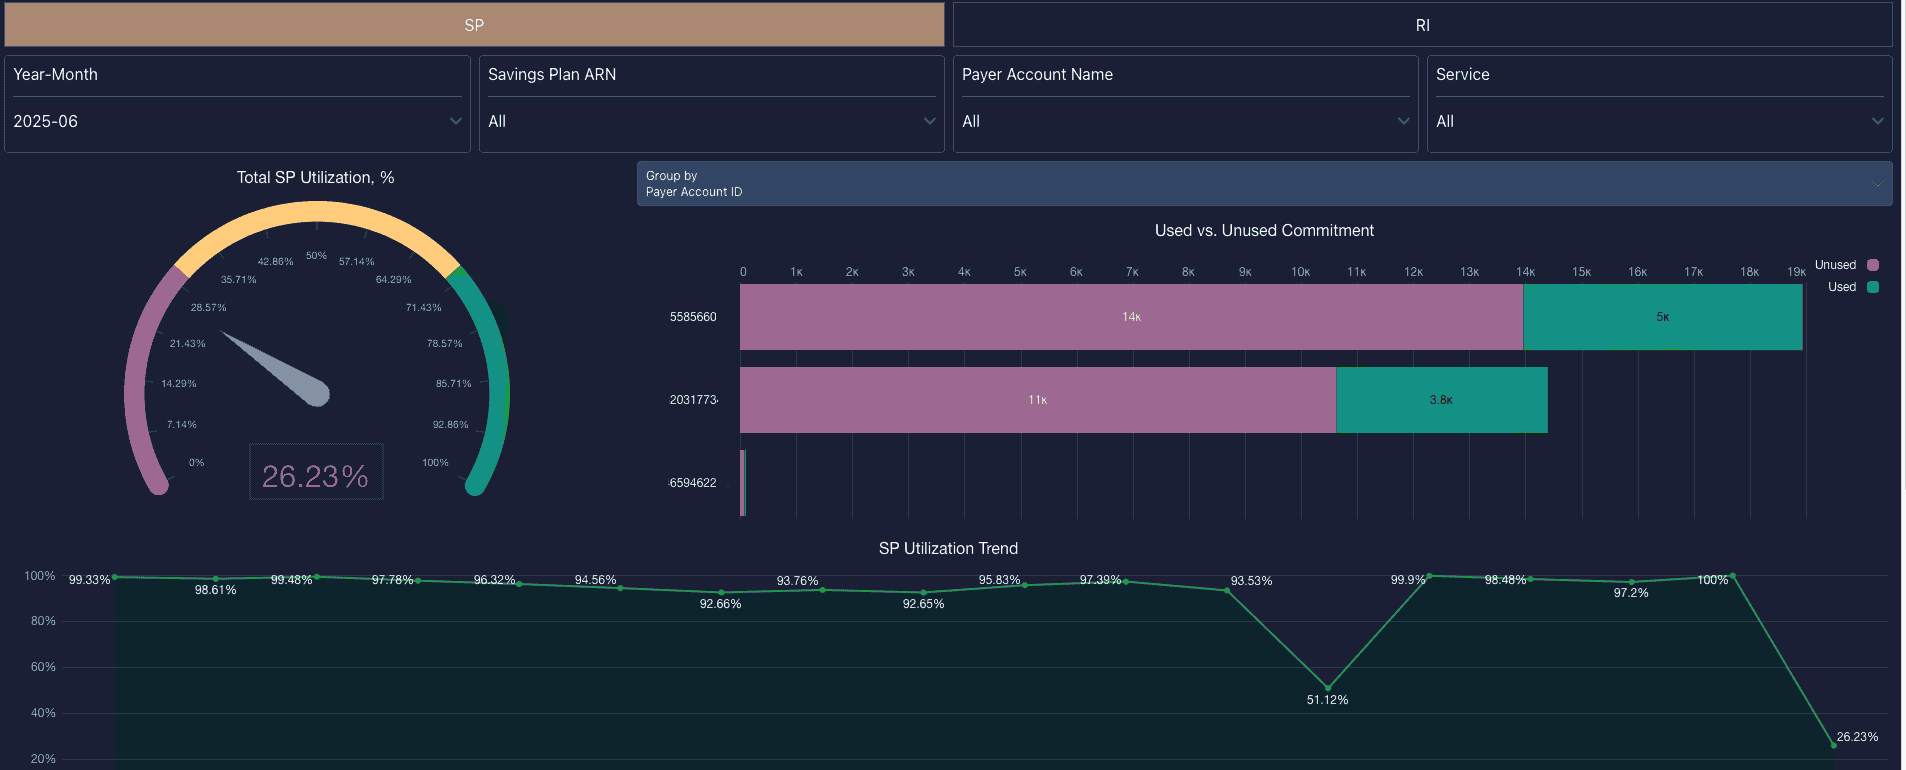
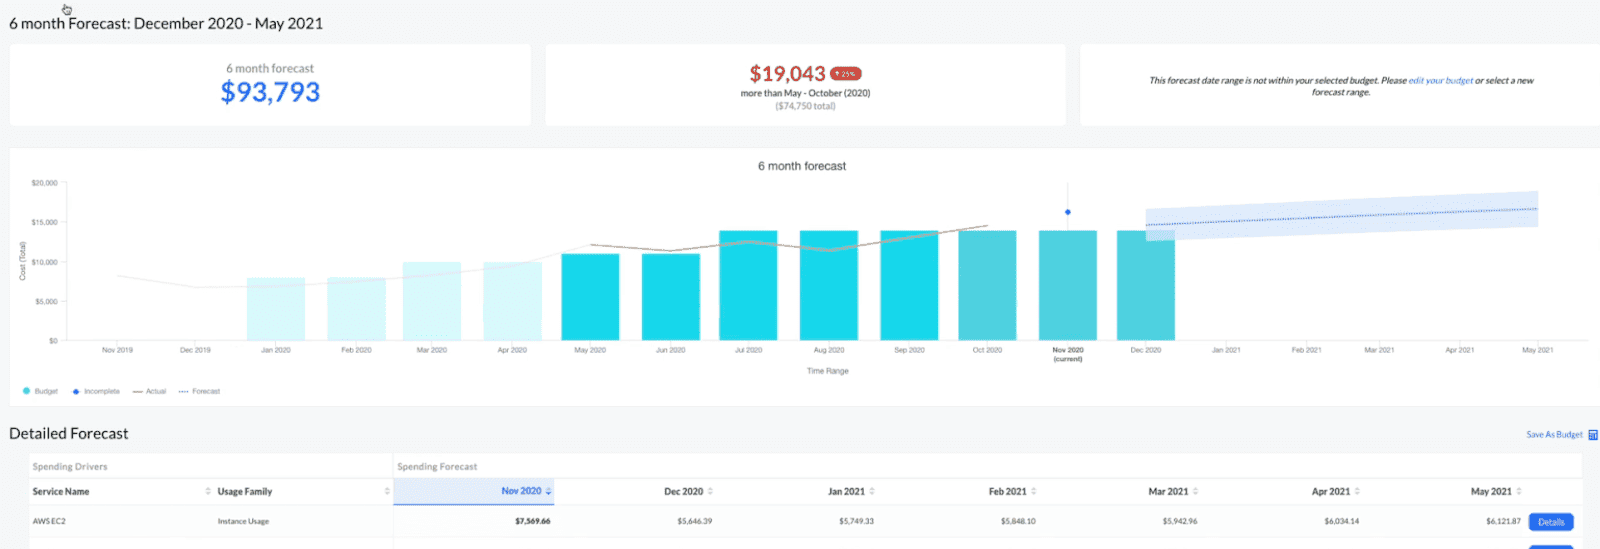
An element of the forecasting dashboard at Cloudaware. See it in action on a live demo.
Here’s what it brings to the budgeting table:
- 🔮 Live Forecasting – Daily auto-updated projections by tag, account, service, or team. No spreadsheets, no guessing.
- 🚨 Threshold Alerts – Set a cap? Cloudaware pings you when you’re trending toward it. Your budget’s safety net.
- 📊 Dashboards Built for Reporting – Slice by cloud, business unit, or environment. Perfect for finance, perfect for exec decks.
- 🔄 Workflow Automation – Breach a budget? It can auto-generate a ticket, notify the app owner, and escalate if needed.
Cloudability
Picture Cloudability’s planning stack as Waze for your cloud wallet — it watches the traffic, predicts the jams, and pings you before the CFO grabs the wheel.
How the crystal-ball works
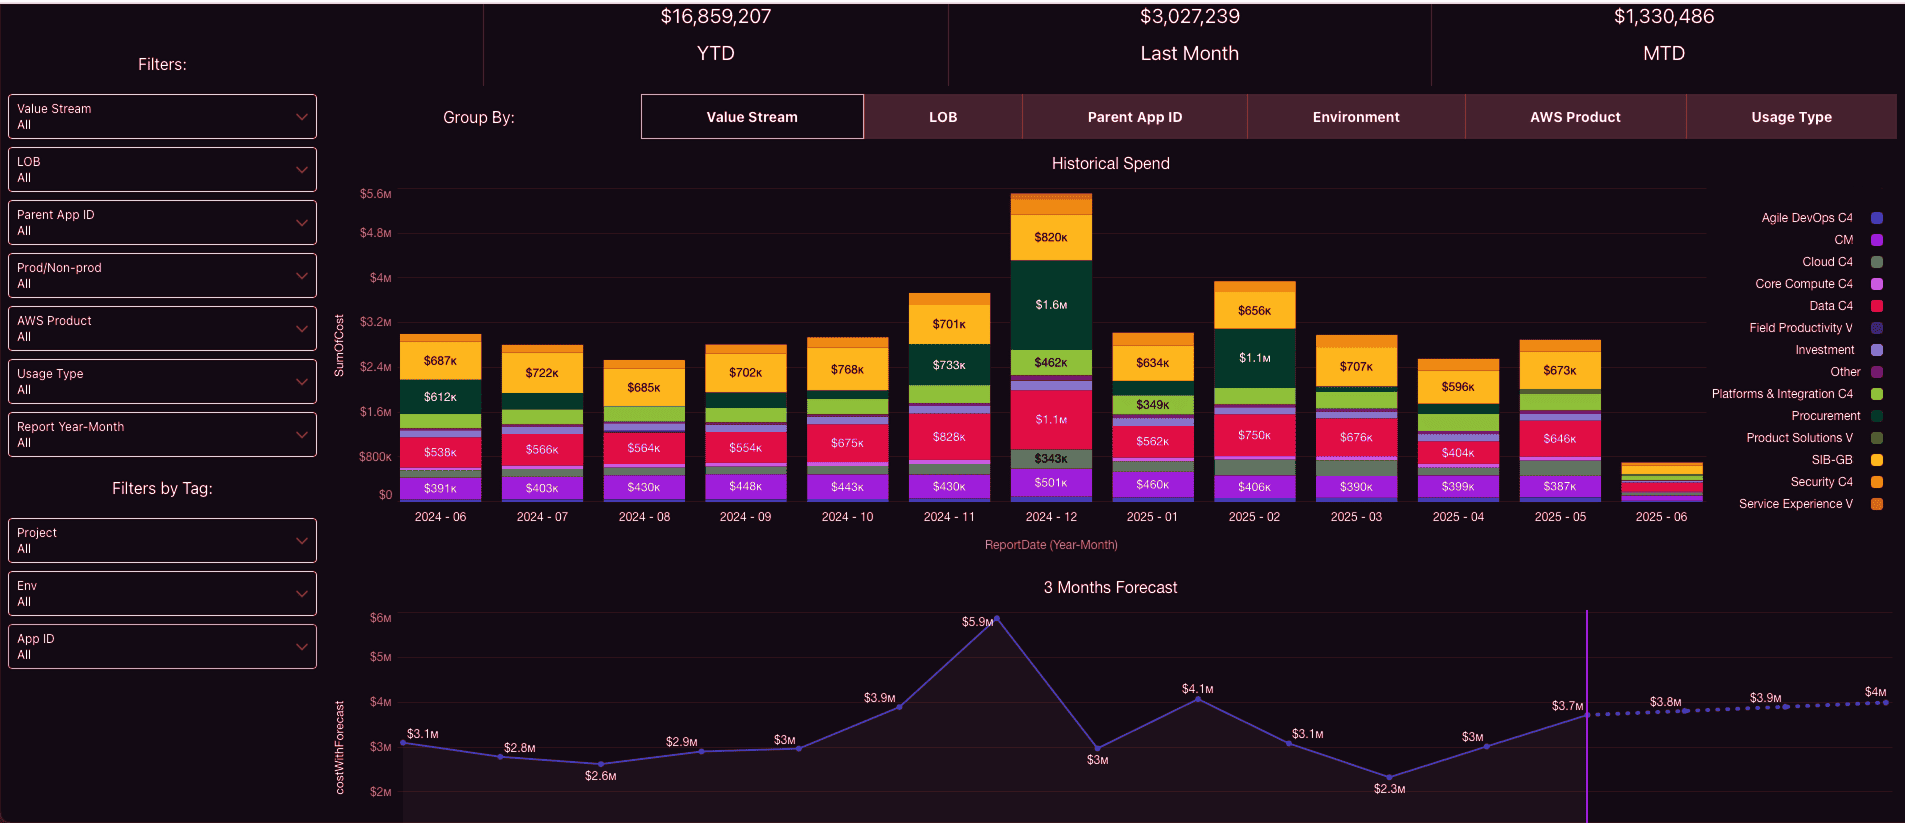
- ML-powered forecasts – Cloudability chews through 6–18 months of CUR history, spots seasonality and weekend dips, and projects runway by account, View, or tag cluster. One click promotes a forecast to a living budget.
- View-scoped budgets – Budgets live inside Views, so Marketing, Data, and SRE each get their own speedometer. Tie them to any cost basis you like — Cash, Amortized, Adjusted, or Adjusted-Amortized — to match how Finance books cloud spend.
- Variance & drift dashboards – Progress bars turn amber when you’re trending hot; variance columns show $ and % over/under so you can nip overruns before month-end.
- Early-warning alerts – Subscribe to “expected to exceed” or “exceeded” events and let Cloudability ping Slack, Teams, or email the moment a budget veers off course.
- What-if sandboxes – Spin sliders for traffic growth, reservation coverage, or region moves and see forecast lines dance in real time (great for board decks and architect debates).
- APIs & BI feeds – Push raw forecasts and budget status straight into Apptio BI, Snowflake, or your own datamarts for deeper modelling — or scrape them with the Views API if you’d rather script it.
Bottom line: Cloudability won’t write policy code for you, but it hands you rolling forecasts, per-team budgets, and instant variance pings — so you can steer spend, not just report on it.
What It Feels Like
| Feature | Cloudaware | Cloudability |
|---|---|---|
| Budget logic | Tags + CMDB fields | Views + Business Mapping rules |
| Forecasting | Daily trends from billing data | ML-driven seasonality projections |
| Alerts | Triggered via internal workflows | Real-time budget-drift pings |
| Who it helps | Finance, governance, IT leads | FinOps, Finance, Dev/Ops squads |
| Setup vibe | Structured, rule-based | Dashboard-first, quick-start |
Collaboration across teams
Budgets are wobbling, cost anomalies are firing like kettle-corn, and that random GCP line item from last Tuesday? Still nobody’s baby. Sound familiar?
This slice of FinOps is all about syncing the band — DevOps, Product, and Finance reading the same dashboard and actually moving in step.
What we’re aiming for:
- Put the right numbers in front of the right eyes.
- Tackle spend spikes before they hit the CFO’s inbox.
- Make every engineer, PM, and ops lead crystal-clear on what they own — and what it burns.
Let’s see how Cloudaware and Cloudability wire that heartbeat across the crew.
Cloudaware – cost collaboration that’s buttoned up and built in
Imagine piping every AWS CUR, Azure EA, and GCP export into a single Salesforce-powered CMDB graph, then handing each squad a view that’s already filtered to their apps, budgets, and guardrails. That’s Cloudaware’s collaboration super-power.
- One language for everyone – The native Force.com report & dashboard builder lets you spin up cost views by product line, squad, or cost center in minutes; no BI gymnastics required.
- Share without spreadsheets – Schedule CFO-ready PDFs, drop Excel cubes into the FP&A folder, or nudge engineers with real-time Chatter mobile notifications when spend drifts off track.
- Role-based access out of the box – Fine-grained sharing settings mean Finance sees enterprise roll-ups while DevOps drills into their own namespaces — no risky over-exposure of billing data.
- Budget alerts & daily digests – Built-in notifications surface variance the same day it happens, so Product and Finance can course-correct before month-end surprises land.
- Open API = endless hooks – Export cleansed cost data to Snowflake or feed it into Jira workflows; the same endpoints let you post back status once an optimisation is done.
End result? Engineers, product managers, and accountants all pull from the same live dataset, get pinged in the tools they already use, and close the feedback loop while the cloud meter’s still running — exactly the rhythm a mature FinOps practice needs.
Cloudability – team collaboration that moves at dev speed
Need your devs, product owners, and finance folks staring at the same numbers? Cloudability gives you a handy collaboration kit — maybe not quite the CMDB-deep magic of Cloudaware, but plenty to keep the cross-functional Slack threads humming.
- Business-first labels, everywhere. Business Mapping rewrites raw CUR line items into human-sized objects (think Auth-API-Prod-EU instead of i-0ff123). Rules can even pull from ServiceNow so every view, alert, and export speaks the business language your execs already use.
- Shared dashboards & quick tickets. Views, Scorecards, and True Cost Explorer slices are share-link friendly; with two clicks you turn a rightsizing suggestion into a Jira issue that lands in the right backlog complete with resource ID, savings, and tags.
- Real-time heads-ups. Anomaly Detection watches spend in near-real time and pings Slack, Teams, email, or PagerDuty when a cost line slips its lane — no more retroactive “why’s the bill up?” threads. Thresholds can be dollar- or percentage-based and filtered by view so only the on-call squad gets the noise.
- Cost Sharing & “Unallocated” glare. Shared services? Cloudability’s Cost Sharing module spreads them across business units by fixed %, actual usage, or telemetry, so Finance sees fair charges and platform teams stop haggling. Anything still missing tags lands in the Unallocated bucket — complete with dollars attached — to spur fast clean-up.
- APIs for the glue work. A GraphQL/REST layer lets you pipe cleansed cost data straight into Snowflake, Datadog, or your own BI dashboards; same endpoints can bulk-close idle resources once engineers give the green light.
Put together, Cloudability keeps all three tribes — infrastructure, product, and finance — reading the same page and acting in hours instead of “next billing cycle.” If you’re after quick shareable views and ticket-ready actions, it ticks the collaboration box without asking you to live in Salesforce.
The Friend-to-Friend Decision Table
| Feature / Need | Cloudaware | Cloudability |
|---|---|---|
| Cost alerts into workflows | ✅ Native to Jira, PagerDuty, ServiceNow, Slack, email | ✅ Slack / Teams pings, Jira & ServiceNow via webhooks |
| Role-specific dashboards | ✅ CMDB + permission-based | ✅ Shareable views & scorecards; scopes via Business Mapping |
| Structured escalation | ✅ Force.com automations | ✅ Webhook-driven rules; manual escalation chains |
| Embedded FinOps help | ✅ Dedicated FinOps Account Manager | ✅ Apptio FinOps practice, community playbooks |
| Setup effort | Medium–High (tag + CMDB power) | Low–Medium (API keys + mapping rules) |
| Best for orgs that… | Run on governance, workflows, and clear cost centers | Want quick dashboards, automated savings, lighter governance |
FinOps reporting & analytics
Spreadsheets are great for grocery lists, not for wrangling six-figure cloud bills. What we’re after is live, no-guesswork intelligence that bridges raw cost lines to crisp business moves — every single day, for every squad, minus the tab-mania.
Here’s the job in plain speak:
- Flip billing exports into real-time, slice-any-way-you-like dashboards
- Hand Finance, Dev, and Ops a view that speaks their language — and sparks action
- Auto-flag the weird stuff: spikes, waste, oddball trends, you name it
- Keep anyone from muttering, “Wait, who torched that extra $40 K?”
Now, let’s see the tricks Cloudaware and Cloudability bring to that party — and which ones your FinOps playbook will actually high-five.
Cloudaware
Cloudaware isn’t just a reporting engine — it’s your central intelligence layer for FinOps and ITAM. With deep CMDB integration, Salesforce-native analytics, and real-time usage visibility, it gives your teams the power to turn cloud spend into action.
What you get:
✅ Analytics Studio. Dynamic, interactive dashboards that let you slice and dice usage and cost data across accounts, services, teams, regions — and tie everything back to your CMDB.
✅ Usage Analytics. Prebuilt dashboards that highlight idle resource trends, RI/SP underutilization, and high-variance workloads — customizable by cloud, service, or tagUsage Analytics - FAQ.
✅ Force.com Reporting Engine. Build complex custom reports with cost formulas, CMDB fields, tags, account metadata, and even custom SLAs. Perfect for chargeback, showback, and budget forecasting.
✅ ITAM-Specific Dashboards. Need visibility into asset lifecycle costs, license utilization, or cost-per-asset group? Use CMDB relationships to create reports for:
- Hardware/software cost by status or location
- Depreciation tracking linked to spend
- Non-compliant or orphaned asset cost mapping
- Application spend grouped by criticality or ownership
✅ Persona-Specific Views. Finance gets cost center rollups. DevOps sees infra-level inefficiencies. Asset managers get lifecycle cost analysis — all from the same system.
✅ Dashboard Concierge. Cloudaware will build complex reports and dashboards for you — yes, including ITAM views — at no additional cost.
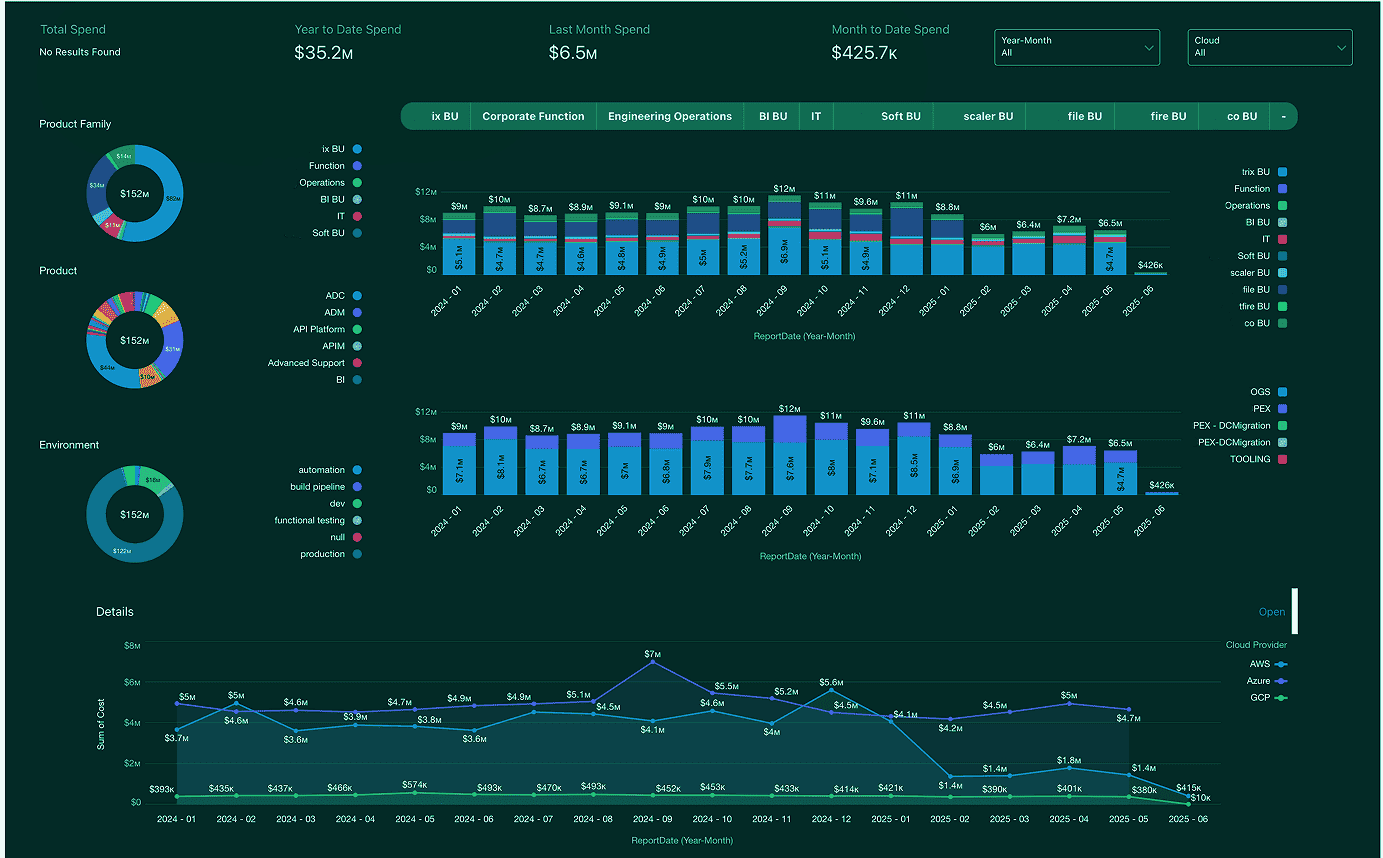
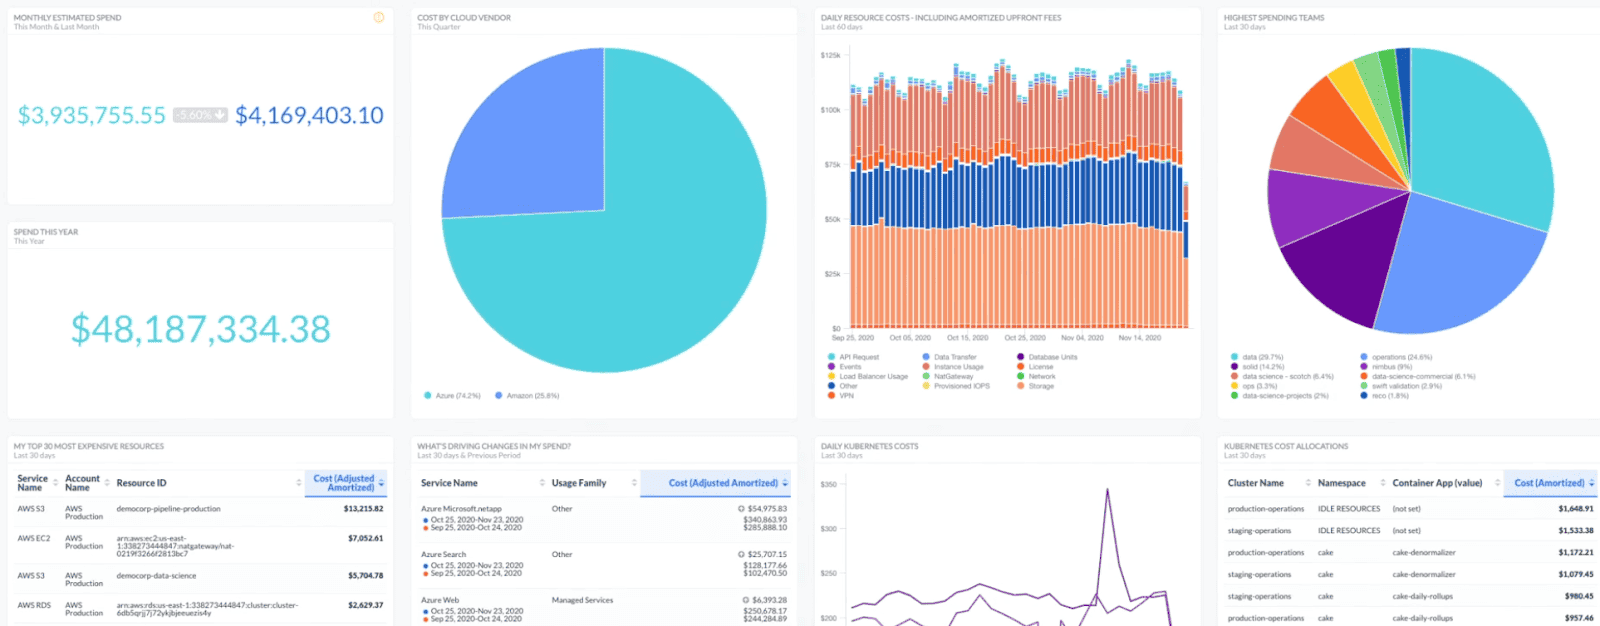
Example of the FinOps dashboard at Cloudaware. See it in action on a live demo.
One enterprise team used Cloudaware to build a report showing all infrastructure spend tied to assets past their lifecycle renewal date. Result? They shut down $12K/month in ghost workloads in two weeks flat.
Cloudability
Cloudability’s “True Cost Explorer” is where the magic starts. The moment AWS, Azure, and GCP bills land, the Business Mapping engine massages those raw CUR lines into human-readable labels — Auth-API-Prod-EU, not i-0ff123. Every metric refreshes several times an hour, so Finance sees fresh numbers while engineers are still in stand-up.
Cloud cost summary dashboard. Image source.
What you’ll actually poke at every day
| Cloudability feature | Why you’ll care in FinOps land |
|---|---|
| True Cost Explorer | Drag-and-drop pivots across account, service, tag, or custom dimensions like BusinessUnit and CustomerTier. Handy variance columns flag yesterday-vs-today jumps instantly. |
| Scorecards & dashboards | Pre-built widgets for RI/SP coverage, unit cost, tag health, and sustainability. Share-link them with a click — no CSV wrangling. |
| Tag Explorer | Live tag-hygiene meter shows dollars stuck in Unallocated, then lets you export the offender list straight to Jira or Slack. |
| Anomaly Detection | ML engine watches spend deltas in near real-time; hit a $ or % threshold and Cloudability pings the owner in Slack/Teams before the CFO notices. |
| Forecast & variance views | What-if sliders test growth scenarios; multi-dimensional budgets track overspend down to the squad. |
| Container & K8s lens | Nodes, namespaces, and pods broken out with CPU / memory efficiency scores — no more “Kubernetes black box” talk. |
| GraphQL + REST APIs | Push cleansed cost data into Snowflake/Looker or pull-back into Terraform scripts for automated tag fixes. |
How the workflow lands
- Morning stand-up – Engineering skims the “Daily Spend” widget; any spike shows the exact tags and owner in two clicks.
- Midday finance check-in – FP&A exports a variance report (amortized view) straight from the Scorecard — no 40-tab spreadsheet.
- Afternoon cleanup – Tag Explorer’s red rows become Jira tickets via bulk action; Business Mapping rules update on the next ingest.
- End-of-day guardrails – Anomaly Detection slacks on-call if egress goes wild, while commitment coverage charts remind FinOps to top up Savings Plans.
No Salesforce backbone or CMDB context here — Cloudability focuses on high-speed dashboards, quick share links, and APIs your BI team already loves. If “show me the numbers, now” is your daily mantra, it fits right into the FinOps reporting groove.
Buyer’s fit guide
| Factor | Cloudaware | Cloudability |
|---|---|---|
| Setup Time | 1–2 weeks | 1–2 weeks |
| Customization Power | Enterprise-grade (Force.com + Analytics Studio) | Flexible dashboards, Business Mapping, GraphQL APIs |
| Time to Insight | Real-time moderate ramp, deeply customizable | Fast — live views within first full CUR ingest (< 24 h) |
| Export Options | Excel, PDF, CSV, PNG image, dashboard snapshots, BigQuery | CSV/XLSX, GraphQL, Snowflake & BI connectors |
| Best For | Structured orgs, audit-heavy teams, SLA visibility | Teams after quick wins, lighter governance, TBM alignment |
Integrations
Ever had every AWS, Azure, and GCP line item singing in harmony — then someone lobs in a Databricks invoice or asks, “Hey, can we track OpenAI tokens too?” Boom, instant FinOps jungle.
This slice of work is all about plugging cost feeds from IaaS, PaaS, and that surprise SaaS contract straight into your dashboards — no midnight Python glue and zero tag-Tetris.
Here’s the hit list:
- Built-in connectors for the clouds and services you actually run, not just the big three.
- Smart enrichment — think CMDB look-ups, owner mapping, cost-center stitching — so Finance isn’t guessing who spent what.
- Real-time handshakes with Jira, Slack, PagerDuty, and your BI stack, so alerts land where people already live.
- APIs that stay upright — webhooks you can trust to fire at 2 a.m. without babysitting.
Now, Cloudaware and Cloudability tackle that jungle with two very different machetes. Let’s see which one clears the path for you.
Cloudaware
If your team lives in Jira, ServiceNow, or Salesforce, Cloudaware is your plug-and-play control tower. This platform isn’t just API-rich — it’s integration native.
Key features:
- Native billing integrations with 60+ tools like AWS, Azure, GCP, including support for linked accounts and AWS Organizations setups AWS Billing.
- Jira, ServiceNow, and PagerDuty integrations that route anomalies and budget breaches straight into workflows.
- Force.com backbone lets you extend logic via Apex classes, triggers, and automated actions.
- CMDB-backed enrichment for aligning cost data with owners, environments, and SLAs
- Webhook + API support to sync into ITSM tools or external reporting systems.
Cloudability
Need to funnel cost and usage from half-a-dozen clouds plus the random SaaS contracts Finance keeps signing? Cloudability leans hard on out-of-the-box connectors and a loud API layer so you’re not stitching bash scripts at midnight.
- Plug-and-play collectors – AWS, Azure, GCP land with a few read-only keys, and you can switch on Datadog, Databricks, MongoDB, Snowflake, and other non-CSP vendors from the same creds screen. Everything flows into one spend lake the next ingest cycle.
- Business Mapping enrichment – as data lands, rules translate cryptic IDs into business labels (think
Auth-API-Prod-EU). Those labels ride along to every dashboard and export, so Product, Dev, and Finance never argue nomenclature. - Ticket & chat hooks – a built-in Jira app pipes rightsizing or anomaly alerts straight into the right backlog column; ServiceNow, Slack, Teams, and generic webhooks keep Ops and Finance looped without copy-pasting URLs.
- Data out, wherever you need it – flip a toggle to stream cleansed spend into Snowflake for DIY modelling, or pull it live with Cloudability’s GraphQL/REST API — no cron babysitting.
- K8s & container lens – drop the lightweight metrics agent into your clusters and node-level costs merge with the rest of the bill automatically — handy when FinOps asks why “Dev-ML-GPU” doubled overnight.
Cloudability won’t rewrite your CMDB, but it does give you an integration “easy button” so every service, ticketing tool, and BI stack drinks from the same cost fire-hose — no duct tape required.
Side-by-side snapshot
| Integration Area | Cloudaware | Cloudability |
|---|---|---|
| Cloud Billing Sources | AWS, Azure, GCP (via CUR, APIs) | AWS, Azure, GCP + Kubernetes, Snowflake, OpenAI, Databricks, more |
| ITSM Tools | Jira, ServiceNow, PagerDuty native support | Slack, Jira (via webhook/API) |
| Data Enrichment | CMDB-driven, tag-based | Dimensions, metadata injection |
| Custom Logic/Rules | Apex, Force.com workflows | API + webhook automation |
| Best for Teams Who… | Need structured escalation + asset ownership clarity | Want rapid integration of any spend source with flexible grouping |
Price
Cloudaware
Cloudaware doesn’t do cookie-cutter pricing. Instead, it offers a modular structure that starts with its core product — the CMDB. Why? Because in Cloudaware’s world, there’s no FinOps without full visibility into your infrastructure. The CMDB maps every server, service, and tag in your environment, making cost analysis meaningful.
Here’s how the pricing breaks down:
- First, you buy the CMDB module, which is priced based on the number of configuration items (CIs). For most environments, this averages out to about $0.008 per CI per month.
- For a setup with 100 cloud servers, you're looking at around $400/month for CMDB.
- Then, if you want cost management features, you add the FinOps module, which is priced at 20% of your CMDB spend.
So in this case:
- CMDB: $400/month
- FinOps module: 20% of $400 = $80/month
- Total: $480/month
Compared to native tools like AWS Cost Explorer or high-cost standalone FinOps platforms, Cloudaware offers a clean, infrastructure-aware cost control platform — without the surprise bills or the hefty % cut from your cloud spend that many other tools charge. That’s money better spent optimizing, not just reporting.
Cloudability pricing
What Cloudability is likely to charge for your footprint
| Scenario | How Cloudability prices | Ball-park annual fee* | Quick math |
|---|---|---|---|
| $50 K / month cloud spend(≈ $600 K/yr) + 1 seat + 100 servers | Sits below the lowest public tier, so you’ll be quoted the minimum licence Cloudability lists on AWS Marketplace | ≈ $54 000 | $54 K ÷ $600 K = 9 % of annual spend |
| $150 K / month(≈ $1.8M/yr) | Fits Cloudability’s first published tier (covers up to ≈ $150K/mo) | ≈ $54 000 | Works out to 3 % of annual cloud spend |
| $200 K / month(≈ $2.4M/yr) | Price usually scales ~2-3 % of spend; expect a quote part-way to the next tier ($97.2K for $300K/mo) | $70–90K | 3 % of $2.4 M ≈ $72K |
Cloudability sells annual SaaS subscriptions. User count is unlimited, so “1 user” doesn’t reduce the fee; the meter is your total monthly cloud spend. Expect:
- Tiered %-of-spend model – roughly 3 % at smaller volumes, sliding toward 2 % as you scale.
- A $54 K annual floor — even very small accounts pay this minimum licence.
- Optional add-ons (managed FinOps services, premium support) quoted separately.
For a $50 K–$200 K monthly range you’re realistically in the $54 K–$90 K per year bracket, billed upfront and covering as many users as you need.
So… which one’s your FinOps soulmate?
Reach for Cloudaware when…
-
Context is king. You need every CUR line stitched back to an app, sprint tag, or owner without chasing teams for tag fixes.
-
Governance matters. Approval flows, role-based dashboards, and audit trails have to be as tight as your IAM policies.
-
You still want Jira/Slack in the loop. Cloudaware fires, Slack, Teams, Jira, and ServiceNow actions via Force.com flows — no extra glue code.
-
Salesforce is already in your bloodstream. Reports, automations, and access controls feel native from day one.
-
You’re OK investing a bit more setup time — because the payoff is iron-clad allocation and fewer “Who owns this?” moments.
Reach for Cloudability when…
-
Speed to insight trumps deep context. You want dashboards live by lunchtime and will refine Business Mapping rules as you go.
-
Automated commitment coverage and quick wins (RI/SP tuning, container rightsizing) top today’s to-do list.
-
You prefer lightweight webhooks over a Salesforce core and don’t need CMDB-grade relationships out of the box.
-
Your spend sits in the low-mid six figures and a straight %-of-cloud-bill licence feels simpler than module pricing.