


You’re here to speed up releases without turning every merge into a security tribunal: pull requests stuck in “waiting for approval,” SAST noise nobody trusts, a surprise public S3 bucket in prod, then a retro nobody wants. Black Duck’s 2025 Global DevSecOps Report found 81.22% of pros say app security testing slows the development and delivery lifecycle.
That friction is exactly why DevSecOps velocity feels like a myth, until you treat it like a system: block only compounding risk, warn with SLAs, route approvals to the right owner, and stop drift from quietly eating your lead time.
In this article, we collaborate with Cloudaware experts Valentin, Software Developer, and Igor, a DevOps Engineer, to automate the mapping of the scorecard, gates, and evidence.
- What should truly block promotion, and what should ship with an SLA?
- Where is your lead time really leaking: gates, triage, or drift after deploy?
- Which signals, or indicators of performance, belong beside DORA (DevOps Research and Assessment) so you can prove improvement next month?
- When do you run deeper checks without stalling merges?
- Who owns the 2 a.m. alert, and how does it route automatically?
- What audit evidence can you generate without screenshots?
Key insights
- DevSecOps velocity is secure speed, not “more deploys.” If you can ship fast but spend the next sprint cleaning up risk, you didn’t gain speed; you borrowed it.
- Stop arguing about “slow.” Put it on a scoreboard. Start with DORA, then add the “why are we slower?” Layer: approval wait time, drift rate, policy breaches per deploy, false-positive proxy, and remediation MTTR. That’s where the truth hides.
- Developer velocity can look great while release velocity is dying. PRs (pull requests) move, builds finish, and then everything stalls in approvals, rework, or audit evidence hunts.
- People often overlook the crucial component of security velocity. Measure how fast you detect, route to an owner, fix, and verify. If findings don’t land on a human with context, your program is just generating noise.
- Most “pipeline bottlenecks” aren’t compute. They’re late gates, broad scans, and human queues. A 12-minute pipeline plus a 6-hour approval is not a tooling problem. It’s a workflow problem.
- Turn gates into a contract: block, warn, log. Block only compounding-risk changes. Warn with Service Level Agreements (SLAs) for the rest. Log noisy rules until they’re tuned, then promote them. Predictability beats panic.
- Make checks incremental and context-aware. Scan the delta, which refers to the difference or change, on PRs (pull requests). Run full coverage on a promotion or a schedule and use service criticality, environment, and data class to decide depth. That’s how you keep signals high and cycle times low.
- Kill approval latency with routing, not meetings. Approvals should route by environment, account, and ownership, live inside Slack/Jira/SNow, and expire when the window closes. If it needs a meeting, the request lacks context.
- Treat configuration drift like a post-release tax. Establish a baseline, track drift age, record attribute-level changes, and decide quickly whether to revert, codify, or time-box an exception.
- Automate evidence so audits stop hijacking engineers. Traceability from commit to deploy, plus checks performed, should be a default output, not a quarterly scavenger hunt.
What does DevSecOps velocity mean?
DevSecOps velocity is the rate at which you can move changes into production while keeping risk predictable and cleanup work small. In practice, it’s how fast you can ship and still trust the result: no surprise exposures, no “we’ll fix it next sprint” pile, and no last-minute approval drama. That’s secure speed in the only way your org actually feels it: shorter lead time, fewer fire drills, and fewer debates.
Now, it gets messy because people call three different things “velocity,” and they’re not the same.
What people mean by “velocity?”
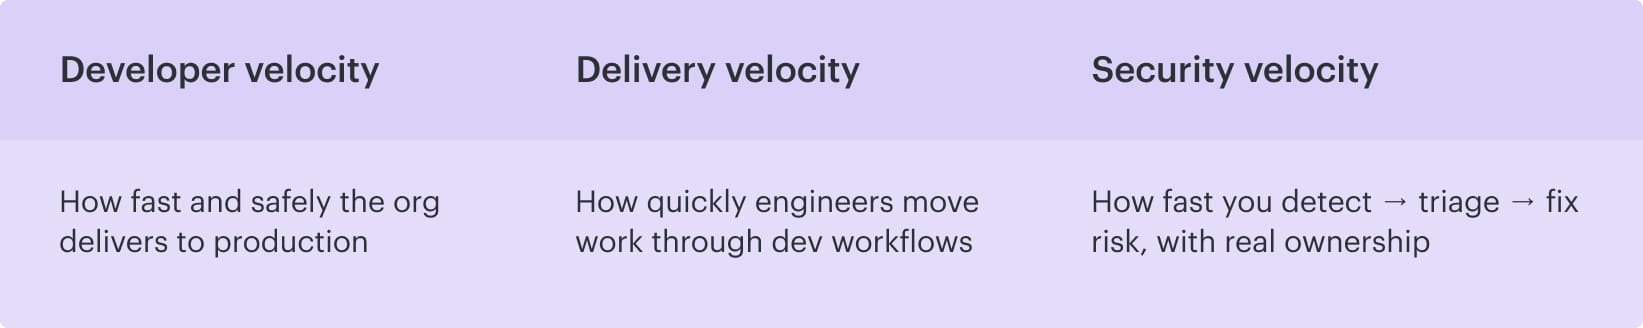
- Developer velocity is how quickly engineers move work through day-to-day workflows: PR ready time, review turnaround, build minutes, and time-to-first-feedback. When it’s healthy, teams spend less time waiting and more time shipping, which is excellent for secure software delivery, but it still doesn’t tell you whether releases are safe to promote.
- From there, delivery velocity shows what actually reaches users. This is DORA throughput and stability: deployment frequency, lead time for changes, change failure rate, and time to restore. You can merge plenty of code and still be slow if promotions stall in gates, rollbacks spike, or “done” means “someone will chase evidence later.”
- And then there’s security velocity, the part that decides whether speed turns into debt. It’s the time from signal to action: detect, triage, assign, fix, verify, and close. High security velocity looks boring in the best way: issues are routed automatically, noise is tuned down, remediation time shrinks, and exceptions expire instead of living forever. You get there with security-as-code, so decisions are enforced by rules and evidence, not calendar invites.
4+5 metrics that make velocity real
If you can’t measure it, you can’t defend it. And in DevSecOps, velocity gets political fast because everyone has a different definition of “slow.” So we start with the four numbers leaders already recognize. They’re the backbone, and they give you a shared scoreboard.
These are the classic DORA metrics. They don’t tell you why you’re slow, but they tell you where to look.
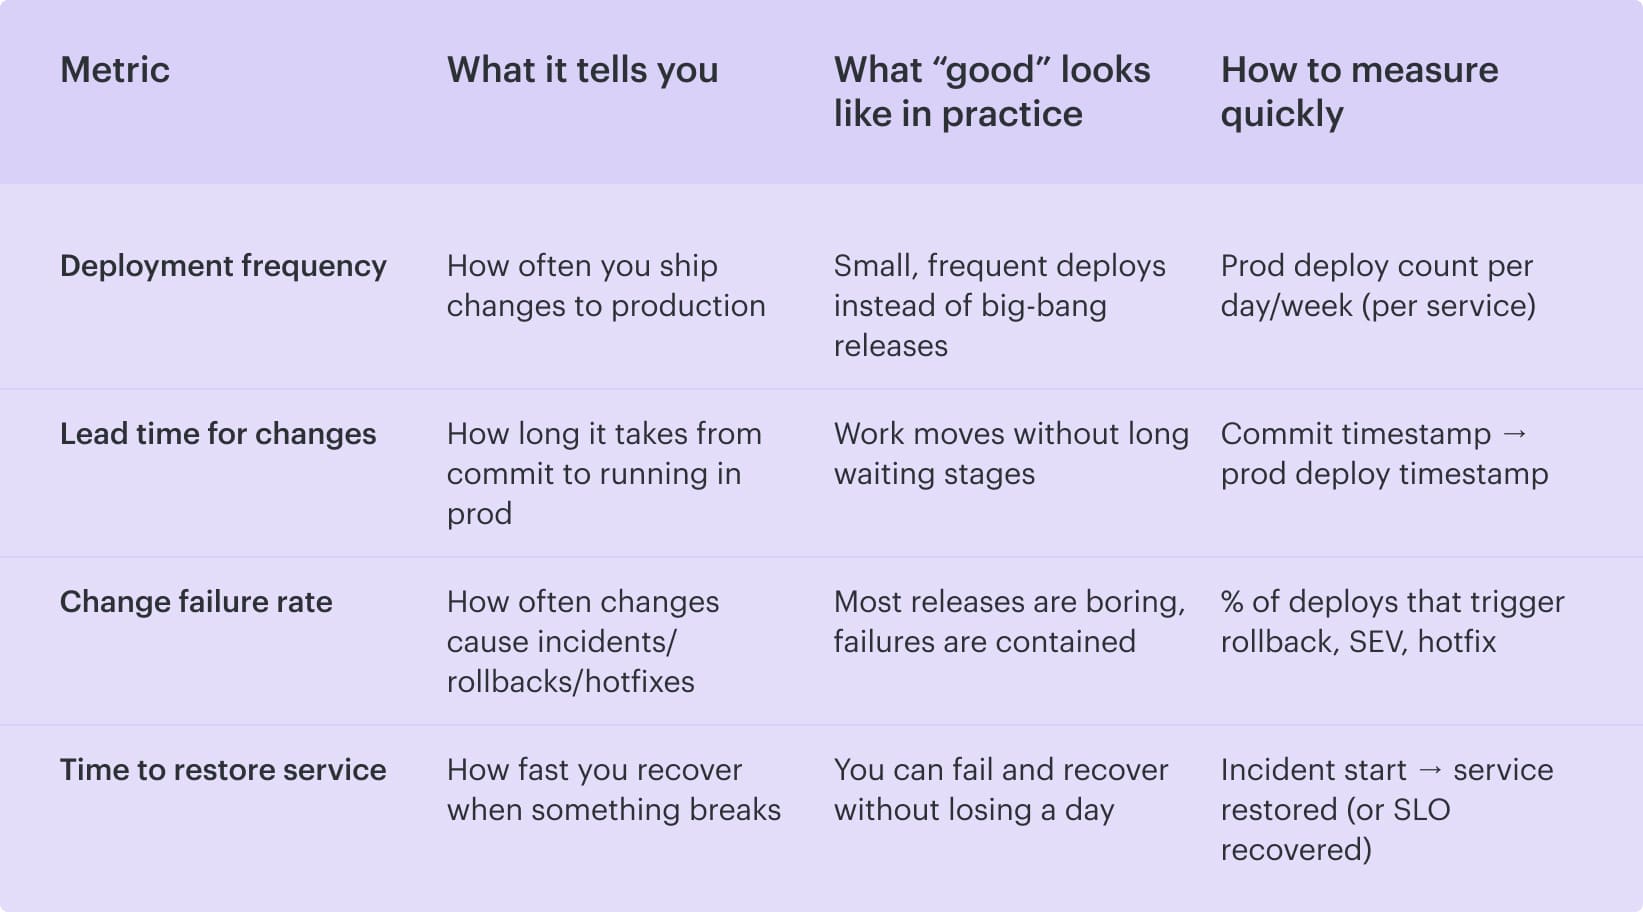
So far, so good. But here’s the trap: these four can tell you “lead time is getting worse” while everyone argues about whose fault it is. This is where velocity work usually dies in meetings.
To keep it operational, you add five “security velocity” signals that explain why that lead time is rising. They turn the conversation from opinions into receipts.
Read also: 13 DevSecOps Metrics - The Scoreboard for Security + Delivery
The 5 security velocity add-ons
Here’s when you should pull these out: when your DORA metrics indicate that lead time is climbing, change reviews are becoming tense, or teams start the classic practice of batching work “so we don’t deal with security five times.” The standard four show the symptom. These five tell you what’s causing it.
And why bother? Because “security is slowing us down” is usually a blend of three different problems that look identical on a dashboard:
- Gates are too strict or badly tuned
- Findings are too noisy to trust
- Work is waiting on humans or getting undone by drift after deployment
So treat these add-ons like a diagnostic layer. You don’t use them to create more reporting. You use them to decide what to fix next sprint: tune a rule, change what blocks, shorten approval paths, or tighten drift controls. Once you track them consistently, velocity debates stop being emotional. They become operational.
Now let’s break them down.
| Security velocity add-on | What it reveals | What to track | What “bad” looks like (so you know it’s the culprit) |
|---|---|---|---|
| Policy breach rate per deploy (and % blocked vs warn vs log-only) | Whether releases are slowed by real risk or by over-gating | Breaches ÷ deploys, split outcomes into block/warn/log-only | The “block” slice grows week over week, so the pipeline stops validating and starts acting like a traffic jam |
| False positive rate (alert fatigue proxy) | Whether noise is killing trust and triage time | % findings dismissed / ignored/ auto-closed, plus reopen rate if you have it | Security looks “busy,” but delivery stalls because teams stop believing the signals |
| Vulnerability remediation time (MTTR) | How quickly teams absorb security work without derailing delivery | Median + p90 MTTR by severity and by service | MTTR spikes, backlog grows, and every sprint inherits yesterday’s risk as extra work |
| Drift rate in prod (resources drifting per week + % fleet in drift) | Whether post-deploy changes are undoing your pipeline discipline | # drifting resources/week and % of total fleet in drift | More “who changed this?” hunts, longer change reviews, and frequent “rollback to be safe” decisions |
| Approval cycle time (wait time for a human, by environment) | Whether lead time is dominated by queues, not engineering | Median + p90 approval wait time for dev/stage/prod | Prod approvals take hours while lower envs are fast, meaning routing/ownership is the bottleneck, not compute |
When combined, these nine metrics eliminate the tendency to assign blame. You can walk into a review and say, *"Delivery slowed because approval wait time doubled and blocks went up, while drift stayed flat.*”
That’s a conversation you can fix. And once you can fix it, compliance adherence stops being the reason velocity dies and starts being the thing you can prove without drama.
5 pipeline bottlenecks where DevSecOps speed dies
You know that moment when a release should be boring, but it turns into a war room anyway? The reason is because a few repeatable cracks allow speed to leak out, appearing as "processes" until you put a time limit on them.
Pipeline run: 12 minutes. Time lost to waiting, re-scoping, re-checking, and chasing proof: half a day.
Those are your real pipeline bottlenecks.
1. Security checks show up late, right when stakes are highest
The pipeline didn’t get slower. Your decision loop did. Teams sprint through implementation, then hit release week and discover the security queue is full of “findings” that aren’t even triaged, half of them lack an owner, and nobody can tell you which ones are actual blockers. So the meeting becomes a risky negotiation. This isn't due to recklessness but rather to a lack of time and context.
Here’s the tell: build time is measured in minutes, yet lead time balloons because you're waiting on humans to interpret the results. Late testing presents a major obstacle as it necessitates scope decisions at the most inconvenient time. “Do we delay?” “Do we accept risk?” “Do we carve out an exception?” Every answer costs you days.
Then teams try to fix it by adding more checks, which makes the second bottleneck inevitable 👇
2. Checks run too broadly
The fix isn’t “scan less.” It’s “scan smarter.” Make checks incremental by default. Run delta-based analysis on the PR, apply deeper tests on promotion to stage/prod or on a nightly cadence, and treat check depth as a function of change type:
- Code change, run code-focused checks
- Dependency bump, focus on SBOM and vuln deltas
- Policy change in Terraform: evaluate the resource diff and the permissions delta
If your pipeline timings look fine and lead time still grows, don’t blame compute next.
3. “Just in case” tickets quietly eat your lead time
A change requires sign-off for compliance, but the approval rule is based on vibes. So devs open a ticket, paste context, wait, get a question, re-explain, and wait again. The queue time becomes the work.
If your build completes in minutes, but your approval process takes hours, then you have a problem. You don’t have a tooling gap. You have an ownership and routing gap. That’s not a DevOps (development and operations) issue, but a workflow design problem.
Let’s say you finally ship. You’d think the story ends. In the cloud, it rarely does.
4. Runtime drift turns “we shipped fast” into “we cleaned up for a week"
Runtime drift is how you “ship fast” and then pay interest for a week. The pipeline did its job, yet production changes were made anyway. A console edit sneaks in to unblock traffic. A break-glass IAM grant gets added for an integration, and nobody pulls it back. Auto-scaling or a remediation script “fixes” something and creates a new diff.
By Monday, the team isn’t building features. They’re doing archaeology on surprise deltas and trying to answer the worst question in cloud operations: who changed this, and was it approved?
That’s why drift is a velocity killer.
The fix?
Track it like a first-class metric. Drift per week, percent of fleet in drift, time-to-detect, and how long drift survives before it’s either reverted or codified back into IaC.

Once you can see drift age, you can stop treating it as “normal cloud chaos” and start treating it as a controllable tax.
And the final leak is the one that makes grown adults hate release day.
Manual audit evidence turns each release into a mini investigation
If compliance proof means screenshots, spreadsheets, and Slack archaeology, every deploy has hidden administrative weight. In addition to shipping software, you’re reconstructing history.
That work is easy to underestimate and impossible to scale. It also trains teams to avoid frequent releases because they can feel the paperwork coming.
If you’re nodding at two or three of these, you’re not alone.
When pipelines automatically create that traceability, security workflows stop being compliance theater and start acting like engineering work. Audit proof is no longer a reconstruction but a question. And releases no longer have hidden administrative weight.
Read also: 9 DevSecOps Benefits for Security Leaders [With Proof]
5 best practices for DevSecOps velocity
The patterns below originate from observing real teams in hybrid multi-cloud environments constantly contending with the same challenges: slow approvals, noisy checks, drift, and audit evidence that often appears as a spreadsheet at inconvenient times.
If you’re a security leader or you run Platform/DevEx, you need moves that change the graph next month. These seven are the ones that reliably do 👇
Turn velocity into a contract: block, warn, log
Release decisions get weird when “security” is a mood instead of a rule. One person thinks a finding is fine, another hears “audit,” and suddenly your team is negotiating risk on a Friday afternoon.
So make velocity a contract.
Once that line exists, you need a third lane: log. Early on, some rules are too noisy to enforce. Log them, watch the trend, tune them, and then promote to warn when the signal is stable. That’s how you avoid the “block everything” trap that makes engineers stop trusting the pipeline.
Exceptions lead to the demise of noble intentions. If a waiver has no end date, it becomes a permanent risk that nobody remembers. Time-box it. Track how many exceptions are active, how often they get renewed, and how long they live.
When the renewal rate is high, the control isn’t working, or the workflow is.
Make security checks incremental and context-aware
If you want speed and credibility in application security, stop treating every change like it’s a full rebuild of the world. Most PRs are small. Your checks should feel small, too. Otherwise, the pipeline becomes a tax, engineers start batching changes, and your lead time quietly balloons.
Split checks into two loops.
| Fast loop for every PR: do incremental scanning on the delta. A merge request that touches one Terraform module should trigger analysis on the permission and exposure diff, not a full repo sweep. A dependency bump should focus on the new versions and what they introduce. A narrow config tweak should run only the checks that can realistically change the outcome. Keep this loop short enough that people don’t switch context while they wait. | Slow loop, on cadence or promotion: run full coverage on a schedule or when risk increases. Nightly deeper scans, broader dependency analysis, and heavier testing at promotion to stage or prod. This phase is where you catch the long-tail issues without blocking daily delivery. |
|---|
Use risk-based gating to ensure that check depth matches the context of the environment, data classification, and service criticality. A low-risk internal service in development should not encounter the same friction as a production service that handles PII.
The difference is math. You reduce false alarms, triage time drops, and keep teams trusting the signal.
This is also where tooling can quietly help without becoming the star of the story. When teams already maintain a CMDB or service catalog, they can use that context to scope checks and approvals.
In Cloudaware, for example, that service context is available right where security and change decisions get made, so you’re less likely to treat a minor change like it’s happening on a crown-jewel prod system.
That’s a practical way to cut noise, because findings get interpreted against the service, its environment, and the kind of data it handles.
Keep the PR (pull request) loop tight, let deeper coverage run with intention, and use context to choose depth. That’s how DevSecOps stays fast without getting sloppy.
Read also: 15 DevSecOps Tools - Software Features & Pricing Review
Kill approval latency with routing, not meetings
Your pipeline isn’t slow. Your humans are. In cloud-heavy continuous delivery, it’s common to see a 10-minute build and a 6-hour wait for someone to say “looks good.” DevSecOps velocity dies in that gap, and it is not related to code quality.
Fix it by turning approvals into routing.
- Make change control predictable: approvals should be assigned by environment, account, and team ownership, not by whoever happens to be online. Prod changes go to the actual service owner. Shared platform resources route to the platform. Security only gets pulled in when the change crosses a defined risk boundary. When ownership is explicit, approvals stop bouncing.
- Then add time windows. Planned changes deserve planned approvals. If you know the maintenance window is 10-11 PM, approvals should open and expire around that window. No more zombie requests sitting in a queue for two days.
- Finally, make decisions where work is already happening. Don’t ask engineers to live in yet another portal. Push approvals into Slack, Jira, or ServiceNow, so the approval is a click inside the workflow. This is how automated approvals and DevSecOps workflow automation reduce latency rather than add to the process.
If the approver cannot see all three things immediately, the approval process is considered broken.
Do this well, and you get more than speed. You get resilience because the right people see the right changes at the right time, before they become a firefight.
Read also: 10 DevSecOps Best Practices That Actually Survive Production
Treat drift as a post-release velocity tax and close it fast
Many teams “shift left” by adding more scans in continuous integration, then get confused when delivery still feels heavy. You can have a clean development pipeline and still lose days to changes that happen after deployment. That’s configuration drift, and it’s basically interest on your release. You ship on Friday, then burn on Monday, proving prod still matches what your code assumes.
Valentin put it in a way I’ve seen play out too many times:
In one enterprise environment he worked with, a team kept “mysteriously” failing a rollout. The root cause wasn’t a new code. A security group rule, hotfixed during an outage, remained silently in place. Every subsequent deploy looked risky because the environment no longer matched the declared state, so the team started batching releases and adding manual reviews. Velocity died, not from scans, but from uncertainty.
- The fix starts with a drift baseline, because drift is only visible when you have a “known good” reference. Pick a moment that counts. Right after a production deploy works well. Another is the close of a planned change window. Either way, define the snapshot you trust so you can quickly answer: normal behavior or new risk?
- From there, make drift specific. Record attribute-level changes that actually affect security and reliability. IAM permission deltas. Public exposure flags. Encryption settings. Network routes. Tags tied to ownership. “Resource changed” is trivia. You need the kind of detail that lets you assess blast radius fast.
- Then treat change history as a velocity tool. Fast teams don’t guess. They pull the timeline and decide what happens next: revert the drift, codify it back into Infrastructure as Code (IaC), or accept it with a time-boxed exception. That decision gets realistic when history is searchable and tied to services, not scattered across console logs and chat threads.
If you’re already using its CMDB and service context, you can look at a service and see what changed around it over time, down to the attributes that matter.
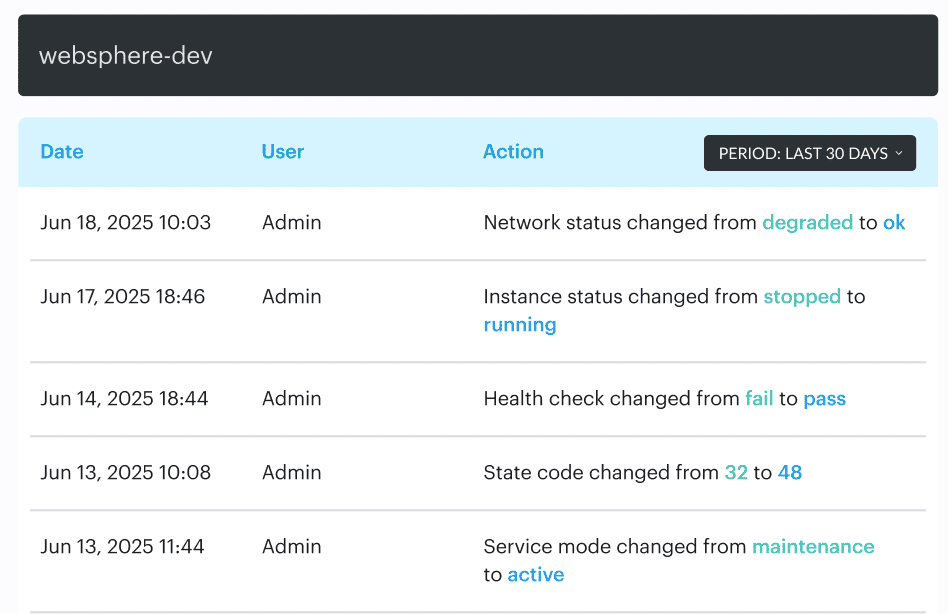
When something breaks, you’re not asking “who touched prod?” You’re answering “which permission expanded, which rule changed, and what else moved in the same window?”
Close the loop with after-action reviews. Export the history, turn it into cleanup work, and track drift rate per week, percent of fleet in drift, and drift age. If drift is still alive two sprints later, it’s no longer an accident. It’s an operating model.
Read also: DevSecOps Maturity Model - Scorecard You Can Measure
Make “evidence” automatic
Audit season panic is a predictable tax on velocity. The organization waits until the deadline to reconstruct reality, not because auditors are evil.
Then your best engineers become part-time historians. They dig through tickets, paste screenshots, explain why a change was “safe,” and try to remember which checks ran on which build. Agility drops, delivery slows, and everyone learns the wrong lesson: “security makes us slow.”
The fix is boring and powerful: Treat the evidence like a first-class output from the pipeline. Every change should carry its receipts, generated continuously. That means traceability from commit to deployment, plus the checks that ran and their outcomes. Not a narrative. A chain.
Igor is blunt about what “good” looks like:
Once you build that, continuous compliance stops being a meeting and becomes a property of the system. Your teams ship without pausing to prove they’re allowed to ship. Exceptions become visible because they’re recorded. Reviews get faster because the context is attached. Post-incident analysis gets sharper because you can see what changed, what was verified, and what wasn’t.
This is what audit-ready reporting is supposed to feel like. Not a special project. This is simply your standard operating state, in which the pipeline consistently produces both software and evidence.
How Cloudaware helps you improve DevSecOps velocity
The playbook sounds great on paper until you try to run it across three clouds, five accounts, a handful of shared services, and a release train that won’t wait for a meeting.
Cloudaware helps teams operationalize DevSecOps velocity by turning “who changed what, is it safe, and can we prove it?" into something the platform can answer fast, consistently, and at scale.
Once you have that foundation, execution gets simpler:
- 100% change visibility across hybrid environments. See changes across clouds and on-prem so you’re not guessing what moved or relying on manual tagging when an application starts behaving differently.
- Real-time change review. Review what changed as it happens, while the context is still fresh. This is where speed comes from, because you stop doing post-facto archaeology.
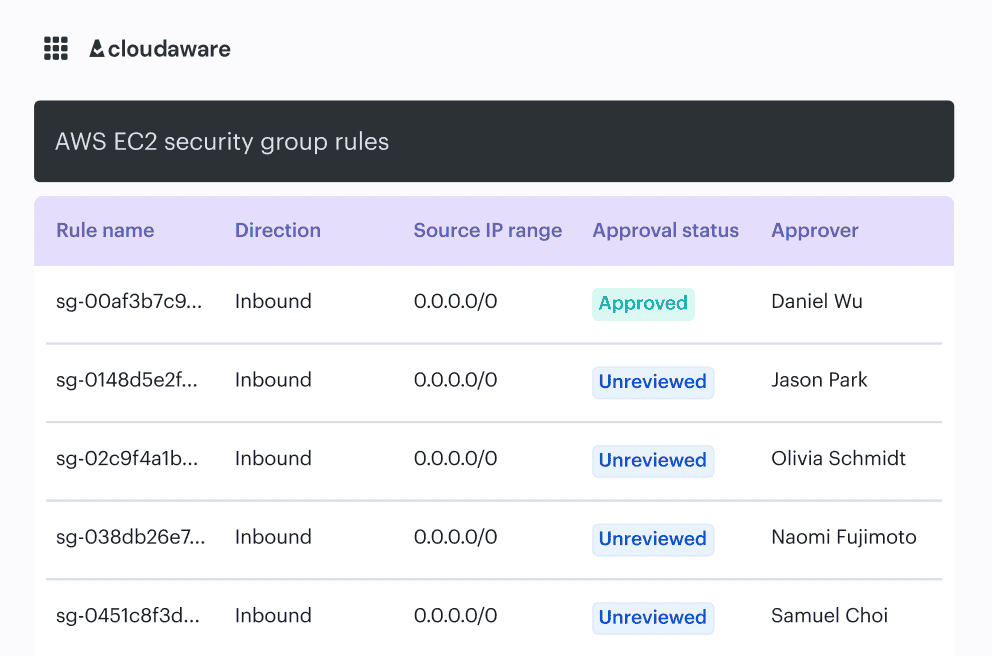
- Go/no-go policies based on violation data. Turn security gates into rules, not opinions, in meetings.
- Policies can block promotion when a change crosses defined boundaries and integrate with tools like Wiz and Trusted Advisor, so your application security decisions are grounded in current violation signals.
- Drift baselines and full change history. Establish a baseline, then track attribute-level change history so “mystery changes” don’t eat the sprint. When drift shows up, you can decide quickly: revert, codify back into IaC, or time-box an exception.
- Audit-ready reporting + traceability. Evidence is generated continuously. You get traceability from change to controls without pulling developers into screenshot duty.
- DevSecOps dashboards for velocity signals. Track remediation time (MTTR), change failure rate, and other indicators that tell you whether your software delivery is getting healthier or just louder.