Choosing the right FinOps stack feels like landing planes in a storm: AWS CURs in one tab, Azure exports in another, BigQuery billing in a third — plus a sprawl of CIs (Accounts, Subscriptions, Projects, Instances) and dashboards that don’t agree. Tags drift. Budgets squeak. Leadership wants a number you can defend by stand-up.
This guide cuts through the noise. We break down 12 FinOps tools with the stuff that matters in real life:
- feature-by-feature analysis,
- who uses them and for what,
- pricing you can model,
- and testimonials from real users who’ve lived the edge cases.
We put in 36+ hours so you don’t have to — demos, trials, and review dives — to assemble the recommended FinOps tools for cloud finance management.
Grab coffee. Let’s make your next cost review the calmest meeting of the week.
How to choose an ideal FinOps tool: 5 selection characteristics
Here’s the checklist Cloudaware experts recommend when picking FinOps tools for cloud that will actually survive month-end.
- Provider-native ingest with clear cadence. Must pull AWS CUR, Azure Cost Management exports, Alibaba, Oracle, and GCP Billing reliably (hourly metrics, daily merges). If the tool can’t say when numbers update, your Tuesday report will contradict your Friday deck.
- CMDB-enriched data model. Billing lines stitched to real CIs: AWS Account, Azure Subscription, GCP Project, EC2 Instance, Azure VM, GCE Instance, EBS Volume, S3 Bucket, RDS/Cloud SQL — plus business objects like Application__c, Environment__c, and owner_email__c. This is where tag gaps stop breaking allocation because relationships fill the holes.
- Tag governance and derived tags. Policy checks for required keys (e.g., application__c / environment__c) at create time; retro-enrichment that derives “virtual tags” from account→app mappings. Fewer exceptions in reviews, cleaner audit trails in change management.
- Allocation engine you can defend. Rule sets for cost splitters (usage-based, fixed %, weighted) across shared lines — NAT, support, egress, taxes. Every rule should log the method and driver so Finance signs off without a hallway meeting. That’s how you turn raw spending into ledgers per product, BU, or owner.
- Transparent rate math. Blended vs. unblended views, amortized (effective) rates, and commitment benefit allocation visible on every chart. If you can’t flip the switch and see the math, you’ll argue about “unit rate” all week.
- Commitment planning that mirrors reality. Coverage and utilization for RIs/Savings Plans with time-phased recommendations: by app, by environment, by renewal window. The planner should let you model purchases before they hit the bill.
- Waste detection and safe rightsizing. Policies for idle/over-provisioned resources: unattached volumes, cold LBs, oversized DB tiers, off-hours schedules. Findings must include owner, CI list, and potential savings so tickets write themselves.
- Forecasts + budgets that hold up in reviews. Time-series forecasting with variance bands; budgets tied to owners; alerts that nudge before month-end. Good platforms show driver notes alongside the number so your summary reads like a plan, not a plot twist. Yes, this is where cloud cost gets predictable.
- Anomaly detection with root-cause pivots. Baselines by account, service, tag scope, and deployment age; one-click drill to “what changed” (top movers, new services, recent deploys). Alerts should route to the human who can fix it — not just a mailbox.
- Kubernetes allocation you can act on. Cluster → Namespace → Workload/Pod mapping with CPU/memory/network consumption and node pricing. Tie it back to owners and apps so containerized environments stop reading like a mystery novel.
- Workflow hooks, not screenshots. Native actions to open Jira/ServiceNow, ping Slack/Teams, and require approvals for high-impact changes. Findings that don’t create work in the right lane will die in chat history.
- APIs and exports that keep Finance happy. Curated datasets for your warehouse and one-click Excel/PDF for the weekly packet. If a CFO can’t trace a number, you’ll spend Thursday rebuilding slides.
Quite a lot of characteristics, right? Unfortunately, there are not so many solutions that meet these criteria. Below, you’ll find the best FinOps tools list on the market 👇
How we evaluated each of the FinOps software:
- Live demo with the vendor: verified scope (AWS/Azure/GCP), data ingest cadence, roadmap fit, and walked through our target flows (allocation, budgets/forecasts, anomalies, rightsizing, Kubernetes, APIs/workflows, reporting).
- Hands-on trial in a prod-like sandbox: connected real billing exports, enforced tag/CMDB mappings on CIs (AWS Account, Azure Subscription, GCP Project; EC2/VM/Pod), and ran our pass/fail checks against the criteria outlined earlier: accuracy of cost allocation, transparency of rate math, signal-to-noise on anomalies, practicality of optimization, and ease of export/automation.
- User feedback analysis: reviewed public customer testimonials and marketplace reviews to validate time-to-value, usability, stability, support quality, and pricing clarity; flagged consistent pros/cons and weighed them against our findings.
Each tool analysis took on average 2–4 hours. Now multiply it on 11 solutions in this list – that’s the time this article will save you 😉
Now, let’s start with the first platform
Cloudaware
Capterra: ★★★★☆ 4.5/5
Trial days: 30
Best for: multi-cloud environment of mid-size and enterprise companies
Does your spend rolling across AWS, Azure, Oracle, Alibaba, and GCP? Your leadership wants cleaner allocation, faster variance calls, and fewer mystery line items?
Cloudaware shows up like a clean ledger with a living CMDB behind it — every data point enriched with app, team, and environment context. It ingests provider-native billing (CUR/DBR for AWS, EA data for Azure, exports for GCP), then gives your org one pane to track, allocate, and forecast with drill-downs that match how you actually run workloads.
Cloudaware is a single system for cost visibility and actionable insights about each aspect of CIs your multi cloud environment, so numbers roll up by product, owner, and environment — not just account and SKU.
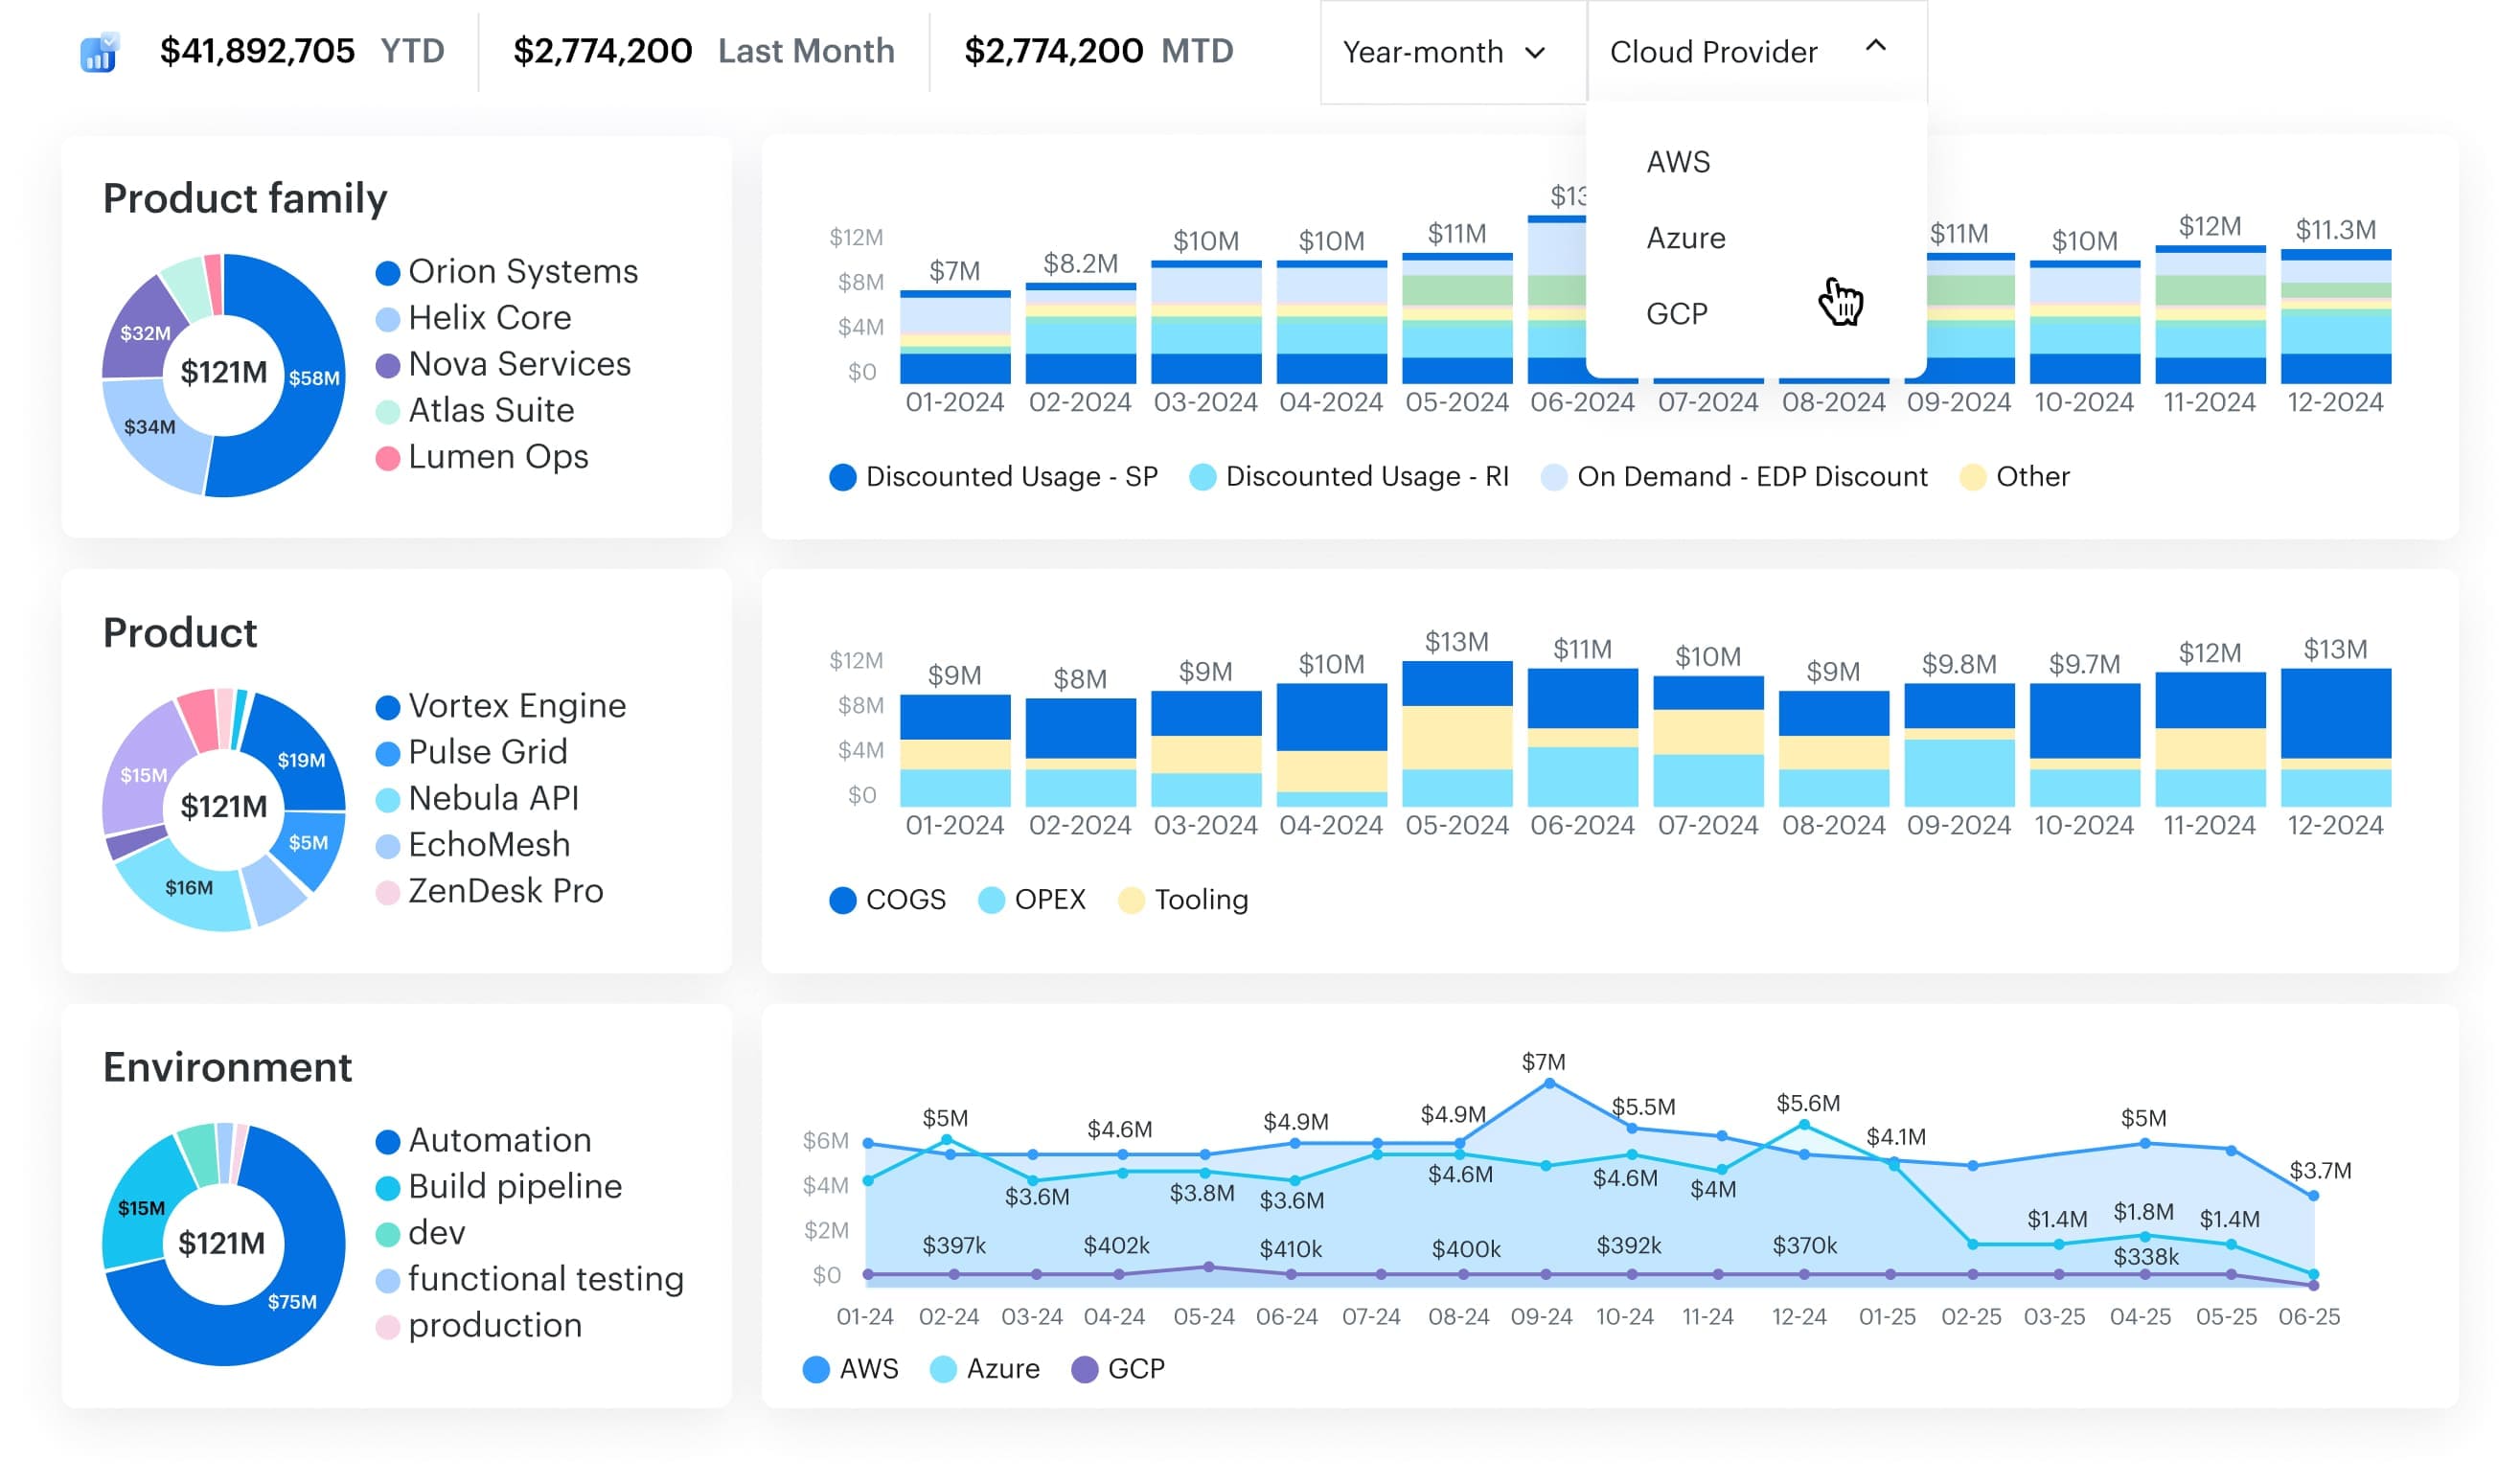
It supports AWS, Azure, Oracle, Alibaba, and GCP natively and builds cross-cloud reports with filters by services, product, and history in real time. That unlocks allocation you can defend, plus proactive budgets and alerts that keep surprises out of the close.
Finance uses it to run showback/chargeback, budget alerts, and month-end exports without rebuilding spreadsheets. Engineering uses it to spot waste, rightsize, and plan RIs/SPs with coverage/utilization views that actually reflect how services are deployed.
The FinOps practice uses it to stitch cross-cloud totals, compare blended vs. unblended rates, and land decisions in weekly reviews with evidence, not opinions.
Cloud cost management features
- Cost management dashboards. Curated views by business unit, product, environments, and services. Flip between blended/unblended, amortized/effective rates, and trendlines without rebuilding a single pivot.
- Idle resources. Policy checks flag unattached EBS volumes, stale snapshots, idle Azure Managed Disks, cold GCE persistent disks, zombie load balancers, and overprovisioned RDS/Cloud SQL. Each finding includes potential savings and the owning CI so remediation lands with the right team.
- Anomaly detection. Daily spend baselines by account, service, and tag scope. When a deviation hits, Cloudaware links it to the exact resources (e.g., EC2 Instance, Azure VM, GCE Instance) and routes to the owner with context. Your “what changed?” thread starts with evidence, not guesswork.
- FinOps forecast. Rolling forecasts by app/BU with RI/SP benefit allocation baked in. Compare scenarios (steady vs. growth vs. migration), export to Finance, and set variance thresholds so surprises don’t survive past the morning check-in.
- Commitment planning (RIs & Savings Plans). Coverage and utilization by account, app, and environment. See where you’re under-covered, model term/size options, and time purchases to upcoming deployments.
- Tagging automation (governance + enrichment). Require application__c, environment__c, and owner_email__c on new infra via policy checks. For legacy gaps, Cloudaware derives “virtual tags” from the CMDB (account→app mapping, ownership, cost center) so allocation stays intact even when native tags lag. Open Jira/Slack tasks automatically when violations persist.
- Cost allocation with tags. Allocatable cost for every shared line item (NAT, Support, egress) using tag keys plus CMDB relationships. You choose the splitter: by usage, by account weight, or by app ownership. The method is auditable, and the report is C-suite safe.
- Budgets & alerts (real time habit, daily rhythm). Budgets by team/app with threshold alerts and daily rollups. Owners get the nudge early; Finance gets fewer end-of-month plot twists.
- Blended vs. unblended analytics. Reconcile consolidated billing to true unit economics. Toggling views answers “why did unit rate move?” in a single screen.
- Open exports & APIs. Push findings to your warehouse, send reports to email/Slack, and keep the audit trail tidy for reviews.
Everything is a configuration item: AWS Account, Azure Subscription, GCP Project, Application__c, Service__c, Environment__c, EC2 Instance, Azure VM, GCE Instance, EBS Volume, BigQuery Dataset, S3 Bucket, etc.
That means your questions map to real objects: “Show idle disks in prod,” “Who owns this spike in data transfer?” “Which service missed the tag policy this sprint?” The CMDB keeps those answers consistent across scopes — and your meetings shorter.
If you want the one-liner for your deck: Cloudaware is one of those FinOps tools that turns messy multi-cloud into clean, defensible cost management — by wiring billing data to the CMDB so resources, services, and environments are never divorced from their owners.
Pricing
Cloudaware starts where real FinOps work actually starts: the CMDB. No CMDB, no meaningful cost story. The platform counts what you truly run — servers, services, databases, disks, tags, owners — and pins every dollar to a specific thing with a specific purpose. From there, pricing stays simple and predictable.
Here’s the breakdown, clean and human:
- CMDB is the base. It’s billed by configuration item at about $0.008 per CI per month.
- Example that fits most teams: 100 cloud servers ≈ $400/month for CMDB.
- Want the cost features on top? Add the FinOps module at 20% of your CMDB spend.
- In this example: $400 CMDB + $80 FinOps = $480/month total.
That’s it. No mystery multipliers. No percentage skim from your invoices. Your costs grow with the footprint you actually manage, not with somebody else’s forecast.
A few lines to keep in your back pocket:
- This model fits teams searching for FinOps solutions that don’t punish growth.
- It keeps cloud cost tied to reality instead of vibes.
- If you run workloads on AWS, it maps cleanly into the CMDB and rolls up without gymnastics.
- The structure supports strong cost management without turning every report into a rebuild.
- Pricing scales with real CI usage, not with dramatic billing swings.
- Finance sees transparent spending with no gotchas at month-end.
Story-wise, the CMDB lays the tracks; the FinOps module drives the train. You pay for the rails you own and the engine you actually run. The result is a calm, infrastructure-aware way to control costs — crisp math, clear ownership, and zero surprise invoices.
Pros and cons
Here’s a quick, no-fluff readout from real users.
✅ Multi-cloud visibility (AWS/Azure/GCP). “One of the standout features of Cloudaware is its ability to handle multiple cloud providers… Cloudaware seamlessly integrates with each of them.” Source.
✅ Unified view + cost optimization levers. “It provides a unified view of all cloud resources… and cost optimization recommendations like rightsizing and eliminating idle resources.” G2
✅ Asset management & integration strengths. “Asset management, ease of integration, and endpoint security.” G2
🤔 Learning curve. “Some users may find the initial learning curve to be steep.”
G2 review.
🤔 Price sensitivity for smaller orgs. “Pricing can be high for small businesses or startups.” G2.
🤔 UI friction. “Cloudaware user interface can be overwhelming.” G2.
Ternary FinOps
Capterra: ★★★★★ 4.9/5
Trial days: 60
Best for: Enterprise FinOps organizations and MSPs running multi-cloud
Ternary pulls in AWS, Azure, and Google Cloud, adds Alibaba and Oracle Cloud Infrastructure when you need them, and gives everyone one fluent place to talk about money and action. Finance sees the numbers they trust; engineering sees the changes they can ship; your FinOps organization gets the shared rhythm it’s been chasing.
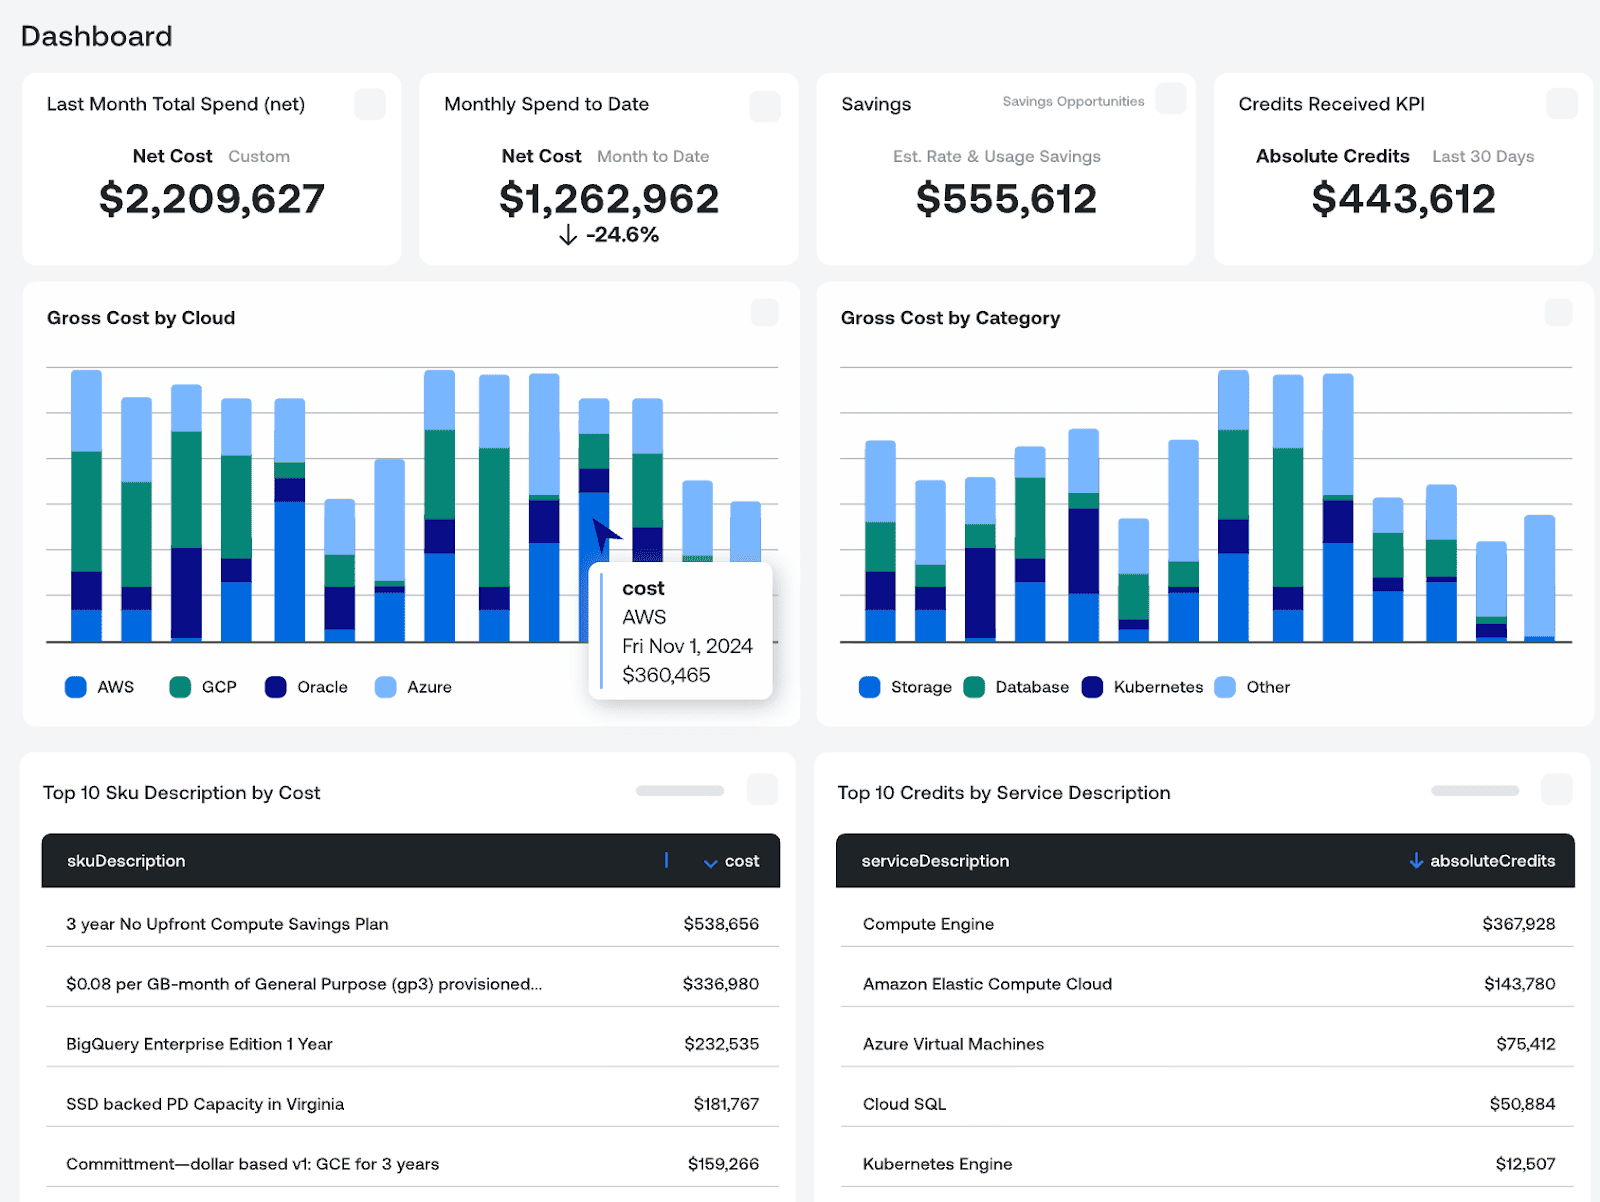
Under the hood, Ternary is built on BigQuery. That matters because the queries stay snappy when your datasets are measured in weeks of invoices, not rows in a spreadsheet. Think of dimensions like AWS Account, Azure Subscription, GCP Project, Kubernetes Cluster, Namespace, and Pod — all filterable, all exportable, all ready for review.
Cloud FinOps features
- Multi-cloud ingest & normalization. Pull billing from the big three and extend to Alibaba and OCI. Standardize fields so one filter slices the same services across providers, and group spend by owners or products without duct tape.
- Anomaly detection with case workflow. ML models learn your patterns and flag outliers; a bi-directional Jira integration opens a case with evidence and keeps remediation in the engineering lane. The same flow covers Kubernetes spikes down to pod level for faster triage.
- Forecasting you can defend. An ML engine projects future cost by the business dimensions you choose, with confidence levels for planning season and variance tracking for month-end reviews. Use it to set realistic budgets and catch drift early.
- Cost allocation rules. Create chargeback or showback with static splits or dynamic weighting. Map shared lines to the right owners, and reallocate when labels or tags lag behind reality. Your spreadsheets can finally take the day off.
- Kubernetes visibility. Expose cluster economics from cluster → namespace → pod. Agentless collection means less friction, and over-requests or idle containers get numbers you can act on. That’s where real cost management begins.
- Reporting that speaks FOCUS. Dashboards and scoped views line up with the FinOps community’s FOCUS spec, so your monthly deck answers “where did the money go?” without translation. Real-time insights keep the conversation current.
- Deployment options for every gate. Run it as SaaS or go self-hosted in your own GCP project for tighter data boundaries, with updates handled on a SaaS-like cadence. Regulated teams breathe easier.
If you’re shortlisting the best FinOps tools, Ternary earns the spot by giving you one surface for forecasts, anomalies, allocation, and action — with architecture that holds up when the bill does heavy lifting.
It drives cost optimization in the same place you make decisions, which is the only way those decisions stick. And when you need to prove the math, the data model and reports make that part refreshingly boring.
Pricing
Think of their model like a runway for cloud costs: straight, well-lit, and sized to your traffic. The subscription is a fixed annual fee set by your annual cloud spending tier — no overage surprises, no “gotchas,” and available via marketplace so procurement isn’t a saga. Pricing publicly starts at $25,000/year.
What forms the price (the model):
- Fixed-fee subscription tied to annual cloud spend (not per server).
- No overage charges; no professional services fees — the number you sign is the number you book.
- Marketplace availability for straightforward buying motions.
From Ternary’s pricing page and its AWS Marketplace listing (12-month contracts):
Starting price: $25,000/year (Small — covers up to $1M/year in multicloud spend).
Final price (top published tier): $175,000/year (Extra Large). The marketplace also shows $67,500/year (Medium, up to $3M/year) and $100,000/year (Large, up to $5M/year).
A quick example for a 500-server estate: Ternary prices to usage and annual spend, not server count — so map your tier to what finance already tracks:
- If those ~500 servers land around $1M/year across AWS, Azure, and GCP → $25,000/year (Small).
- If you’re closer to $3M/year → $67,500/year (Medium).
- If you’re near $5M/year → $100,000/year (Large).
- If you scale beyond those bands, → $175,000/year (Extra Large).
Businesses get a single, predictable line item for cost management while you work the levers that actually move cloud costs. Your team can plan, your CFO can forecast, and you can get back to rightsizing and unit economics instead of decoding a pricing puzzle.
Pros and cons
✅ Proven cost impact. “Our cloud infrastructure costs were 17% of non-GAAP revenue. We reduced that down to 8% of non-GAAP revenue with Ternary.” Ternary
✅ True multi-cloud visibility. “Now, I have a single source of truth for all my cloud spending across Google Cloud, Azure, and AWS.” Ternary
✅ Partner-level collaboration. “The Ternary team has been great to work with… they act as an extension of our team.” Ternary
❌ Platform maturity. “It’s worked out with Ternary pretty well so far — they’re new, but they work with their customers to modify the platform.” Reddit
❌ Optimization depth uncertainty. “Ternary may be a good choice since they are built for GCP, but I’m not sure about their optimization.” Reddit
❌ Audit-log usage gap. “It cannot detect nor tries to what assets are being used through audit logging.” Reddit
Read also: FinOps Automation That Works: Tips & Tools from Pros
Opentext FinOps
G2: ★★★★☆ 4.2/5
Trial days: 90
Best for: Mid-market & enterprise teams with formal IT/FinOps governance.
OpenText’s FinOps platform (HCMX FinOps Express) pulls that into one operating rhythm: clean visibility, accountable allocation, and guardrails your engineers won’t fight. It’s used by enterprises that want to spend transparency, budget controls, and optimization signals in the same workflow — including OpenText themselves, who cite multi-million-dollar savings after adopting it.
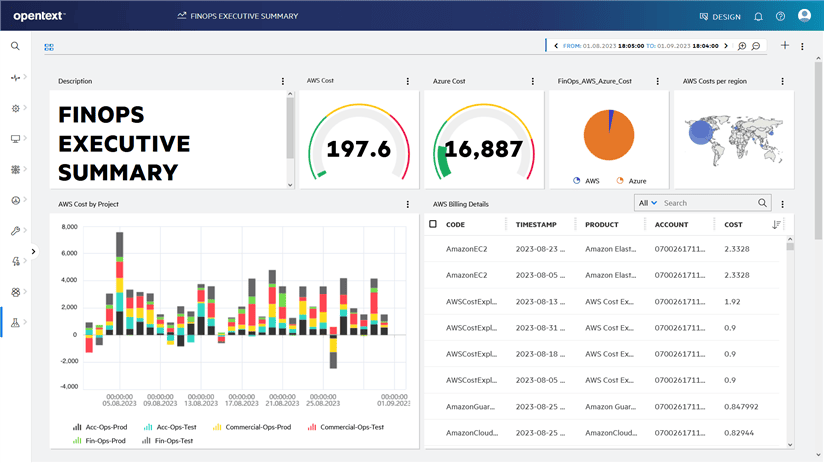
Among cloud FinOps companies, OpenText leans into multicloud coverage and cost governance. Out of the box you get spend views across providers, allocation by tags and business rules, and role-based dashboards that match how teams ship software.
FinOps tools
- Multicloud spend transparency & allocation. Break down cloud cost by account, team, project, or cost center. Showback reports and filters let you allocate spend with tags and custom rules, so owners see exactly what they control.
- Budgets, cost limits & alerts. Set thresholds for a spend group and auto-trigger notifications or actions when drift starts. Budget guardrails keep variance from turning into a finance fire drill.
- Waste detection & right-size recommendations. Flag idle or oversized resources, shine a light on over-provisioned services, and surface next-best actions your engineers can actually take. AI-powered recommendations and “spend spike” views accelerate triage.
- Commitment & rate optimization. Improve plan coverage and utilization; teams report outcomes like maximizing AWS Savings Plans once visibility lands in the same place as actions.
- Finance-ready showback/chargeback. Detailed billing reports with granular filters and tag compliance checks make showback routine — no spreadsheet archaeology required.
- Tag governance & remediation. Detect non-compliant tags, kick off corrective actions, and keep allocation intact even when labels lag behind reality.
- GreenOps dashboard. Track cost and carbon side-by-side so sustainability and savings share the same playbook.
- SaaS delivery with enterprise hardening. Delivered as SaaS, with architecture and docs that spell out how the service runs and scales in production. Your ops and security teams get the detail they ask for.
Why folks slot this into their “popular FinOps tools for cloud cost management” shortlist: it lines up with the way you already work. Allocate by the CIs you know, set limits where budgets live, and push optimization straight into the weekly agenda. When leadership asks, “Where did the money go?” you’ve got one screen that answers — and a queue of actions to pull it back.
Pricing
OpenText prices HCMX FinOps Express like a runway fee for your actual usage: the subscription is tied to your managed annual cloud spending, not per-server headcount. That works for businesses that want a clean line item while they work the real management levers in AWS and Azure.
Model (what forms the price)
- A base subscription that covers up to $5M in managed annual cloud spend.
- Then simple add-ons for each additional $1M of managed annual cloud spend.
Plans:
- Starting price: $3,308.07/month for “up to $5M managed annual cloud spend.”
- Final price (published): there’s no capped max listed; pricing scales by $508.94/month per extra $1M of managed annual cloud spend beyond the base. (Example of a “large” scenario below.)
Quick example for a 500-server estate: Server count isn’t the metric here, so map it to annual cloud spend:
- If those 500 servers land around $4–5M/year, you’re within the base tier → $3,308.07/month (~$39,696.84/year).
- If your footprint trends closer to $8M/year, that’s base + 3 add-ons → $3,308.07 + (3 × $508.94) = $4,834.89/month (~£58,018.68/year).
Use it wherever you shortlist the best cloud FinOps tools: simple math, predictable budgeting, and a price that moves in step with the cloud you actually fly.
Pros and cons
✅ Visual insights & planning. “HCMX FinOps Express transformed our approach with exceptional visualizations — insights invaluable for cloud rate optimization and scenario planning.” OpenText
✅ Unified view & savings. “Provided a unified view across multiple cloud providers… we achieved a substantial 35% reduction in spend.” OpenText
✅ Integrations & APIs. “Friendly graphical environment, Open public APIs, and OOTB integrations with Jenkins, Chef, and Puppet.” G2
❌ UI friction. “The interface of existing scorecards should be improved.” G2
❌ Setup complexity. “Highly complex to set up correctly… requires a lot of expertise.” G2
❌ Learning curve. “A lack of knowledge of the complete process could make it difficult to comprehend.” G2
Read also: 7 Best Cost Allocation Software 2025: Tools, Features & Pricing
VMware FinOps CloudHealth
Capterra: ★★★★★ 4.9/5
Trial days: 14
Best for: Mid-market & enterprise teams; strong fit for MSPs.
CloudHealth lands: a FinOps platform that pulls billing and asset data from AWS, Azure, and Google Cloud, normalizes it, and lines it up with the way your teams ship. Finance sees totals they can book; engineering sees levers they can pull; your FinOps organization gets one shared rhythm for decisions.
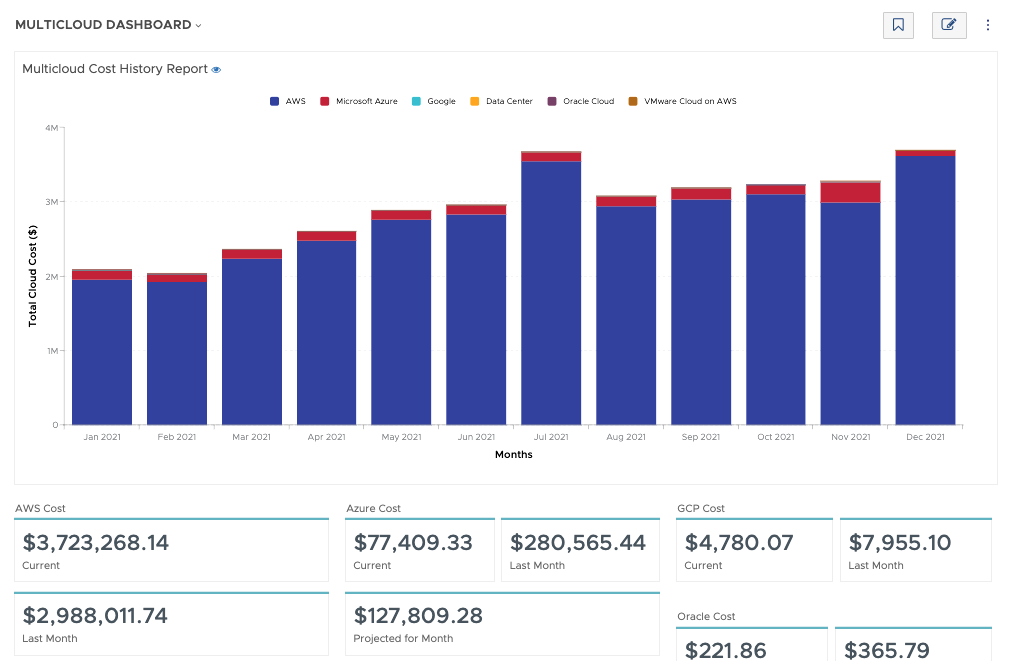
Enterprises and MSPs lean on it for budgeting, showback/chargeback, forecasting, and optimization reviews — all driven by multicloud ingest and asset modeling that treats things like AWS Accounts, Azure Subscriptions, and GCP Projects as first-class objects. When policy guardrails kick in, budget alerts and optimization findings show up before the invoice does.
Features
- Multicloud ingest & normalization. Bring in AWS, Azure, and Google Cloud billing and assets; analyze in a single currency and pivot by account, project, or team. Think reports that stitch services and resources across providers without rebuilds.
- Cost allocation & chargeback. Attribute cost by tag keys, business rules, or org structure. Push showback views that mirror ownership so teams see exactly what they control.
- Budget management & forecasting. Set budgets by scope, track variance, and forecast forward so finance and engineering review the same numbers each month. Budget policies can notify owners as thresholds are approached.
- Rightsizing & waste reduction. Identify idle or oversized instances, volumes, and databases; apply custom rightsizing recommendations tuned to your workload patterns to reduce drift without breaking SLAs.
- Anomaly detection. Detect spend spikes and outliers, then route context to the right owner so investigation starts with evidence, not guesswork. Useful for noisy environments where changes land daily.
- Policies & guardrails. Define rules that watch budgets, commitment coverage, and off-hours usage; trigger actions and notifications when something moves off course. That keeps reviews proactive instead of reactive.
- Dashboards & cost reports. Custom dashboards for execs and engineers, plus a library of cost reports that track trends, allocations, and unit economics — all exportable for month-end.
- APIs & automation. Use the Assets API to query cloud objects and related attributes, wire data to your warehouse, or embed spend signals in internal workflows.
- Smart Summary. A consolidated view that explains what changed in your cost management picture so you can brief leadership with clarity instead of screenshots.
Why teams shortlist it among the best rated FinOps tools: it gives one place to plan, allocate, and optimize with multicloud reality baked in. It also pairs nicely with a broader FinOps toolkit when you want deeper automation around remediations or ticketing.
CloudHealth brings your services, resources, and business lenses onto the same page — so the conversation moves from “what happened?” to “what do we change this week?” with fewer detours and cleaner outcomes.
Pricing
Picture CloudHealth like a clean toll road for cloud costs: you pay a known rate for a known lane, and when your traffic grows, the booth tells you exactly what the next lane costs. On the public record, CloudHealth (VMware Tanzu CloudHealth) sells annual subscriptions in the AWS Marketplace by monthly AWS spend tier.
The published 12-month plans start at $45,000/year for “up to $150K of monthly AWS spend,” step to $90,000/year for “up to $300K,” and top out publicly at $150,000/year for “up to $500K.” If you run above your contracted threshold, the listing notes additional fees above that monthly amount.
Some industry write-ups also document that, beyond the base allowance, overages are billed as a percentage of excess spending (historically cited as ~3% or $0.03 per dollar over the cap). Use this as directional color when modeling scenarios with Finance.
Annual subscription tied to a contracted monthly AWS spend tier; additional fees if monthly usage exceeds the tier’s cap; sold via Marketplace for straightforward management and procurement.
Starting price (published): $45,000/year (12-month contract; “CH150K” tier).
Final price (highest published tier): $150,000/year (12-month contract; “CH500K” tier). Larger tiers typically require a private offer.
CloudHealth prices to monthly AWS spend, not server count, so map your estate to a tier. If your ~500 servers average around $300K/month on AWS, you’d sit in the CH300K band at $90,000/year under a standard 12-month listing.
If you’re closer to $500K/month, budget $150,000/year (CH500K). Same math applies if you later centralize tags and expand views to Azure — the Marketplace contract is still anchored to the AWS tier you purchase.
Where this fits on your shortlist of multi cloud FinOps tools: predictable bookends for Finance, operational headroom for teams, and a pricing model you can plug straight into scenario spreadsheets without mystery multipliers.
Pros and cons
✅ Granular visibility & dashboards. “Cloudhealth helps us understand the cloud costs deep drill down to each service […] visualize the data using dashboards.” Amazon Web Services.
✅ Reports that surface trends. “I really like the reports CloudHealth generates great visual for the trends in cloud usage and helps identify where the costs might be excessive.” G2
✅ Optimization & budgeting support. “Helps my organization to optimize costs and to keep budgeting proposals and documentation organized.” G2
❌ Recommendations feel scattered. “The platform is lacking a central view of cost savings recommendations makes it a bit harder to understand how to save on costs.” Amazon Web Services, Inc.
❌ UI performance hiccups. “The screen periodically lags for a few seconds and has stalled on me for a while.” G2
❌ Needs deeper resource-level drill-downs. “The platform need to be able to drill down more into cost of individual resources instead of just at the account level.” G2
Read also: FinOps Personas: Roles, RACI, and KPIs for Real Teams
CloudZero
Capterra: ★★★★★ 4.9/5
Trial days: 14
Best for: Mid-market & enterprise teams, especially engineering-led SaaS/FinOps orgs.
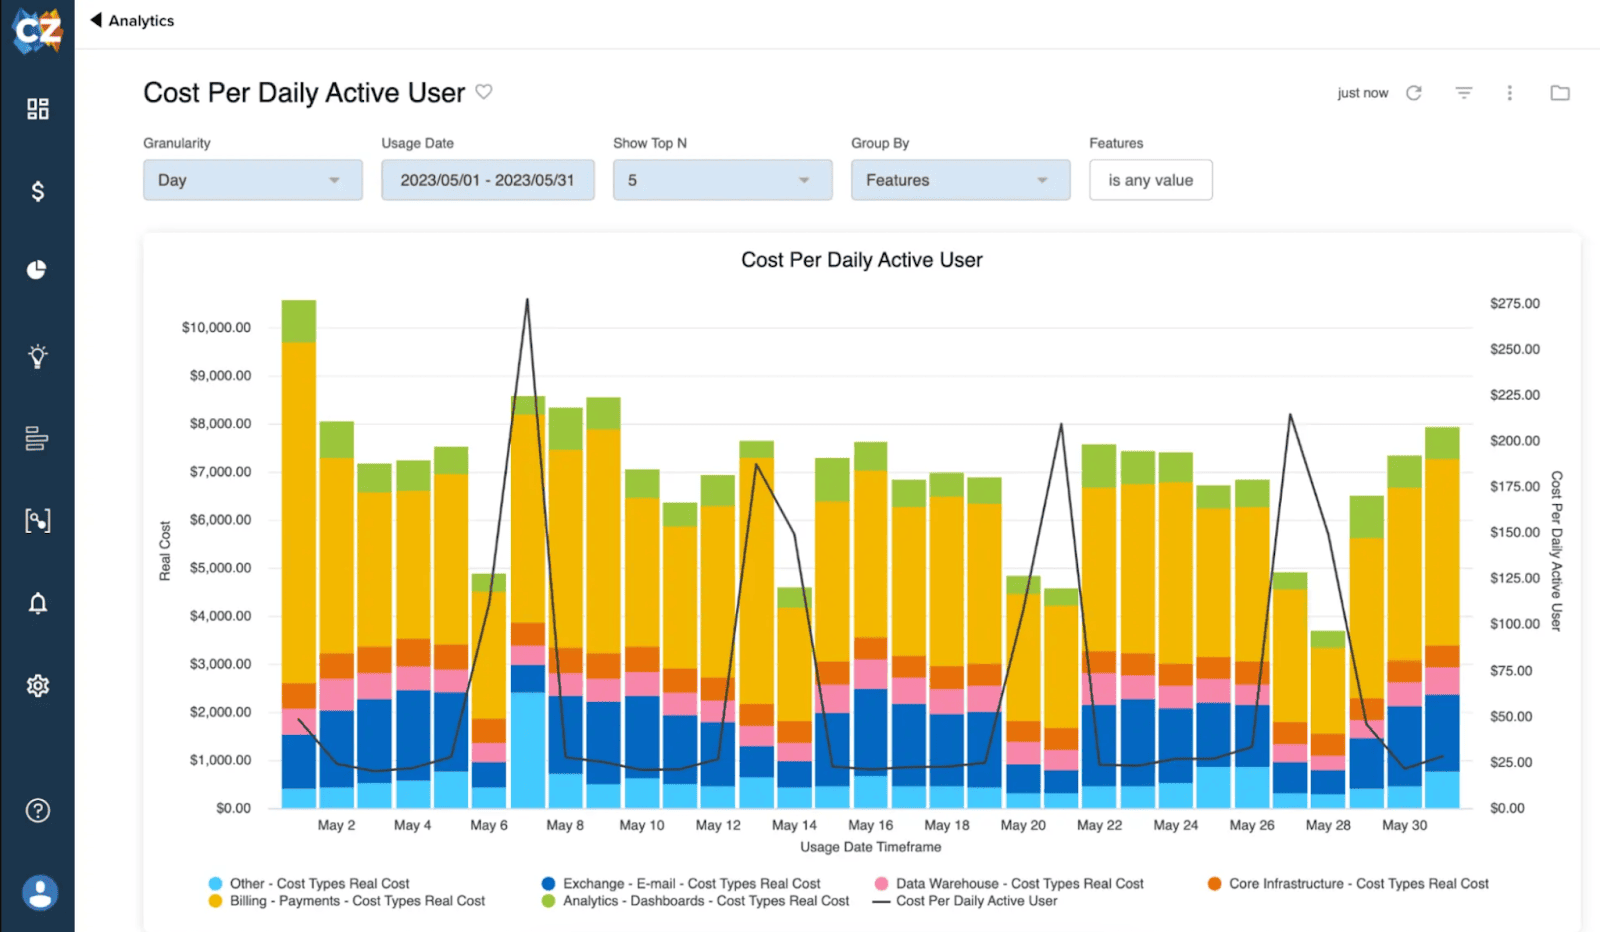
You’ve got cloud spend spread across AWS, Azure, and Google Cloud, plus a trail of SaaS and data platforms. CloudZero pulls that into one FinOps platform where finance sees clean numbers and engineering sees the levers to pull this week.
Teams use it to stitch billing data, map it to products, and turn findings into owned actions — the rhythm that separates successful cloud FinOps companies from the rest.
CloudZero shows up in customer stories from Drift, Skyscanner, Upstart, and others — the pattern is consistent: clearer allocations, faster savings, and unit economics you can present without twenty caveats. Think “we saved $2.4M” and “we found enough savings in two weeks to pay for the license.”
Features
- AnyCost ingest (multi-source). Bring in AWS, Azure, GCP, Kubernetes, Snowflake, Datadog, OpenAI — normalize it all in a common model. That’s your single pane for services and line items you normally chase across tabs.
- CostFormation (as-code dimensions). Define business-aware groupings in YAML — product, feature, team — and route each charge to an owner. Filters stay fast, and cost allocation becomes repeatable instead of artisanal.
- Unit cost analytics. Track per-customer, per-transaction, or per-feature economics so spend trends turn into decisions you can defend. Great for roadmap and pricing calls where cost needs a business denominator.
- Kubernetes allocation. Break clusters into resources you can act on: Cluster → Namespace → Workload/Pod, with hourly granularity. Support includes EKS, AKS, and GKE; there’s an agent/Helm path where needed and native reads where providers expose allocation.
- Anomaly detection + notifications. ML baselines watch hourly spend and ping the owning team in Slack when spikes appear. Your “what changed?” thread starts with context, not screenshots.
- Optimize workflow. Triage savings opportunities, open Jira tasks, and track realized outcomes over time — the muscle that turns ideas into durable cost optimization.
- Explorer, budgets, and analytics. Explore by account, subscription, project, or custom dimension. Set budgets, monitor variance, and keep a clean audit trail for cost management and monthly rollups.
AWS Account, Azure Subscription, GCP Project, Kubernetes Cluster, Namespace, Pod — plus the business dimensions you define in CostFormation. That’s how noisy environments become clean views you can act on in one pass.
When you’re shortlisting cloud FinOps tools, put CloudZero in the “run this in production” pile: one surface for ingestion, allocation, anomaly response, and engineering follow-through. It slots neatly into the stack you already use, plays well with Slack and Jira, and gives FinOps vendors a bar to clear if they want a seat at your table.
Pricing
CloudZero prices like a runway for what you actually ship. Their subscription is tiered and predictable, with a model built to scale as your team’s management rhythm matures. That’s not marketing fluff — it’s the way they describe it publicly.
Contracted subscription + metered overages tied to monthly AWS spend. You pick a contract; if monthly usage runs past the level you contracted, there’s an additional per-$1K charge the same month. It’s sold in AWS Marketplace, so procurement stays clean.
Starting price: $19 per $1,000 of monthly AWS spend (On-Demand listing).
Final price (max published): $170,000 per month for the Custom platform listing (1-month contract shown on Marketplace).
Quick example for a 500+ server estate: Server count isn’t the lever; spend is. If your ~500 servers average about $300K/month on AWS, the On-Demand math is: 300 (thousand-dollar units) × $19 = $5,700/month.
If you later expand visibility to Azure projects, the subscription you purchased through AWS Marketplace still anchors to your AWS-tiered contract while you analyze multi-cloud spending in the platform.
Bottom line: a model you can forecast — anchored to what you actually run — so Finance sees clean guardrails and Engineering keeps moving. When you’re lining up approvals, that’s the handle you want on usage, cost signals, and the narrative behind them.
Pros and cons
✅ Multi-cloud visibility. “The ability to quickly integrate multiple Cloud Providers into the tool gives an amazing single pane of glass.” G2
✅ Kubernetes cost accuracy. “CloudZero’s Kubernetes cost reporting is accurate and very helpful to show engineering teams their share of cluster costs.” G2
✅ Actionable breakdowns & recommendations. “CloudZero provides a detailed cost breakup of our cloud resources & offers practical recommendations for saving expenditures.” Amazon Web Services, Inc.
❌ Reporting depth/alert handling. “They can improve around some of their reporting functionality… and the management of those alerts.” G2
❌ Forecasting limitations. “The forecasting side of the tool is pretty limited.” G2
❌ Dashboard filters. “Improving its Dashboard with more filter options would be great for us.”
Amazon Web Services, Inc.
Vega FinOps
Capterra: ★★★★★ 4.0/5
Trial days: no public self-serve trial listed
Best for: Mid-market & enterprise teams; also a strong fit for MSPs.
Monday budget review, three tabs, one goal. Vega sits in the middle like a calm air-traffic controller. It ingests AWS, Azure, GCP — and even OCI — normalizes the data, and hands your FinOps team a single operating surface for decisions that stick.
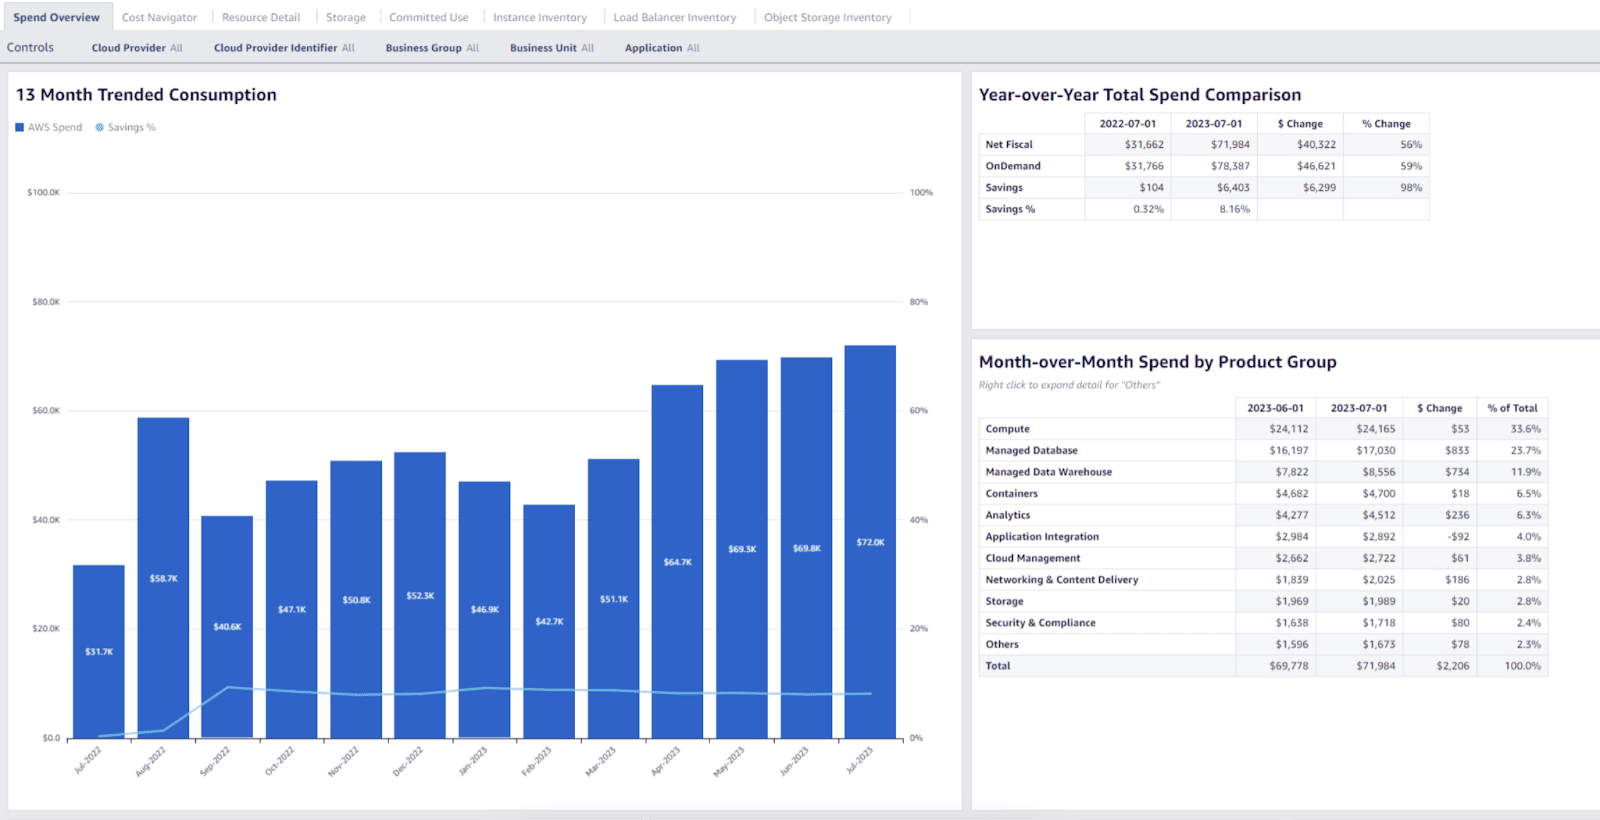
The value is simple: trustworthy numbers, fast investigative paths, and actions you can schedule, not just suggest. Vega is a FinOps Foundation premier member, and you’ll see it in customer stories and partnerships (Mission Cloud, Trovata), plus exec-level sessions where teams use it to run reviews, forecasts, and savings programs.
Vega organizes cloud spend across providers into a consistent model — no context switching. Finance, engineering, and product leaders use it for allocation, forecasting, anomaly review, and scheduled remediation, all aligned to FinOps phases: Inform, Optimize, Operate.
Vega features your reviews will actually touch
- Unified multi-cloud model. A normalized dataset across AWS, Azure, and GCP, with OCI supported in the Resources inventory. That gives you one taxonomy for services, tags, discounts, and committed use across scopes.
- Navigator (your daily “cost explorer” workspace). Prebuilt dashboards: Spend Overview, Cost Navigator, Resource Detail, Storage, Committed Use, Instance and LB inventories. Filter by account, tag, product, or team; export for month-end. This is where most “what changed?” threads begin.
- Cost allocation without tag gaps. Rules handle shared lines, credits, and refunds; name-pattern matching fills in when tags misbehave. You keep accountability even while you fix hygiene.
- Forecasting. Two paths: historical growth models (3/6/12-month lookbacks with sensible limiters) or manual inputs, plus deployment-age segmentation to see how young vs. mature resources shape the curve. Useful for quarterly targets and capacity plans.
- Anomaly detection. Baselines over the last 7 days, tunable thresholds, and smart flags to cut noise (e.g., exclude CUD purchases and taxes). Hourly usage polling merges with provider bills; daily alerts keep owners in the loop.
- Recommendations + analyst review. Rightsizing, purchase timing, scheduling, and storage hygiene generated by the engine, then curated by Vega FinOps SMEs before they hit your queue — so the list reads like a plan, not a firehose.
- Enterprise Scheduler (turn off waste on purpose). Define start/stop run windows; sequence priority groups; add “disable between” exceptions. Works across EC2, RDS, Redshift, Azure VMs, GCP Instances and SQL-Instances — with role-aware controls. That’s real cost optimization baked into ops.
- Tag Compliance dashboard. Find untagged or malformed assets fast; fix at the source; rerun allocation with confidence.
- Dashboard Author (optional add-on). Build custom analyses on top of the curated multi-cloud dataset; publish to stakeholders; keep one version of truth.
- Data ingestion guardrails. Clear prerequisites and cadence: AWS CUR with hourly collection; GCP Cloud Resource Manager + BigQuery APIs enabled; daily provider cost merges with hourly metrics. Trustworthy inputs make cost management boring in the best way.
- MSP primitives when you need them. Billing reconciliation, re-rating, and alerting patterns that make multi-tenant reporting cleaner.
AWS Account, Azure Subscription, GCP Project, OCI Account, plus EC2 Instance, RDS Instance/Cluster, Redshift Cluster, Azure VM, GCP Instance, SQL-Instance — with Business Groupings and Spaces for how you model teams and environments.
You start with a clean ledger of cloud costs, move through allocation and forecasts, and end with scheduled actions that reduce the next invoice.
Customers like Trovata call out quick savings after organizing workloads and parking non-prod on a schedule; Mission Cloud leans on Vega to drive AWS savings programs with clients. That’s the week-over-week rhythm your FinOps platform should enable.
If you want, I can frame a “Mon/Wed/Fri” runbook using Navigator → Anomalies → Scheduler, so the team knows exactly what to open first and what to ship next.
Pricing
Vega prices like a runway for your operations: you pick how many cloud accounts you want covered, and the subscription follows that footprint. It’s clear, account-based, and published in AWS Marketplace — which keeps procurement sane and your FinOps toolkit predictable.
Pricing model — what forms the number
- Account-based tiers. Published bundles for 1, 5, and 10 accounts, with “Reporting,” “Optimization,” and full “Enterprise” access options.
- Contract length. 1-, 12-, 24-, and 36-month terms shown; longer terms can discount.
- Overage dimension. An “additional usage” line item exists for consumption beyond your contract’s included quantity.
Starting price: $100/month (Reporting, 1 account).
Max published price: $1,700/month (Enterprise, 10 accounts). Larger bundles typically go via private offer.
Servers aren’t what Vega bills on; cloud cost control here is tied to accounts. If those ~500 servers are spread across 10 accounts, you’d model the Enterprise 10 Accts tier at $1,700/month.
If you collapse them into 5 accounts, you’d look at $950/month for that bundle. Either way, the price is anchored to the account count you operate, while your FinOps work targets efficiency and cost allocation across teams.
Why this resonates with teams evaluating FinOps providers: you get a published, account-based subscription you can forecast, while your analysts keep pushing savings and accountability across resources, services, and org units.
That’s the blend of price clarity and operational leverage your toolkit needs when spending spikes or usage shifts mid-quarter — and it scales as your footprint evolves.
Pros and cons
✅ Proven time savings. “Now, we can do live screen shares and instantly drill into cost data, cutting our prep time nearly in half.” cdn.sanity.io
✅ Tangible ROI on AWS. “Vega’s ROI is real and tangible — you can save money on your AWS bill from the very start.” cdn.sanity.io
✅ True multi-cloud visibility. “Having a single pane of glass, looking at all the clouds for a customer is very helpful.” vegacloud.io
❌ Concern about reseller setups. “They will lock you out of Billing services… and replace it with CloudCheckr or Vega or some other tool.” Reddit
❌ Perception to align on. “Looks like a managed service running on one of the main CSP’s?” Reddit
❌ DIY preference in some teams. “IMO, the most overlooked tool on AWS is QuickSight.” Reddit
Finout
G2: ★★★★☆ 4.5/5
Trial days: depends on your request
Best for: eCommerce, cybersecurity, data platforms, fintech, transportation, observability mid-market & enterprise teams
Finout steps in as the calm voice in your headset: one place where every cloud dollar lands with context, owned by a real team, and tied to a plan you can ship this week. It ingests AWS, Azure, and GCP billing at the source — CUR, Cost Management exports, and BigQuery billing — so your views line up with how you actually run workloads.
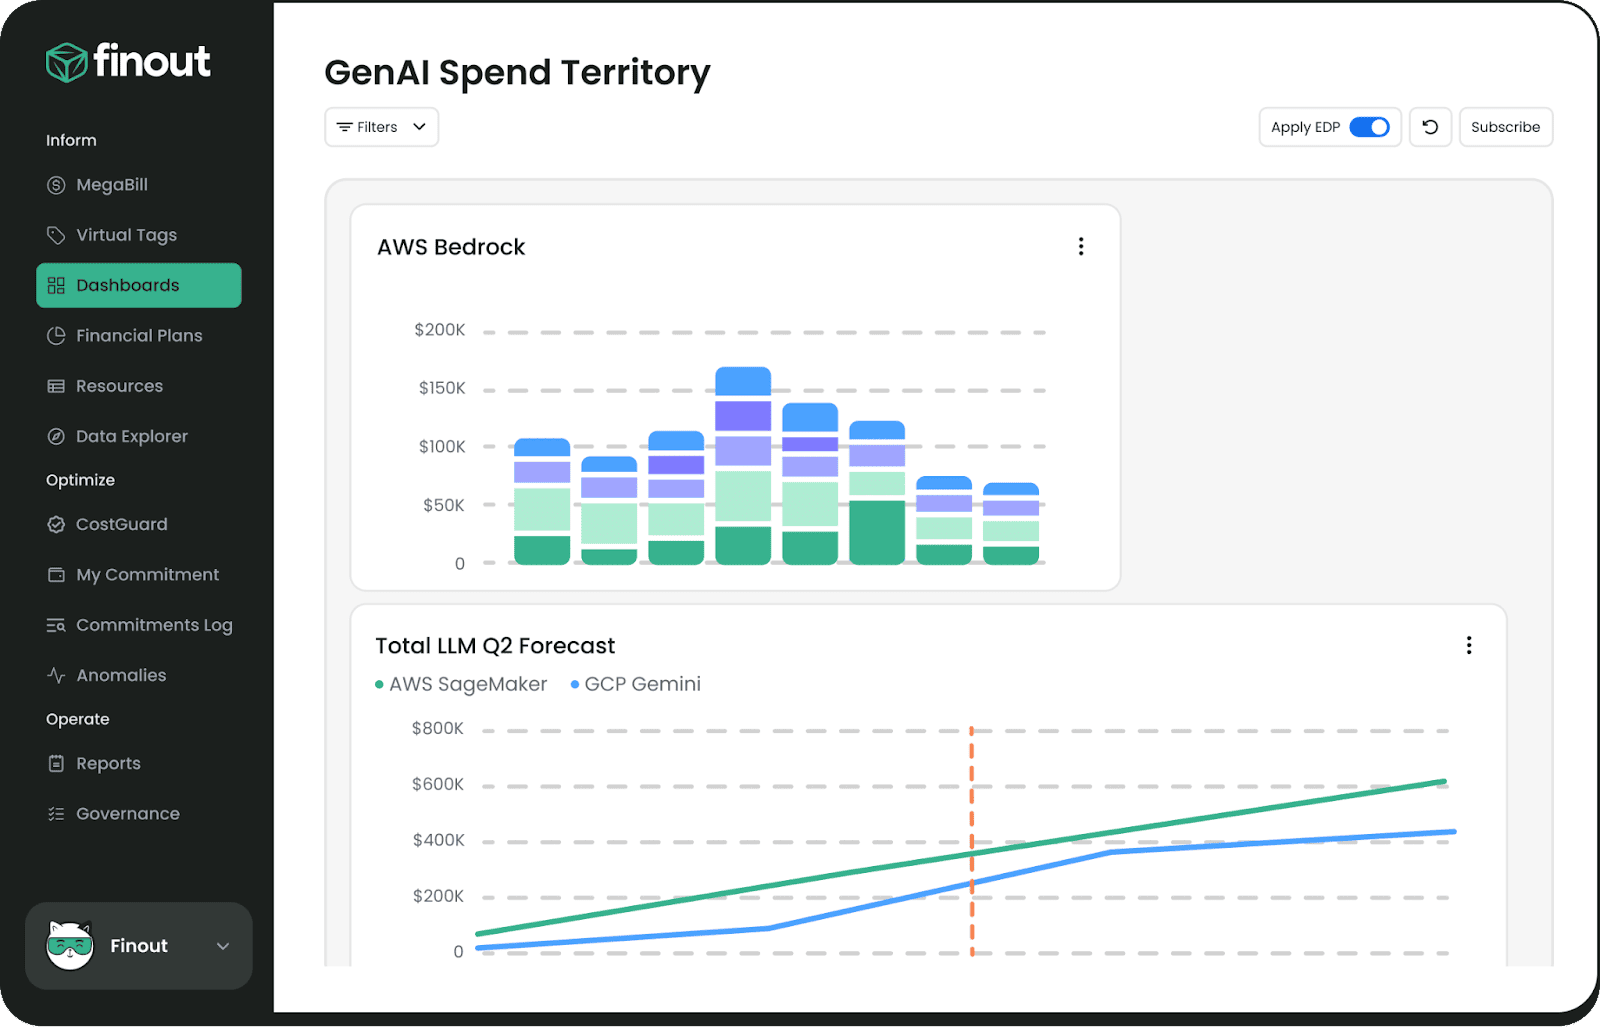
Teams like Wiz, Forter, PandaDoc, and Choice Hotels show up in the customer stories — the common thread is simple: faster answers, cleaner allocations, and a running list of actions for the next sprint. That’s the heartbeat your FinOps tools should support.
Features
- Multi-cloud ingest & normalization. Hook up AWS CUR, Azure Exports, and GCP Billing Export to BigQuery; analyze by AWS Account, Azure Subscription, and GCP Project without rebuilding spreadsheets. The data model captures usage natively, so pivots by product or owner stay snappy.
- MegaBill — one ledger to run the room. Finout fuses all provider lines into a unified dataset, so anomalies and trends live in one narrative instead of twelve screenshots. That’s the surface where “what changed?” starts and ends.
- Granular cost allocation. Map shared lines with rules, virtual tags, and re-allocation logic until every dollar rolls to an owner, a team, or a customer. Showback becomes a button, not a project.
- Unit economics — cost per customer, feature, or event. Drop a widget on the dashboard to track KPIs like cost per user, per GB, or per request, then wire those signals into planning. That’s where roadmaps get smarter.
- Kubernetes allocation down to Pod. Break clusters into resources you can act on: Cluster → Namespace → Pod, with pod costs derived from hourly CPU/memory/network and node pricing. The result is container economics you can trust.
- Anomaly detection with surgical context. Baselines and granular alerts flag spend spikes by team, app, or environments — the investigation opens on evidence, not hunches.
- Observability & SaaS hookups. Pull Datadog billing into the same view and track those charges per product or team, right next to cloud line items. It keeps your services and spend in the same conversation.
- Optimization assists where it matters. Feed operational metrics into CostGuard to size and schedule safely, especially in GCP estates where monitoring drives better recommendations. Your queue becomes a plan.
- GCP and Azure specialization, without extra lift. Agentless GCP onboarding and Azure tagging flows keep the motion light while you tune governance. That’s momentum you can sustain.
If you need a one-liner for your deck: Finout gives your cost management a single storyline — from ingest to allocation to action — so the conversation moves from discovery to decision without leaving the room.
Pricing
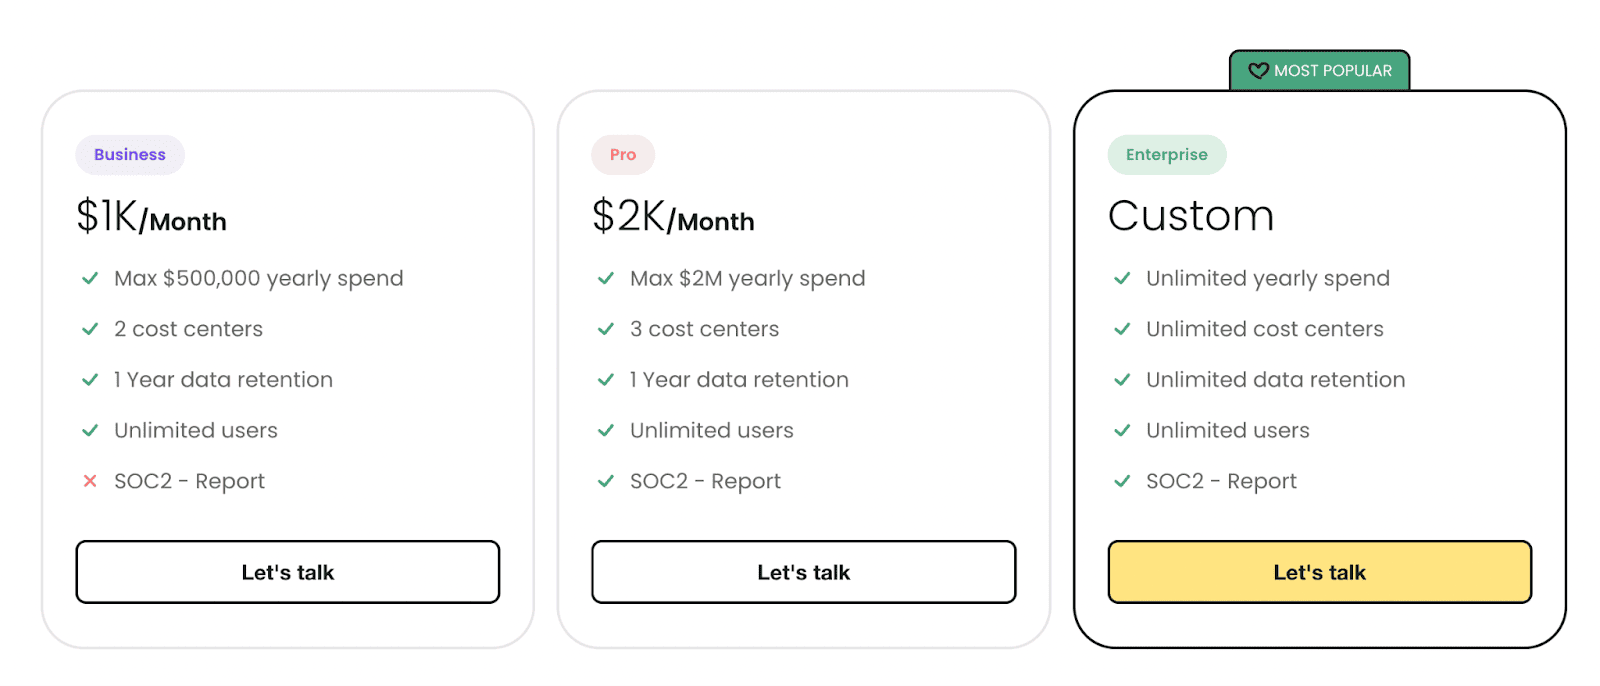
Think of Finout’s pricing works based on the following logic: one subscription, tied to how much spend you manage, and no seat math. Publicly, Finout shows three bands — Business, Pro, and Enterprise — with the price anchored to your annual cloud spend ceiling. This is a straight monthly subscription; no feature gates.
Model (what forms the price):
- Spend-based tiers: Business and Pro list explicit “max yearly spend” caps; Enterprise is custom for larger estates.
- Flat monthly fee: Unlimited users; you’re paying for the platform as your FinOps tool, not per seat.
Starting price: $1,000/month (Business — up to $500K yearly cloud spend).
Highest publicly listed price: $2,000/month (Pro — up to $2M yearly cloud spend). Enterprise is custom above that.
Quick example — a company with ~500 servers: Server count isn’t the lever here; your contract maps to annual spend. If those ~500 servers net around $1.2M/year across providers, you land in Pro at $2,000/month. If your footprint is >$2M/year, you move into Enterprise (custom quote).
Finance gets a predictable line item; your ops rhythm stays focused on allocation and savings, not licensing gymnastics.
If you want, I can turn this into a one-pager with scenarios at $800K / $1.2M / $3M so the team can pick the right tier during planning.
Pros and cons
✅ Fast to implement & easy to adopt. “Finout is very quick and easy to implement.” Amazon Web Services, Inc.
✅ Strong visibility for decision-making. “Finout… provides clear insights into cost fluctuations and helps identify optimization opportunities.” G2
✅ Flexible allocation models. “Its virtual tagging system provides a level of flexibility and customization.” G2
❌ Query-building UX can feel heavy. “Building queries can be somewhat cumbersome… due to the extensive lists of filters.” G2
❌ Learning curve for advanced use. “It will require a more capable set of hands to understand how to get everything out of this tool.” G2
❌ Rightsizing accuracy feedback. “The CostGuard Rightsizing feature could be more accurate.” G2
Read also: Top 13 Cloud Monitoring Tools Review - Pros/Cons, Features & Price
Zesty FinOps
G2: ★★★★★ 4.8/5
Trial days: not listed public
Best for: SaaS, IT services, marketing/advertising, and financial services mid-market & enterprise teams
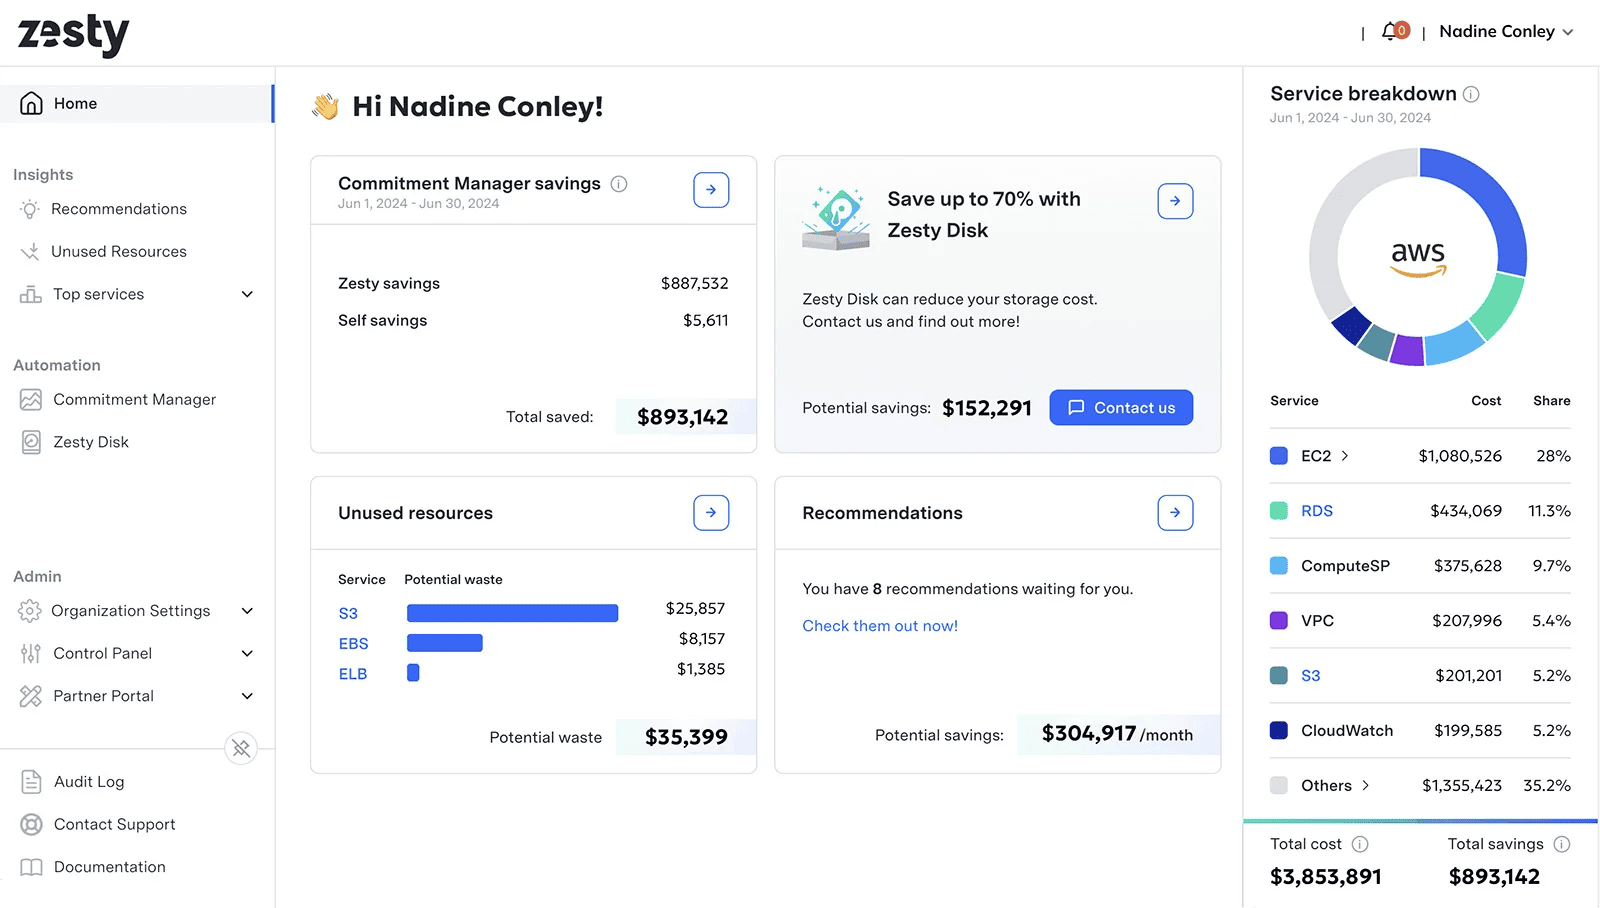
Zesty slots in as automation-first FinOps software: it plugs into AWS for deep storage and commitment control, and hugs your Kubernetes estates with autoscaling that keeps performance steady while trimming waste.
Teams use it to shave noisy edges off EC2, right-size EBS in real time, and keep clusters lean without babysitting. Customers call out quick, hands-off savings and faster reviews — think Armis, Yotpo, and Siemens sharing “we cut 40–53% and stopped worrying about this row of the bill.”
Features
- Commitment Manager (EC2 & RDS). Set guardrails and let Zesty tune Savings Plans and RI coverage continuously. It buys, renews, or lets micro-commitments expire so coverage flexes with demand, keeping utilization high across resources like EC2 Instance and RDS Instance/Cluster. Your portfolio adjusts as usage moves, not weeks later.
- Zesty Disk (EBS autoscaling). An AI autoscaler that expands and shrinks EBS Volume capacity at run time. No manual re-provisioning, no chronic over-allocation. It right-sizes gp2/gp3 to match workload curves and can claw back significant storage cost without touching SLAs.
- Kompass for Kubernetes (compute + storage). Headroom Reduction trims idle nodes; Pod Rightsizing tunes CPU/RAM; PV Autoscaling keeps persistent volumes honest; Spot Protection hot-swaps nodes in under 30 seconds. Works across environments you already run — Kubernetes Cluster → Namespace → Pod — so cluster economics finally line up with reality.
- Insights & recommendations. A daily panel that feels like a focused cost explorer: it ties spend changes to owners, services, and tags so your “what changed?” thread starts with evidence.
- Partner-grade outcomes. MSPs roll Zesty into managed FinOps programs to deliver measurable savings on cloud costs — proof points in the hundreds of thousands within the first year aren’t rare.
What you’ll actually filter by in reviews: AWS Account, Kubernetes Cluster, Namespace, Pod, EC2 Instance, EBS Volume, RDS Instance — plus standard labels and tags. That makes allocations and follow-ups stick to real objects, not just graphs.
Why it earns a spot when you shortlist cloud FinOps tools: Automation handles the mechanical parts of cost management while you steer priorities. Storage scales itself. Commitments breathe with demand. Clusters keep SLAs steady while waste falls away. When your cloud provider throws a curveball mid-sprint, the runbooks still hold.
If you’re curating leading FinOps solutions, put Zesty in the “operate every week” pile. It reads the bill, trims the fat, and lets your FinOps vendor energy focus on roadmap and cost allocation instead of chasing spreadsheets. That’s how a platform becomes part of the team — not another tab to maintain.
Pricing
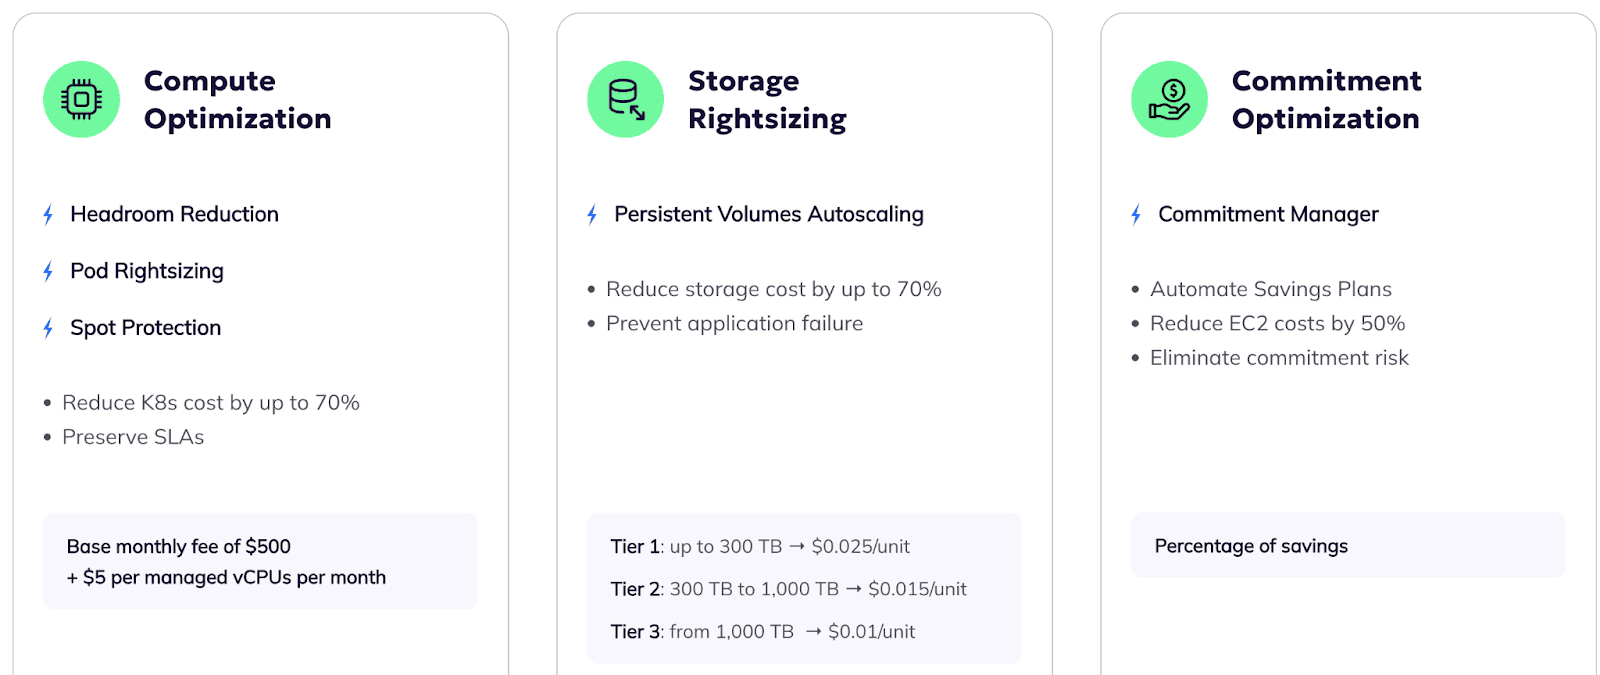
Think of Zesty’s pricing like air-traffic control for cloud costs: one tower, two runways. Runway A is compute; runway B is storage. You pay a small base to keep the lights on, then metered fees for the capacity Zesty actively manages after optimization. That’s the whole model.
The model — what forms the price:
Base platform fee (monthly): $500. Compute optimization then bills $5 per managed vCPU per month.
Storage rightsizing (EBS): tiered per-GB per month on AWS Marketplace — up to 300 TB: $0.025/GB-mo, 300–1,000 TB: $0.015/GB-mo, >1,000 TB: $0.01/GB-mo.
Bookends (the two numbers you asked for)
- Starting price: $500/month (base fee). Compute adds $5 per managed vCPU/month; storage adds the per-GB tier price.
- Final price: no public cap — it scales with managed vCPUs and GBs. At very high volumes, the lowest published storage rate is $0.01/GB-mo (>1,000 TB). (Enterprise totals are usage-dependent.)
Assume these 500 instances average 2 vCPUs each and you enroll 200 TB of EBS in Zesty Disk:
- Platform base: $500/month.
- Compute: 1,000 vCPUs × $5 = $5,000/month.
- Storage: 200,000 GB × $0.025 = $5,000/month.
Estimated monthly total: $10,500.
That’s a clean figure you can forecast across cloud environments and fold into AWS cost management models; if your real usage or enrolled storage shifts, the math adjusts linearly. (Zesty publishes these exact unit rates; you plug in your own vCPUs and GBs.)
Bottom line for Finance: predictable unit economics you can tie to spending scenarios. And if the roadmap later pulls some workloads toward Azure, your planning sheet still works — the same structure, the same levers, just different inputs on the unit lines.
Pros and cons
Quick pulse from real users — different angles, straight from public reviews.
✅ Hands-off automation with real savings. “Zesty reduces our monthly bill… between 85% and 95% of our environment is covered by reserved instances, and each of these agreements reduces the spend by 30% to 35%.” Amazon Web Services, Inc.
✅ Set-up is fast; then it runs itself. “Zesty is about as ‘set it and forget it’ as you can get. Onboarding was quick, and has required zero work after the initial configuration.”
Amazon Web Services, Inc.
✅ Clear visibility and measurable impact. “The setup was quick, and on the dashboard we can see the savings and the resources that are over-provisioned… we reduced our AWS compute bill by an additional 40%.” G2
❌ Renewal flow can feel clunky. “Renewal method — could be simpler, maybe limited by AWS Marketplace.” Amazon Web Services, Inc.
❌ Wants more granular dashboards. “Their dashboards could use a bit more work, providing more granular views…” G2
❌ Ramp-up period before full effect. “I understand the ramp up period… it would be nice if we could crank up a manual dial for workload parts we know will be consistent.” Amazon Web Services, Inc.
Flexera FinOps
Capterra: ★★★★☆ 4.2/5
Trial days: 60
Best for: Public sector, SaaS/tech, automotive/industrial, education mid-market & enterprise teams; strong fit for MSPs
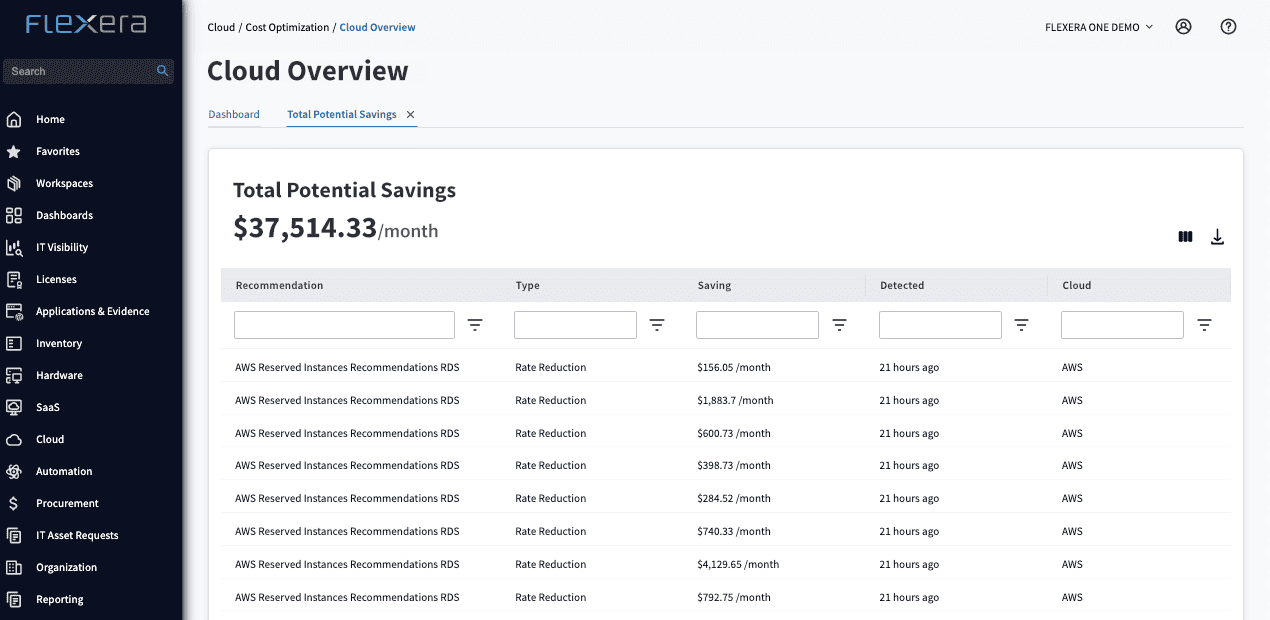
Flexera One brings billing and asset telemetry from AWS, Microsoft Azure, and Google Cloud into a single operating surface your team can actually run. Finance sees accountable numbers. Engineering gets a queue of actions. Product owners finally understand where their features eat budget. Think of it as a steady cadence for spend decisions and technical follow-through.
Who runs on it? Enterprises with layered estates, managed service partners, and platform teams that want budget guardrails wired to real infra signals. They use it to plan, allocate, and remediate — all on the same screen, with audit trails your controller will sign.
Features
- Multicloud ingest & normalization. Pulls native billing from AWS CUR, Azure Cost Management exports, and GCP Billing into one model. You filter by AWS Account, Azure Subscription, GCP Project, Resource Group, and drill to EC2 Instance, Azure VM, GCE Instance, S3 Bucket, RDS Instance. One query, one story.
- Allocation rules & business mapping. Route ambiguous spend to owners with tag keys, hierarchies, and weighting. Showback becomes routine, and chargeback is a switch you flip rather than a side project. That’s durable cost allocation with receipts.
- Budgets, thresholds, and variance tracking. Create monthly and quarterly targets per team or product. When drift starts, the right person gets pinged with context — account, project, and the exact line items behind the delta.
- Anomaly detection & “what changed?” trails. Daily baselines flag outliers by account, tag scope, or product. Triage opens on the evidence: top movers, new services, and the ops changes that caused them.
- Rightsizing & waste reduction. Safe recommendations across compute, databases, and storage. Tune by CPU, memory, I/O, and latency budgets so no one breaks SLAs while trimming.
- Commitment planning & coverage. Track Reserved Instances and Savings Plans utilization and coverage. Plan purchases by application cadence and renewal windows, not just rolling averages.
- Policies & guardrails. Enforce key tags before deploy, watch off-hours patterns, and cap risky growth. When a rule fires, owners get a ticket with the CI list attached.
- Dashboards & executive narratives. Prebuilt visuals for trends, unit economics, and allocation rollups. It’s the closest thing to a living cost explorer you can put in front of leadership.
- APIs, exports, and workflow hooks. Pipe curated datasets to your warehouse. Trigger Jira or ServiceNow actions from findings. Keep a clean ledger from alert to remediation.
Flexera acts like a disciplined FinOps company that speaks both finance and engineering without translation. It’s built for teams who live in pipelines and audits, and it keeps cloud math glued to real objects you can change.
Among seasoned FinOps companies, this rhythm is what keeps the monthly close calm and the roadmap funded — because every dollar has an owner and every action has a trail.
Use it when you need predictable cost signals, a steady cost management loop, and a platform that turns “who owns this?” into a one-click filter across your estate. And when someone asks about rising cloud costs, you’ll have the screenshot, the allocation, and the fix — all before the next meeting.
Pricing
Picture Flexera One like a ticket booth for the FinOps tool you actually run: the price is tied to the cloud usage you manage across your cloud environments, with clear bookends you can model in a spreadsheet.
Annual subscription anchored to managed spend. The AWS Marketplace lists a 12-month contract at $50,000/year covering up to $1,000,000 of yearly cloud spend; if you exceed that allowance, there’s an overage fee ($0.01 per unit per contract terms).
Enterprise anchor on Azure Marketplace. Flexera’s Cloud Cost Optimization “starting at” price is $260,000 for one year — a published bar for larger footprints that typically go via private offer.
Starting price: $50,000/year (AWS listing; up to $1M/year under management).
Highest published anchor: $260,000/year (Azure Marketplace “Starting at”). Larger tiers price privately.
Here is an example of how much would it cost for a company with ~500 servers: Server count isn’t the lever; spending is. If those 500 servers net around $1M/year across AWS and Azure, you’d model the AWS listing band at $50,000/year.
If your managed spend pushes beyond that, plan for an enterprise quote in the Azure-style range (that “starting at” $260,000/year anchor) or factor in the AWS overage clause during management reviews.
Pros and Cons
✅ Granular visibility for allocation and control. “Tag Dimensions, Rule-Based Dimensions, and Showback/Chargeback… The Cost Explorer enables effective usage tracking, while Budget Alerts and AI/ML-based Forecasting support proactive cost control.” G2
✅ Estate-wide picture that reduces guesswork. “Gives a complete picture of all your IT assets… hardware, software, or cloud resources, everything is tracked in one place.” G2
✅ Identifies savings opportunities that matter. “Businesses can identify underutilized subscriptions and optimize their spending… clients have realized substantial cost savings.” G2
❌ Learning curve for new teams. “There’s a learning curve… new users may find the interface somewhat overwhelming at first.” G2
❌ Initial setup can be complex. “The platform’s initial setup can be quite complex, requiring a lot of time and effort to configure.” G2
❌ UI and forecasting range could be better. “There’s room for improvement in the UI and forecast range.”
IBM FinOps tool - Cloudability
Capterra: ★★★★☆ 4.3/5
Trial days: 14–28
Best for: Financial services & insurance, healthcare, and media/sports mid-market & enterprise teams.
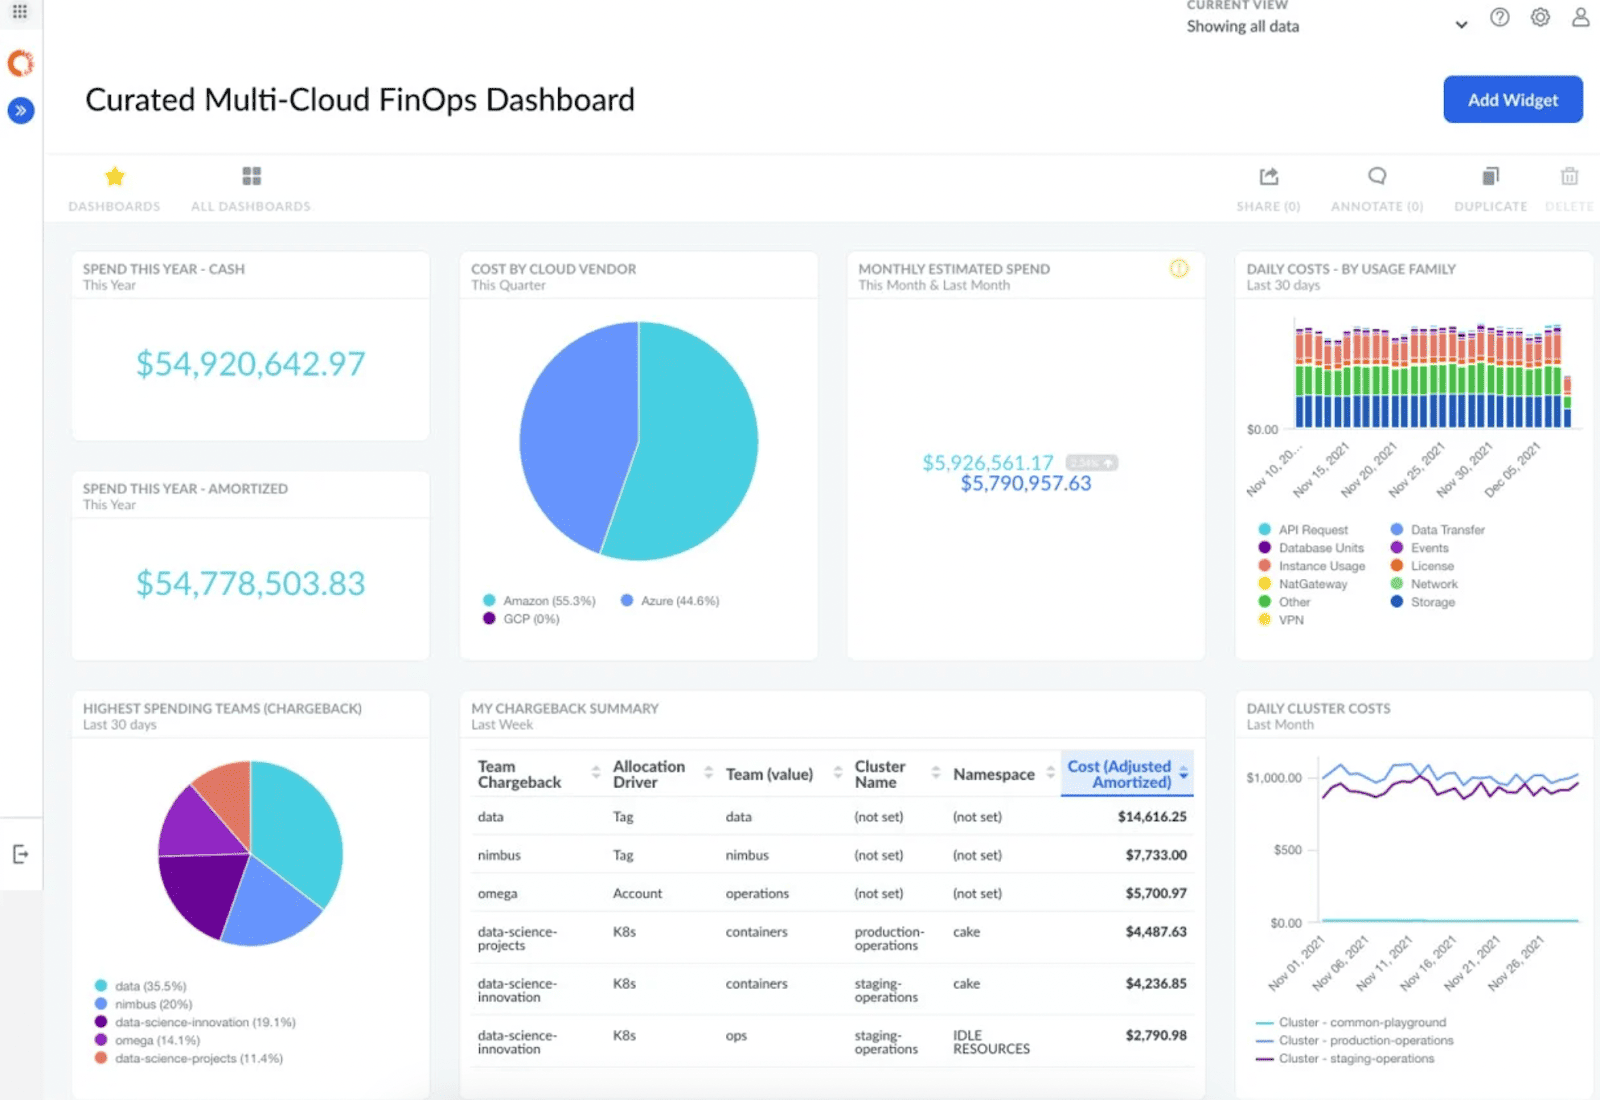
Your bill lands from every cloud provider, and the story has to make sense fast. IBM Cloudability pulls AWS, Azure, and Google Cloud into one narrative you can brief in minutes: what moved, who owns it, and what changes next. It’s the same platform now flying under “FinOps IBM,” with product updates rolling through the Apptio + IBM pipeline so your reviews stay current.
Here’s the value in plain language: cleaner allocation, earlier anomaly calls, and a weekly rhythm where engineering, finance, and ops solve the same problem from the same facts. That keeps cloud costs predictable and decisions defensible.
Features
- Business Mapping (rules that mirror your org). Define a taxonomy once and let rules route every line item to product, team, or BU — even when tags misbehave. Think “AWS Account → Product → Team” with showback/chargeback baked in and integrations for downstream workflows. This is where cost gets an owner.
- True Cost Explorer (investigation without spreadsheets). Visual pivots over spend and usage so you can correlate spikes with dimensions like app, region, or service in seconds. It’s the workspace you open when leadership asks “what changed yesterday?”
- Anomaly Detection (signals, not noise). Automated baselines flag unusual spending and notify owners by view and threshold. You land on evidence — the services, accounts, and tags behind the move — instead of trawling exports.
- Commitment Manager + Savings Automation (discounts with guardrails). Portfolio views for RIs and Savings Plans, hourly coverage/utilization, and recommendations sized to real workloads. The goal: higher effective coverage without blind spots.
- Container Cost Allocation (K8s you can act on). Map cluster economics from Kubernetes Cluster → Namespace → Workload/Pod, correlating node metrics with billing so containerized services stop looking opaque. Useful in noisy environments with constant deploys.
- Dashboards, Scorecards, and governance helpers. Role-based views, KPI scorecards, and tagging visibility keep management conversations tight and repeatable. Schedule reports and keep your audit trail tidy.
What you’ll actually filter by in reviews: AWS Account, Azure Subscription, GCP Project, plus cluster objects like Namespace and Pod — the handles that turn a spike into a ticket and a ticket into a fix. That’s practical cost management with receipts.
Cloudability gives your team one motion for allocation, forecasting, anomalies, and discounts — so each cloud cost question ends with a real owner and a next step. Among seasoned FinOps vendors, that’s the rhythm that keeps the roadmap funded and the on-call quiet.
Pricing
Think of Cloudability (IBM) as a meter that follows the cloud you actually run. Contracts are tied to the public bill you put under management across your cloud environments — not a seat count. In IBM’s government-listed pricing, the annual SaaS fee is aligned to your “Monitored Costs” (your managed public cloud spend) and ranges from 0.75% to 3% depending on total spend and term. That’s the core model.
- Starting price: $30,000/year for up to $1M in annual cloud spend under management (AWS Marketplace plan code observed as CLDY1MYEAR).
- Highest publicly listed tier: $132,480/year for up to $6M in annual cloud spend (CLDY6MYEAR). Larger footprints typically go private-offer.
What forms the price:
- Spend-based subscription: fee calculated as a percentage of “Monitored Costs” (defined to include provider charges, discounts, support, taxes; before credits). Range: 0.75%–3%.
- Tiered packages on Marketplace: fixed annual amounts mapped to spend bands (e.g., $1M / $3M / $6M) with overage charges if you exceed your contracted allowance.
Here is an example of how much would it cost for a company with ~500 servers:
- If those 500 servers equal $3M/year across AWS/Azure, you’d model $76,680/year (the “up to $3M” plan).
- If you’re closer to ~$6M/year, budget $132,480/year. Same contract, same forecasting logic — just a different band.
That gives you a tidy line item for Budgets and a story you can defend when leadership asks, “What are we paying for the FinOps providers piece?” The math ties directly to the cloud you actually use, and the bookends above let you model scenarios without guesswork.
Pros and cons
Here’s a quick, real-world pulse on Cloudability — straight from users who’ve lived with it.
✅ Visibility that drives action. “…showing how much stuff costs and where we can save.” G2
✅ Clear breakdowns and multi-cloud coverage. “It gives us the clear charge summary of cloud resources cost… We can handle multiple cloud using the single platform.” G2
✅ Reports and trends your execs will read. “Cloudability makes it easy to find the data you’re looking for… the place I go to find interesting trends.” Amazon Web Services, Inc.
❌ Busy UI at times. “Sometimes it feels a little too full of information… reports could be a little easier to change.” G2
❌ Heavy reliance on tagging. “There is heavy dependability on structured tagging.” G2
❌ Cost/onboarding friction for smaller teams. “Pricing is not suitable for startups. A little bit challenging for new user for initial setup.” G2
Read also: How to use FinOps framework: Top 10 mistakes & their fix
Datadog FinOps
Capterra: ★★★★☆ 4.4/5
Trial days: 14
Best for: SaaS/tech & digital platforms (e.g., Kevel/adtech), plus regulated sectors needing unified observability + cost views.
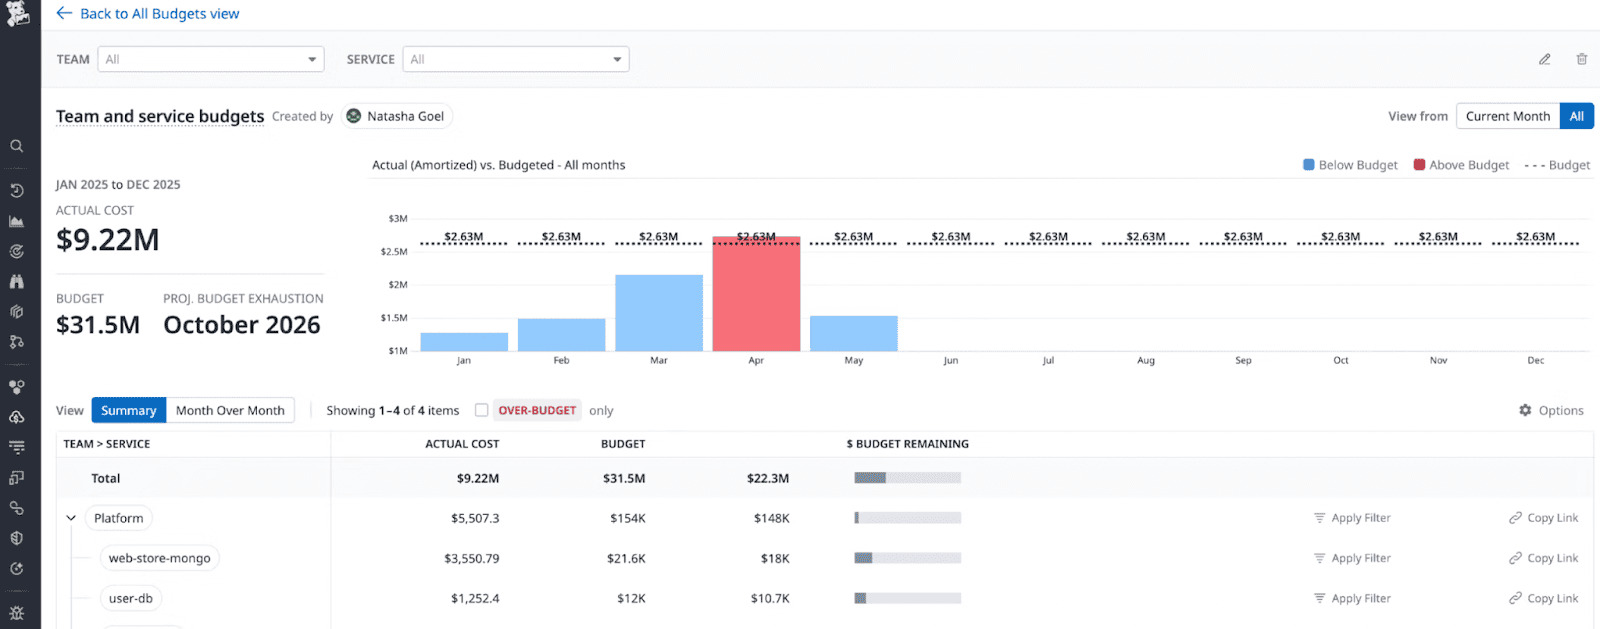
Picture your Monday budget huddle. Tabs open, Slack chirping, leadership wants one sentence on what moved and why. Datadog steps in as that calm, shared console: observability and spend living on the same canvas so engineers and finance talk about the same signals, in the same language, in the same minute.
It ingests AWS, Azure, and GCP billing and lines it up next to runtime telemetry, which means you’re making cost calls with performance context, not blind guesses. That’s the magic when a FinOps brain and an SRE heartbeat share one pulse.
Teams use it to keep cloud decisions tight: allocate cleanly, spot spikes early, and turn findings into owned actions without leaving the dashboard. If your shortlist includes the best FinOps apps for tracking cloud spending, Datadog’s Cloud Cost Management gives you a workbench where trends, anomalies, and unit economics live side by side.
Features:
- Multi-cloud ingest with observability context. Hook up AWS CUR, Azure Cost Management exports, and GCP Billing; analyze by AWS Account, Azure Subscription, GCP Project, and correlate with runtime metrics on the Cloud Costs Summary page. Flip from dollars to latency or error rate in a click when a change lands.
- Cost monitors and anomaly detection. Create cost monitors that alert when the run-rate or forecast crosses a guardrail; combine with anomaly detection to triage unexpected spending by service, tag, and account — straight to the owner. Budgets stop being a month-end surprise.
- Kubernetes & container cost allocation. Break cluster economics to Kubernetes Cluster → Namespace → Pod → Service and track amortized CPU and memory with first-class metrics (for example,
AWS.cost.amortized.cpu.allocated). Idle allocation and over-requests show up as dollars you can actually fix. - Unit economics & total cost of service. Model cost per customer, request, build, or GB and graph it next to golden signals so product calls land on facts. Use Datadog’s out-of-the-box views to analyze the total cost of each service and alert when unit rates drift.
- Cloud cost recommendations for AWS. Surface cleanup and rightsizing opportunities across legacy services, unused resources, and over-provisioned workloads; queue the safe wins in your weekly ops workflow.
- FOCUS dashboards for multi-cloud + SaaS. Out-of-the-box cost overview and change views that aggregate cloud costs and key shifts across providers and vendors — a fast way to brief the room before you dive deeper.
- FinOps workflows, end to end. CCM adds allocation, investigation, and optimization flows so your cost management cadence lives where engineers already watch health and usage. Less context-switching, faster follow-through.
What you actually filter by in practice: AWS Account, Azure Subscription, GCP Project, Kubernetes Cluster, Namespace, Pod, and tagged application or team scopes — the handles that turn a “why did this jump?” into a ticket with an owner and a fix you can ship this sprint. That’s how optimizing cloud costs becomes muscle memory, not a monthly fire drill. docs.datadoghq.com
Datadog gives FinOps software the same first-class seat as observability, so every cloud cost call happens with performance, reliability, and ownership in frame — and your next step is already in the runbook.
Pricing
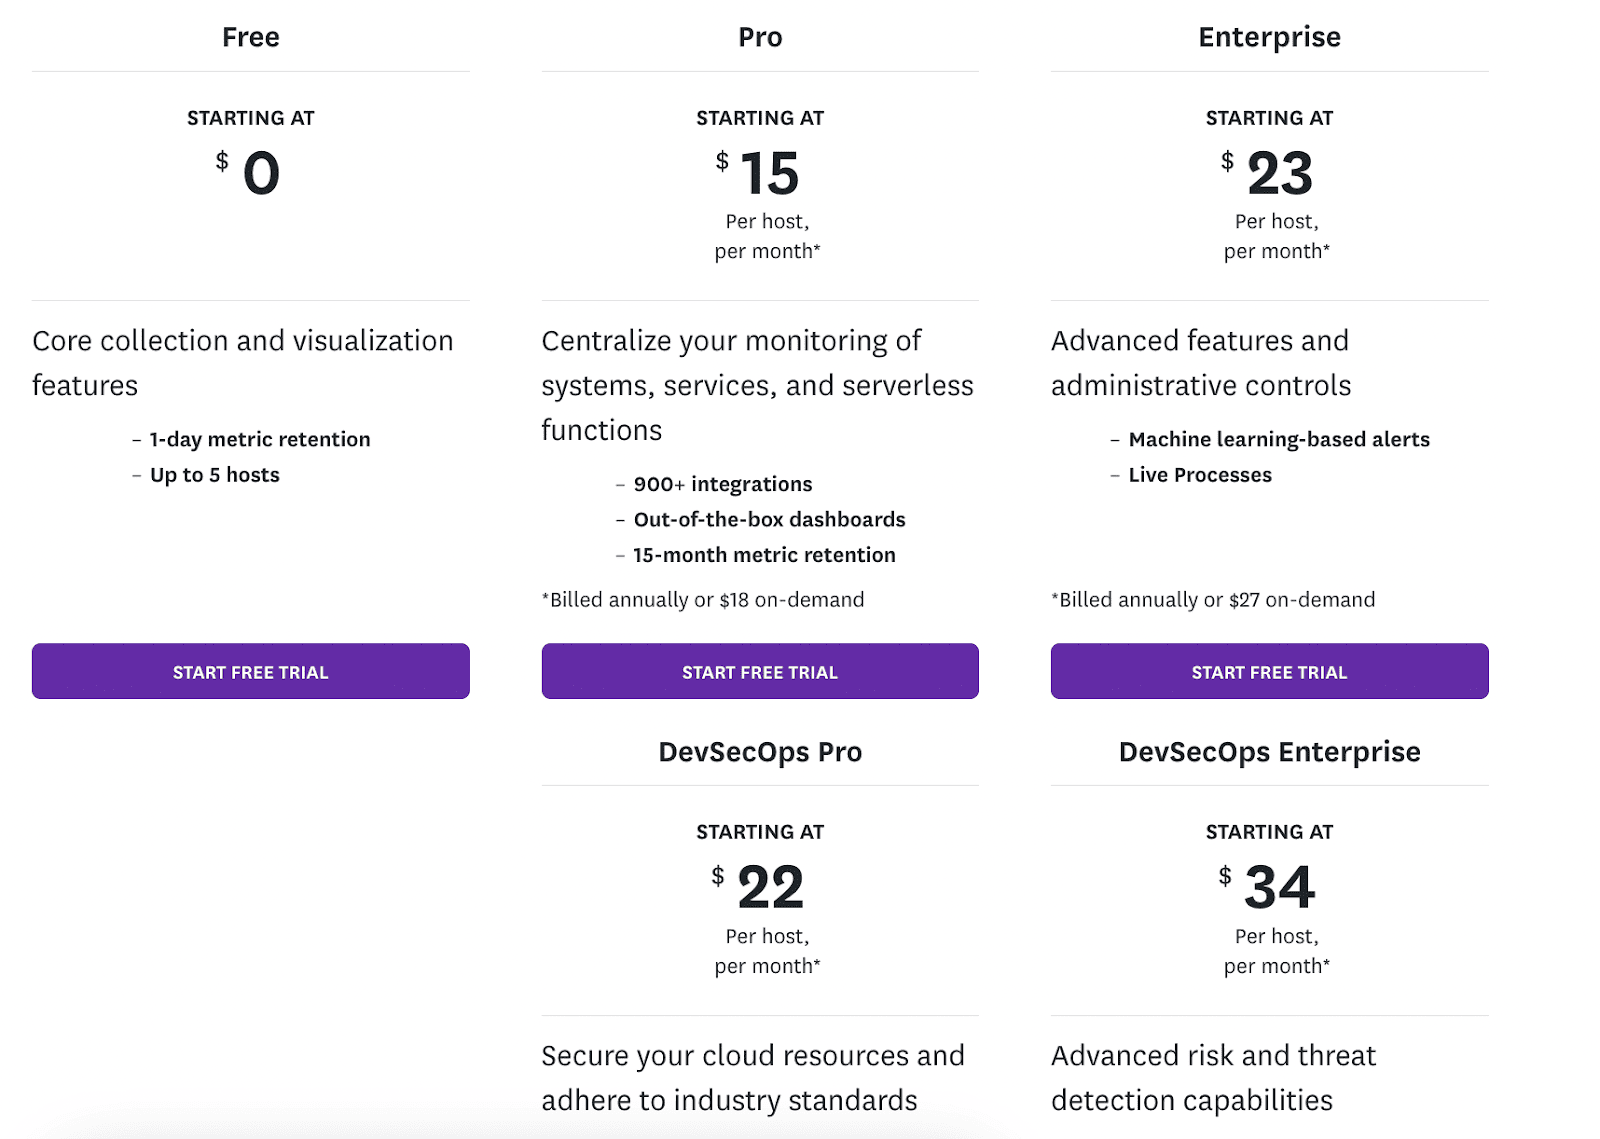
Datadog Cloud Cost Management is clean meter you roll across your cloud environments. You subscribe per host, and the rate depends on billing cadence. That’s it — simple enough to drop into a spreadsheet without breaking rhythm.
Datadog Cloud Cost Management is priced per host per month. Choose annual, monthly, or on-demand billing. Usage-based billing cycle: Datadog calculates fees based on product usage each calendar month (unless your order states otherwise).
Starting price: $7.50 per host/month (billed annually).
Highest published price: $10.80 per host/month (on-demand).
Quick example for a company with ~500 servers: Assume “one server = one host” for CCM math:
- Annual plan: 500 × $7.50 = $3,750/month → $45,000/year.
- Month-to-month: 500 × $9.00 = $4,500/month.
- On-demand: 500 × $10.80 = $5,400/month.
That gives Finance clean budgets to model, and gives you a predictable line item when you brief leadership. Among FinOps companies, this is the kind of pricing you can read out loud, jot down in two cells, and get back to tuning service spend before lunch.
Pros and cons
✅ Real-time visibility. “Datadog provides real-time visibility into infrastructure and application performance with intuitive dashboards and robust alerting.” G2
✅ Cost context engineers actually use. “With Datadog, we have an overview dashboard… to ensure [costs] reflect what we were expecting.” Datadog
✅ Strong integrations across stacks. “The out-of-the-box integrations with AWS, Azure, and Kubernetes are a huge plus.” G2
❌ Pricing can climb. “Pricing can ramp up quickly…” G2
❌ UI overwhelm for new users. “The UI can feel a bit overwhelming at first…”G2
❌ Alert tuning takes work. “Alert tuning needs discipline to avoid noise.” G2
Vantage FinOps
Capterra: ★★★★★ 4.7/5
Trial days: 14
Best for: SaaS/digital platforms, fintech/insurance, media.
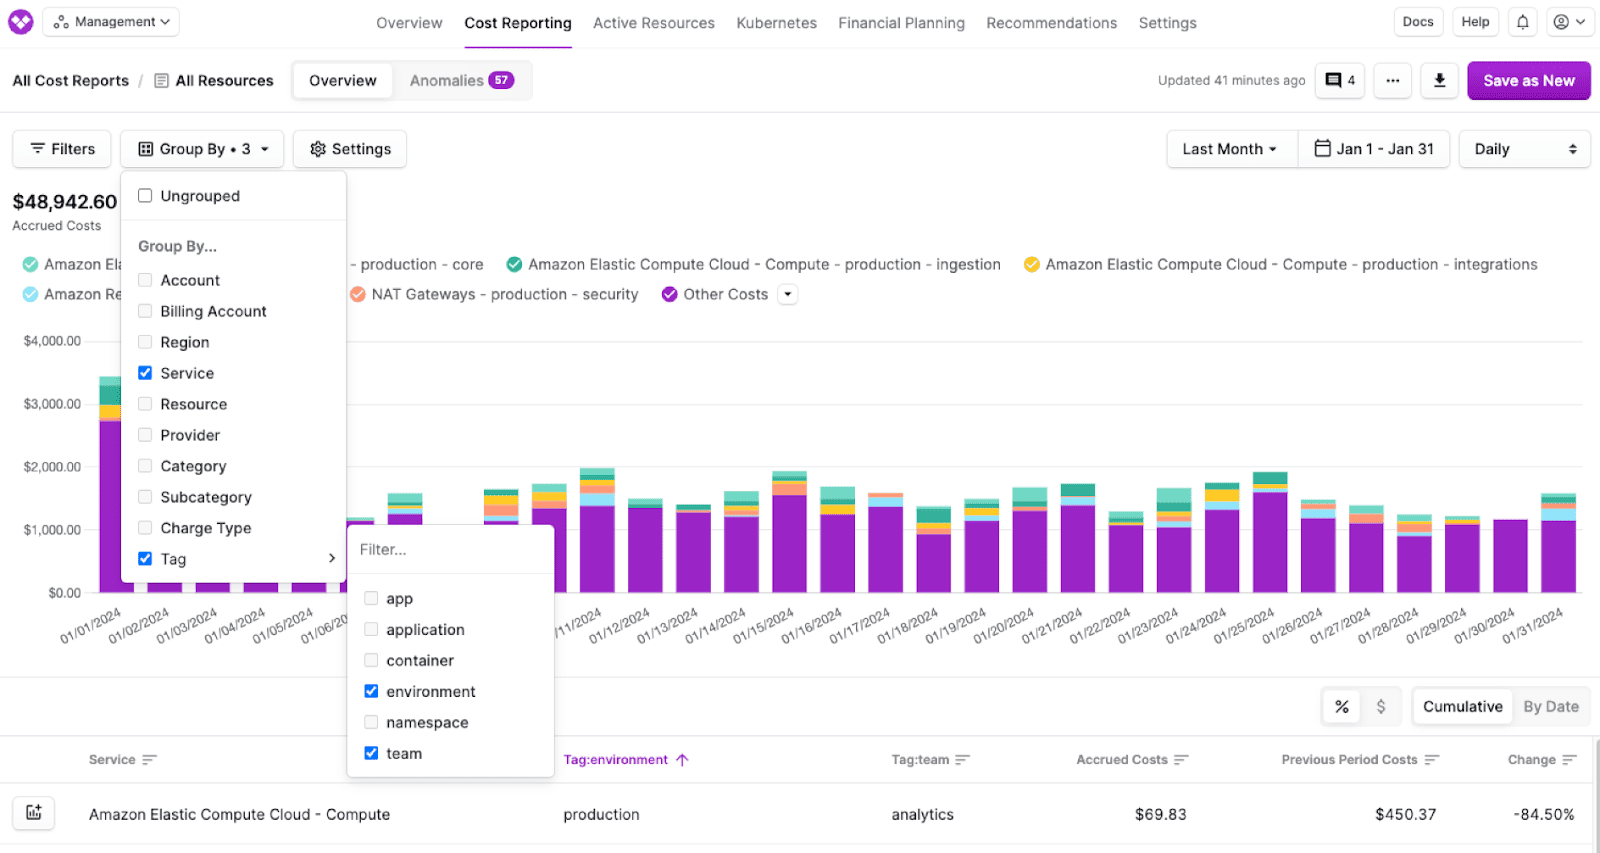
Vantage is FinOps company that gives you one surface to see, explain, and act on every cloud dollar with zero theatrics. It ingests billing from AWS, Azure, and Google Cloud, then layers in vendors like Snowflake, Datadog, and Fastly so the story matches the stack you actually run.
Teams lean on Vantage for a weekly cadence that turns questions into decisions: allocate, forecast, and tune. MSPs even run multi-tenant portals from one console — central control, client-specific reporting, and clean billing flows. That’s a lot of runway for one cost platform.
Features
- Multi-cloud ingest & normalized views. Hook up CUR, Azure exports, and GCP billing; analyze by AWS Account, Azure Subscription, or GCP Project in a single model. Filters stay fast; pivots don’t require spreadsheets.
- Budgets & alerts that keep owners honest. Configure percent-based thresholds on cost reports and send alerts on actuals; pair with anomaly alerts so a one-off spike doesn’t drown the channel. That’s practical cost management for busy teams.
- Anomaly detection with memory. Detect outliers once per event, log the history on the report, and cut noise for recurring spikes. Your “what changed yesterday?” thread starts with evidence.
- Unit Costs (business-level economics). Track cost per customer, per request, or per endpoint — right next to cloud spend. Pipe business metrics via API and see environments through a revenue lens, not just totals.
- Dynamic cost allocation. Split shared lines proportionally using other costs or metrics (think: distribute shared egress by product share). Allocation becomes code, not folklore.
- Dashboards & reports built for narrative. Stand up cost reports that roll up by team, tag, or product with saved views and scheduled emails. Forecasts are available alongside history, so your Friday brief lands cleanly.
- Integrations that mirror reality. Pull in vendor bills beyond the cloud provider layer — Snowflake, Datadog, and more — so “where did the money go?” has one answer. Your resources and your invoices show up in the same place.
- Industry pulse with real data. Quarterly Cloud Cost Reports use anonymized telemetry from thousands of connected accounts to benchmark trends. It’s a handy gut-check before you tweak rate cards or quotas.
AWS Account, Azure Subscription, GCP Project, plus cluster lenses like Kubernetes Cluster → Namespace → Pod. Tie spikes back to services and ship the fix without leaving the room.
Vantage is a FinOps vendor that turns messy cloud costs into an operating rhythm — one report, one owner, one next step — so every cloud cost conversation ends with action instead of guesswork.
Pricing
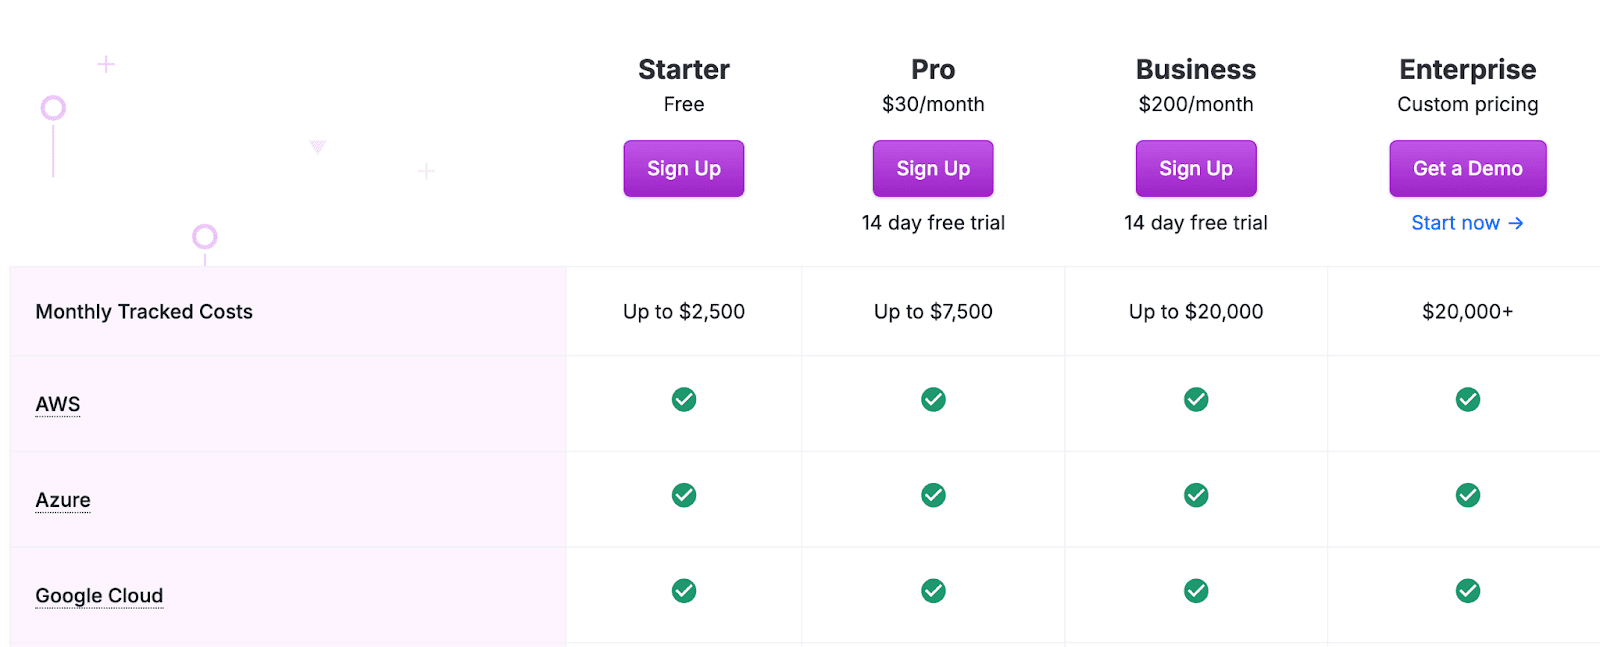
Vantage price follows the footprint you actually manage across your cloud environments.
How Vantage prices is based on subscription with a published floor and a simple ceiling. Public pricing starts at free (Starter) with paid plans from $30/month, and the highest publicly listed base is $200/month.
Enterprise formula for higher spend. On AWS Marketplace, Enterprise is $200/month + 1% of total monthly cloud costs over $20,000. That’s the whole lever, which makes modeling dead simple for budgets.
Starting price: $30/month (paid entry on the pricing page; Starter is $0).
Max published base: $200/month (Enterprise base), with variable 1% on monthly costs above $20k; no public cap beyond that formula.
Here is how much would it cost for a company with 500-serves: Servers aren’t the meter here; spend is. Say those ~500 servers average $300,000/month across providers. Under the enterprise formula:
- Base: $200/month
- Overage: 1% × ($300,000 − $20,000) = $2,800
- Estimated total: $3,000/month for the platform at that run rate. You can drop a different spend number in the same equation and refit your budgets in seconds.
Why finance teams at FinOps companies like this: you get a public floor, a clear base, and a single overage percentage tied to the cloud you actually run — which turns pricing into a line you can model, not a riddle.
Pros and cons
Here’s a quick, grounded pulse from real Vantage users — different angles, straight from public reviews.
✅ Fast setup. “It was easy to get deployed.” Amazon Web Services, Inc.
✅ Budget-friendly visibility. “Helps us create easy to visualize and track budgets of our AWS spend.” Amazon Web Services, Inc.
✅ Solid multi-cloud integrations. “Connects smoothly with major cloud providers (AWS, GCP, Azure).” Amazon Web Services, Inc.
❌ Coverage gaps. “Vantage does not yet support all AWS resource types.” Amazon Web Services, Inc.
❌ Plan threshold friction. “Jump from a fixed-cost monthly plan to Enterprise after a certain billing threshold.” Amazon Web Services, Inc.
❌ Pricing clarity. “A little confusing pricing structure.” AWS.amazon.com
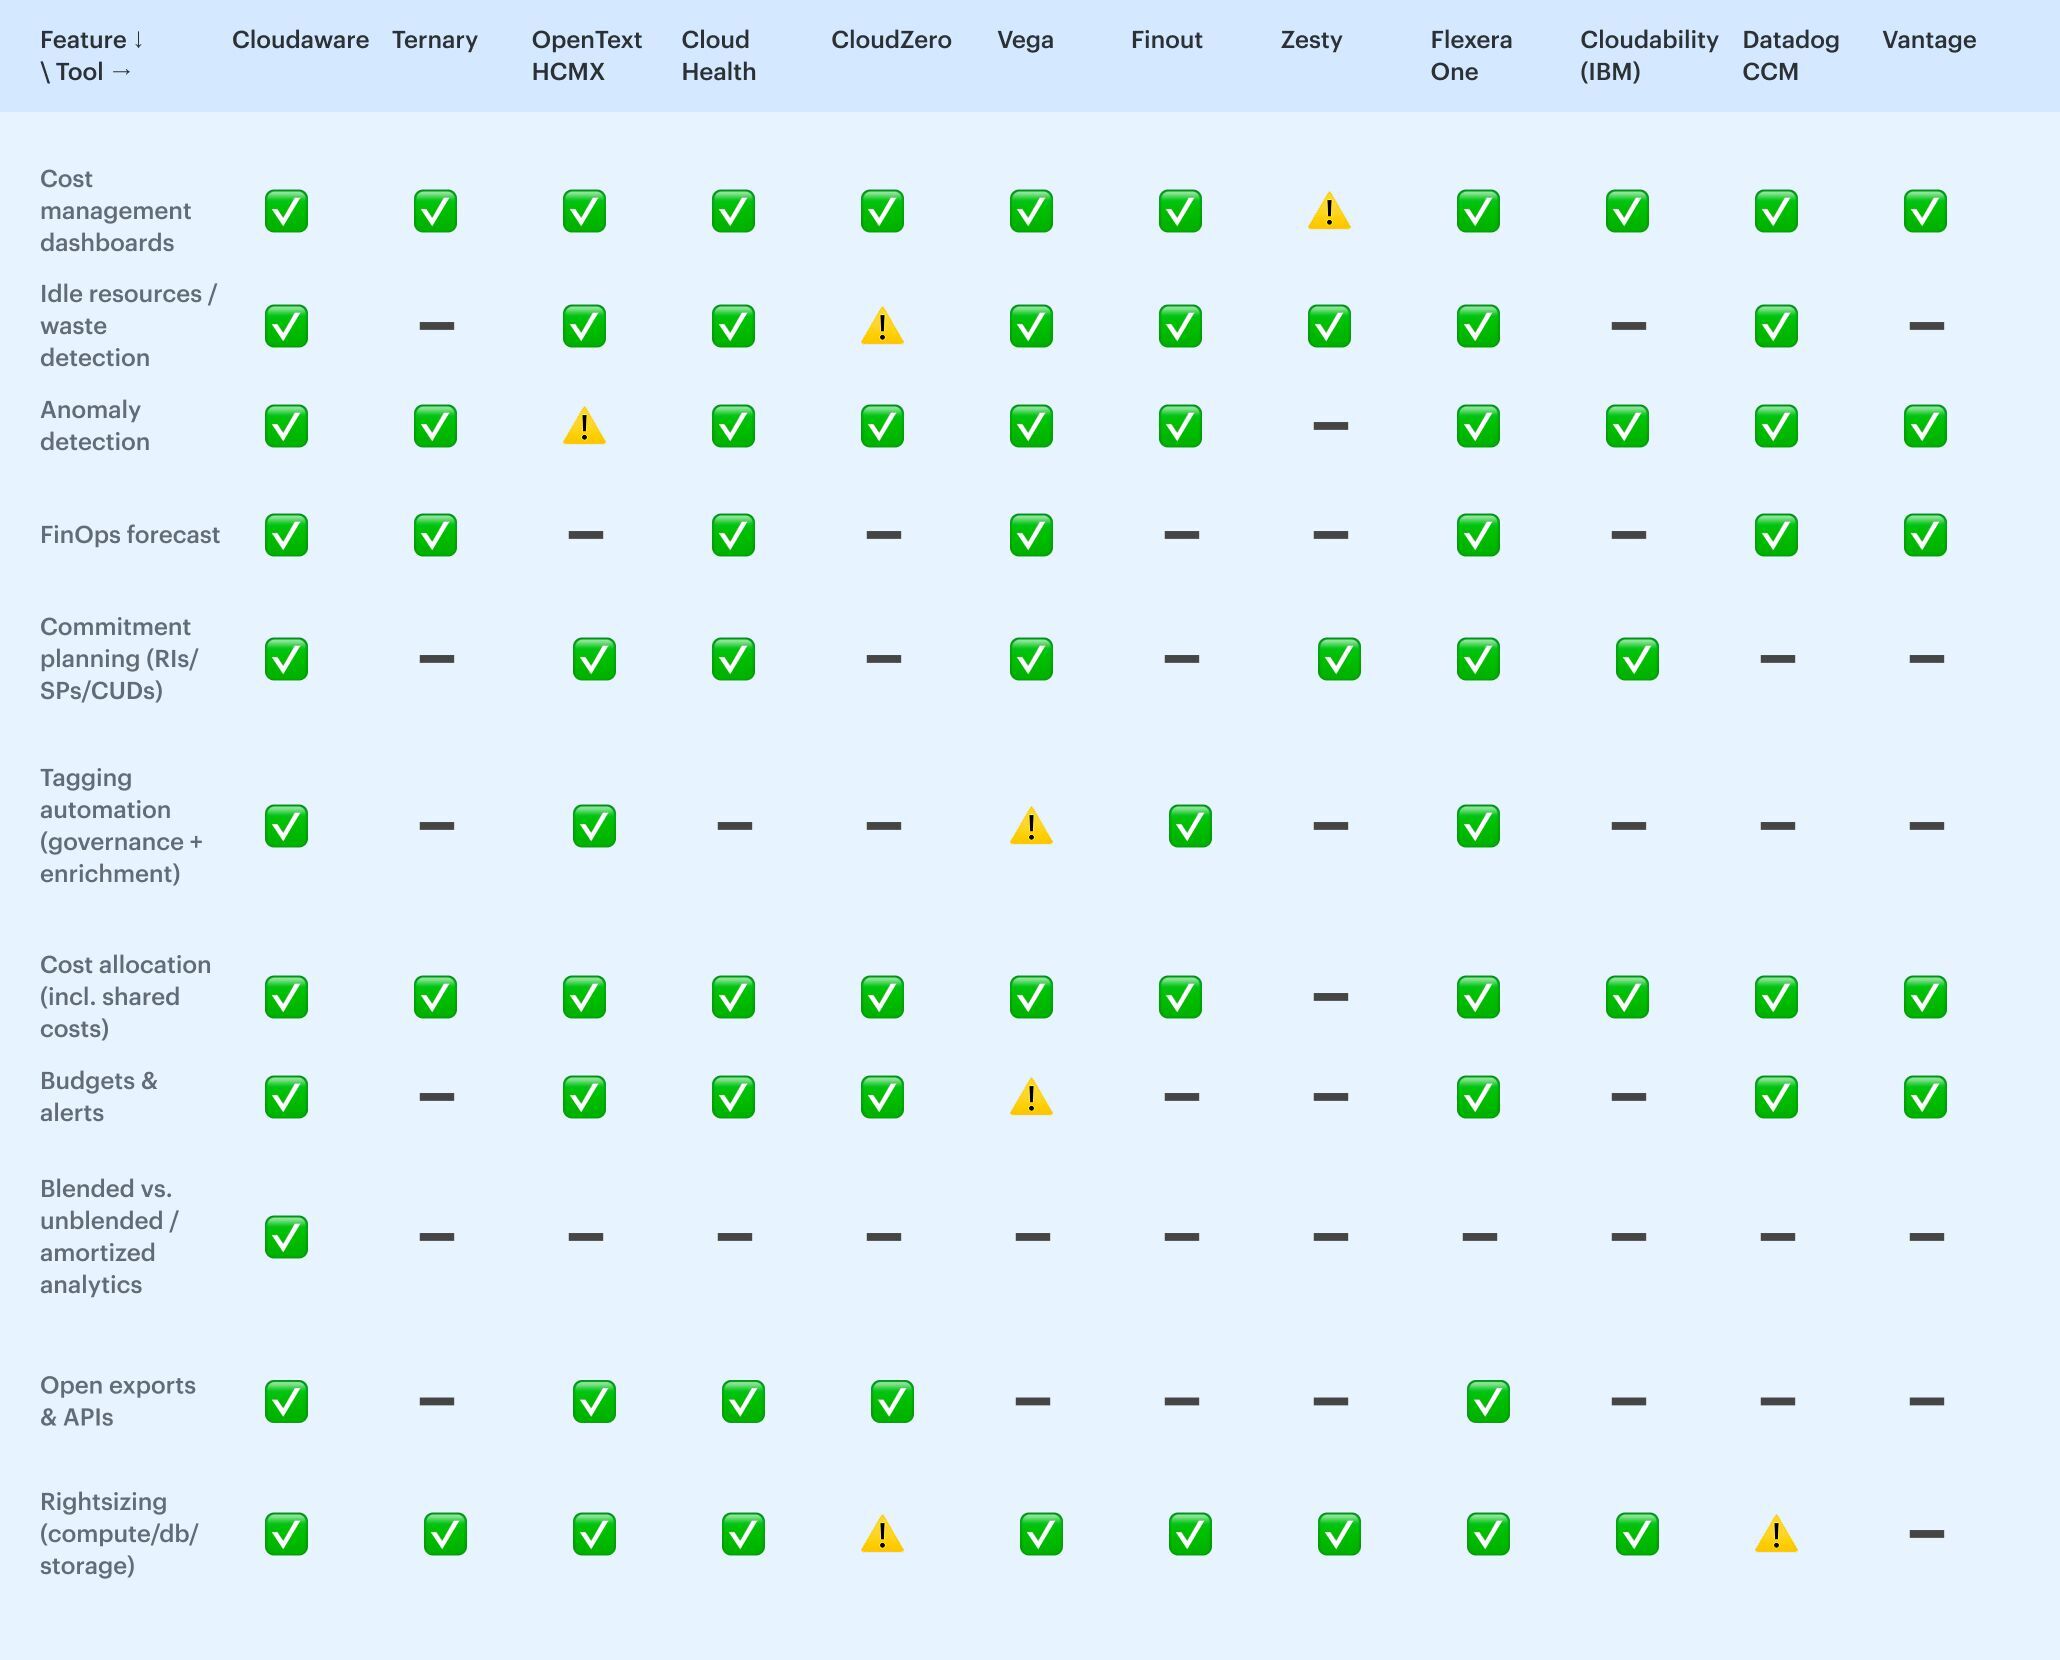
12 best FinOps platforms comparison table
