


Your cloud bill’s up. Your tag coverage’s down. And Finance just asked for a chargeback model – by next week.
You’re here because cloud cost allocation isn’t working the way it should. Maybe you’ve got AWS, Azure, and GCP feeding into separate dashboards. Maybe shared costs (like egress, NAT gateways, control planes) are all lumped together. Or maybe you just want to stop hearing “we can’t allocate that.”
This guide? It’s not theory. It’s the actual playbook from our Cloudaware teammates with 10+ years in FinOps, client lessons across mid-to-enterprise estates, and insights from industry voices like the FinOps Foundation community, J.R. Storment, and Mike Fuller – all grounded in data and cloud spend analytics.
Here’s what we’ll unpack:
- What’s breaking your allocation model – and how to fix it.
- Which methods scale across teams, clouds, and shared stuff.
- How to run showback without spreadsheets.
- What “good” looks like in multi-cloud.
- And where Cloudaware fits into the flow (without the sales pitch).
But before diving into expert detail, let’s check if we are on the same page about the basics 👇
What is cloud cost allocation?
Cloud cost allocation is the process of mapping every dollar you spend in the cloud – across AWS, Azure, Oracle, Alibaba, GCP – to the team, product, feature, or customer that actually drove it. You take raw billing data, tagging metadata, account structures, usage metrics, and business mappings, and turn that mess into something clean, owned, and actionable.
In FinOps terms, it’s foundational. It lives right at the Inform → Optimize → Operate handoff. Without it, your forecast’s a guess, your budget’s political, and your optimization backlog is based on gut, not numbers.
Good cost allocation shifts spend from “platform” to product lines. From “shared” to services. From “unknown” to accountable owners. And when done right, it tightens everything: your anomaly alerting, your commitment planning, even your unit economics model.
The goal? Accurate cloud cost allocation that’s traceable, explainable, and scalable. So when your CFO wants a showback report – or your VP demands chargeback – you don’t fire up a spreadsheet. You just click "export."
Who is this for and what problems are you solving?
This is for the people who get tagged in a Slack thread when the cloud bill spikes.
- The FinOps managers trying to explain cost trends to Finance without sounding vague.
- The platform teams juggling thousands of SKUs and wondering which service keeps draining the budget.
- The DevOps leads who own the infra but not the app – and still get blamed for the overages.
- And every product owner who wants cost per feature but keeps hearing “we don’t have that view.”
Cloud cost allocation gives them the view.
Without it? You’re chasing anomalies without knowing whose code triggered them. You're forecasting against the wrong baselines. You’re missing shared usage between teams. And your dashboards show totals – but not truth.
We’ve seen orgs lose trust in their own numbers because the data was incomplete or unlabeled. Or worse – because the cost management processes were bolted on after scale.
Allocation is the thing that makes cloud spend make sense.
What are the benefits of cloud cost allocation?
You're burning budget and no one knows who lit the match.
That’s what it feels like when you’re running AWS, Azure, and GCP across multiple teams – and your dashboard shows spend by region, not by responsibility. Cloud cost allocation puts names on numbers. It gives your teams a map of what they’re using, what it’s costing, and what needs to change.
Here’s what you unlock when allocation’s dialed in:
- Accountability with receipts. Every resource gets mapped. Every cost gets routed. High-performing orgs allocate over 95% of usage to owners, according to the FinOps Foundation. That’s not perfection – it’s the baseline for maturity.
- Forecasts Finance trusts. No more “safe” buffers or “surprise” overages. When allocation is clean, Finance can model spend with confidence, tie budgets to real usage patterns, and set expectations that actually hold.
- Smarter questions, better answers. When cost is tied to workload, team, or feature, the conversation shifts. Now it’s “why did preview environments spike last week?” instead of “who blew the budget?”
- Optimization that’s targeted, not vague. With proper allocation, you can pinpoint waste, track underused commitments, and kill zombie resources without trawling billing CSVs. Teams with mature allocation move 32% faster on cost-saving actions.
- Culture shift. When engineers see the cloud cost tied to their service in a dashboard they check every day, they care. When product sees spend alongside revenue per feature, they rethink priorities.
One more thing? You don’t need a spreadsheet for any of this. Not if your allocation’s solid. Just filter, schedule, export. Done.
Read also 👉 Cloud Cost Optimization Framework - 11 Steps to reduce spend
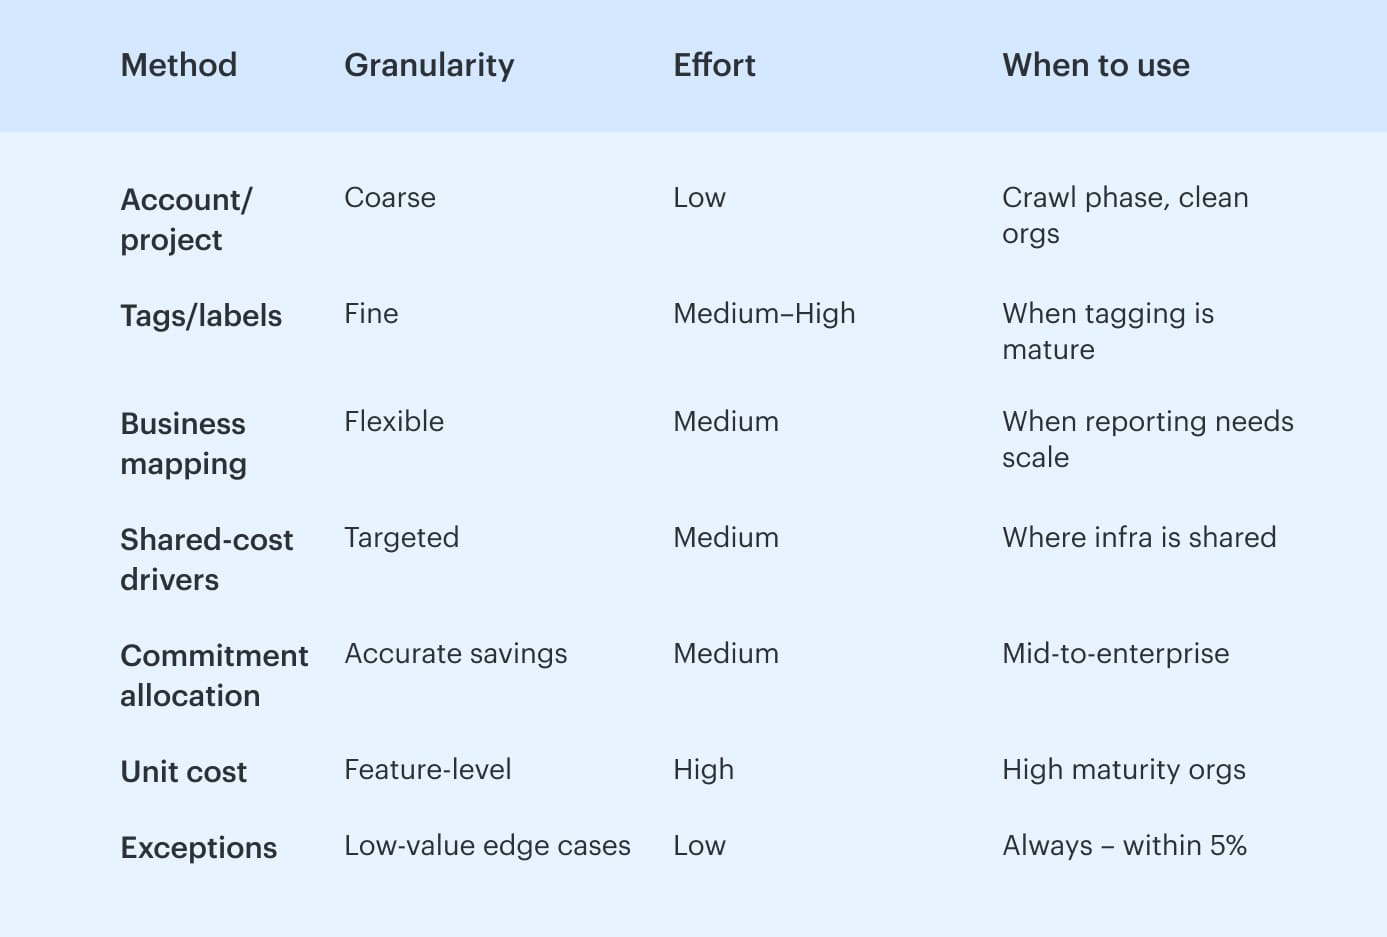
7 Cost allocation methods: which one’s going to save your next budget review?
There’s no shortage of opinions out there, but these are the recommended cloud cost allocation methods we’ve seen hold up across teams, clouds, and real-world usage. Each method gives you a different lens on your cloud spend – some are fast, some are precise, some require serious governance.
Most companies don’t pick one. They layer them.
Let’s break it down.
Method #1 – Account, subscription, or project-based allocation
The easiest place to start. Carve up spend by AWS accounts, Azure subscriptions, or GCP projects. Great for ownership at the org level. But you won’t get feature-level insights, and shared platforms muddy the picture fast.
Use this to get quick wins, especially if you’ve already structured organizations smartly.
Also: Clean allocation is what enables deeper optimization later — including provider-focused efforts like Azure cost optimization across resource groups and services.
Method #2 – Tag and label-based allocation
This is where the real granularity lives. You assign tags – like product, owner, env – to every billable resource. Then map those back to teams, environments, and lines of business.
But here’s the thing: tagging only works if you enforce it. Missing tags = missing visibility. You’ll need a governance process that flags noncompliant tagging and routes clean-up tasks weekly.
Method #3 – Business mapping (aka cost categories, dimensions, etc.)
Once accounts and tags are stable, you layer on business mappings: rules that group spend across infra. Think: “If account = marketing-dev or tag = env:dev, map to BU:Marketing.”
This lets you build views by team, product, cost center – without changing infra. You’ll define your allocation logic, connect the right allocation metadata, and assign owners to maintain each mapping.
Keep it tight. Cost centers change. So should your mappings.
Method #4 – Shared-cost driver allocation
For shared resources like NAT gateways, security tooling, EKS control planes – you need drivers. Split shared costs by things like GB transferred, CPU-hrs, request counts, or even seat count.
Pick a driver. Keep it boring. Document it. Review quarterly.
One bad assumption here and your shared cost model loses trust fast.
Method #5 – Commitment allocation (RIs, Savings Plans, CUDs, EAs)
Someone buys the commitments. Someone else benefits. That disconnect adds noise unless you spread the savings across actual usage. Commitment allocation solves that. You look at who used the discounted hours and apply the savings there.
Use separate charts for effective cloud cost (with amortization) vs raw on-demand to avoid confusion.
Method #6 – Unit-cost mapping
This is next-level: map spend per feature, per transaction, per customer. Think: “How much does it cost to serve one API request?” Or: “What’s infra cost per paid subscriber?”
You’ll need clean input from all the above, plus business-side metrics (orders, sessions, MAUs). It’s what lets teams compare cost per user across products or time. Goldmine for FinOps maturity.
Method #7 – Exceptions and the neutral bucket
Every allocation model has leftovers – bits that don’t fit. That’s okay. Just name them. Keep a neutral bucket for unallocated costs, track what’s in it, and make sure it stays under 5%. Label it clearly so no one thinks it’s hiding spend.
Want to compare at a glance? Here’s your allocation model cheat sheet:
Before you can allocate anything – to teams, products, features, or shared services – you need the raw ingredients. And in cloud, those ingredients aren’t universal. What AWS gives you by default, Azure buries in exports, and GCP won’t show you at all unless labels are configured up front.
So let’s look at what data you actually need to make any of these methods work – per cloud, per billing system, per setup.
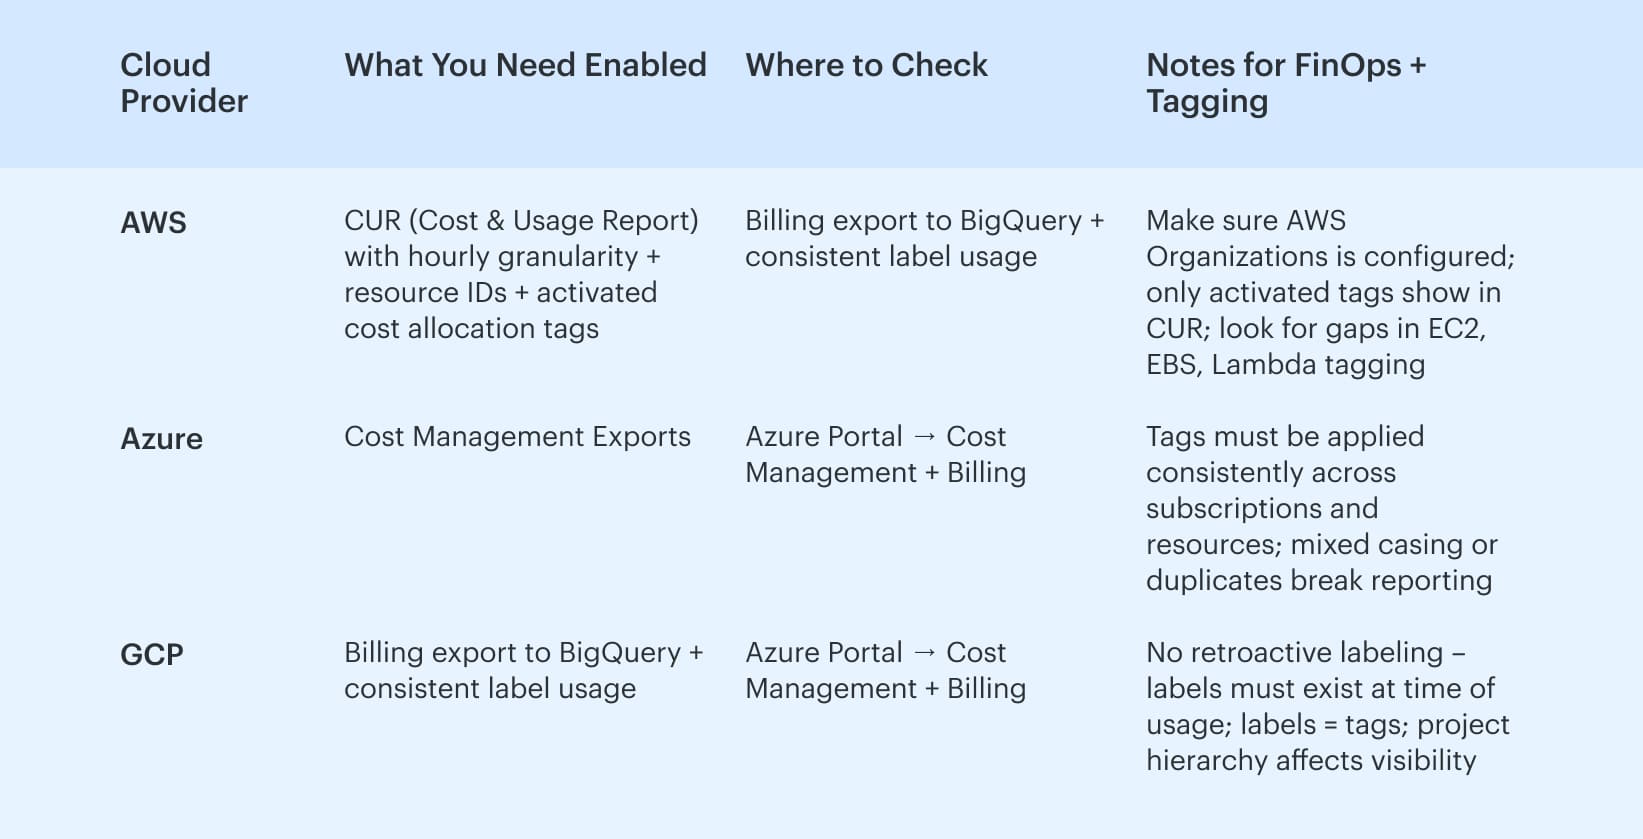
Minimum data prerequisites by cloud
Before you start allocating anything, check your ingredients. Every cloud provider gives you different slices of billing data, and what’s missing now will bite you later – usually mid-forecast.
- Let’s start with AWS. You’ll need the CUR (Cost and Usage Report) turned on, ideally with hourly granularity and resource IDs enabled. If you're running AWS Organizations, make sure linked accounts are feeding into the master billing view. Tags must be activated for cost allocation – yes, you have to manually mark them as “cost allocation tags” or they won’t show up in the CUR.
- On the Azure side, you’ll be pulling exports from Azure Cost Management. Subscription hierarchy matters here. So does tagging consistency – Azure lets you tag almost anything, but it won't surface unless it’s structured cleanly across resources. Think: consistent key naming, no half-finished
costCentervscost_centerchaos. - For GCP, you’ll need billing export to BigQuery enabled. Labels are your tags here. If they’re not applied, you’re flying blind – Google doesn’t retro-tag historical usage. Build in metadata collection early, or spend weeks trying to reverse-engineer who did what.
Set up a shared doc or dashboard where you track:
- Activated tag keys (per cloud)
- Account/project-level tagging coverage %
- Broken keys (e.g.,
envvsenvironment) - Missing cost-linked metadata
You’ll thank yourself when Finance asks where that $47,982 “Unallocated” line configuration item came from.
Sure, you could stitch all of this together manually. Spin up CURs, chase down missing tags, export into BigQuery, patch together your own dashboards in Looker or Excel. But that’s hours per week just to keep the basics working.
Or – you connect your cloud accounts to a FinOps platform like Cloudaware and automate this process 👇
How to allocate cloud costs in a multi-cloud environment
Imagine having to juggle three different cloud bills at once – AWS, Azure, GCP – each with its own format and quirks. It’s a headache, right? But it doesn’t have to be. With the right approach, you can make sense of all that spending without breaking a sweat.
For clarity, let's tackle it as a numbered step-by-step guide.
We'll walk through exactly how to get a grip on multi-cloud costs, and we'll include specific Cloudaware features in each step to show how FinOps tools can smooth the process.
Consolidate all cloud costs into one view
Start by pulling all your cloud spend data into a single pane of glass. If you’re bouncing between AWS, Azure, and GCP consoles, you’re bound to miss something. Instead, centralize everything.
For example, Cloudaware FinOps automatically collects real-time billing data from AWS, Azure, Google Cloud, and more into one dashboard.
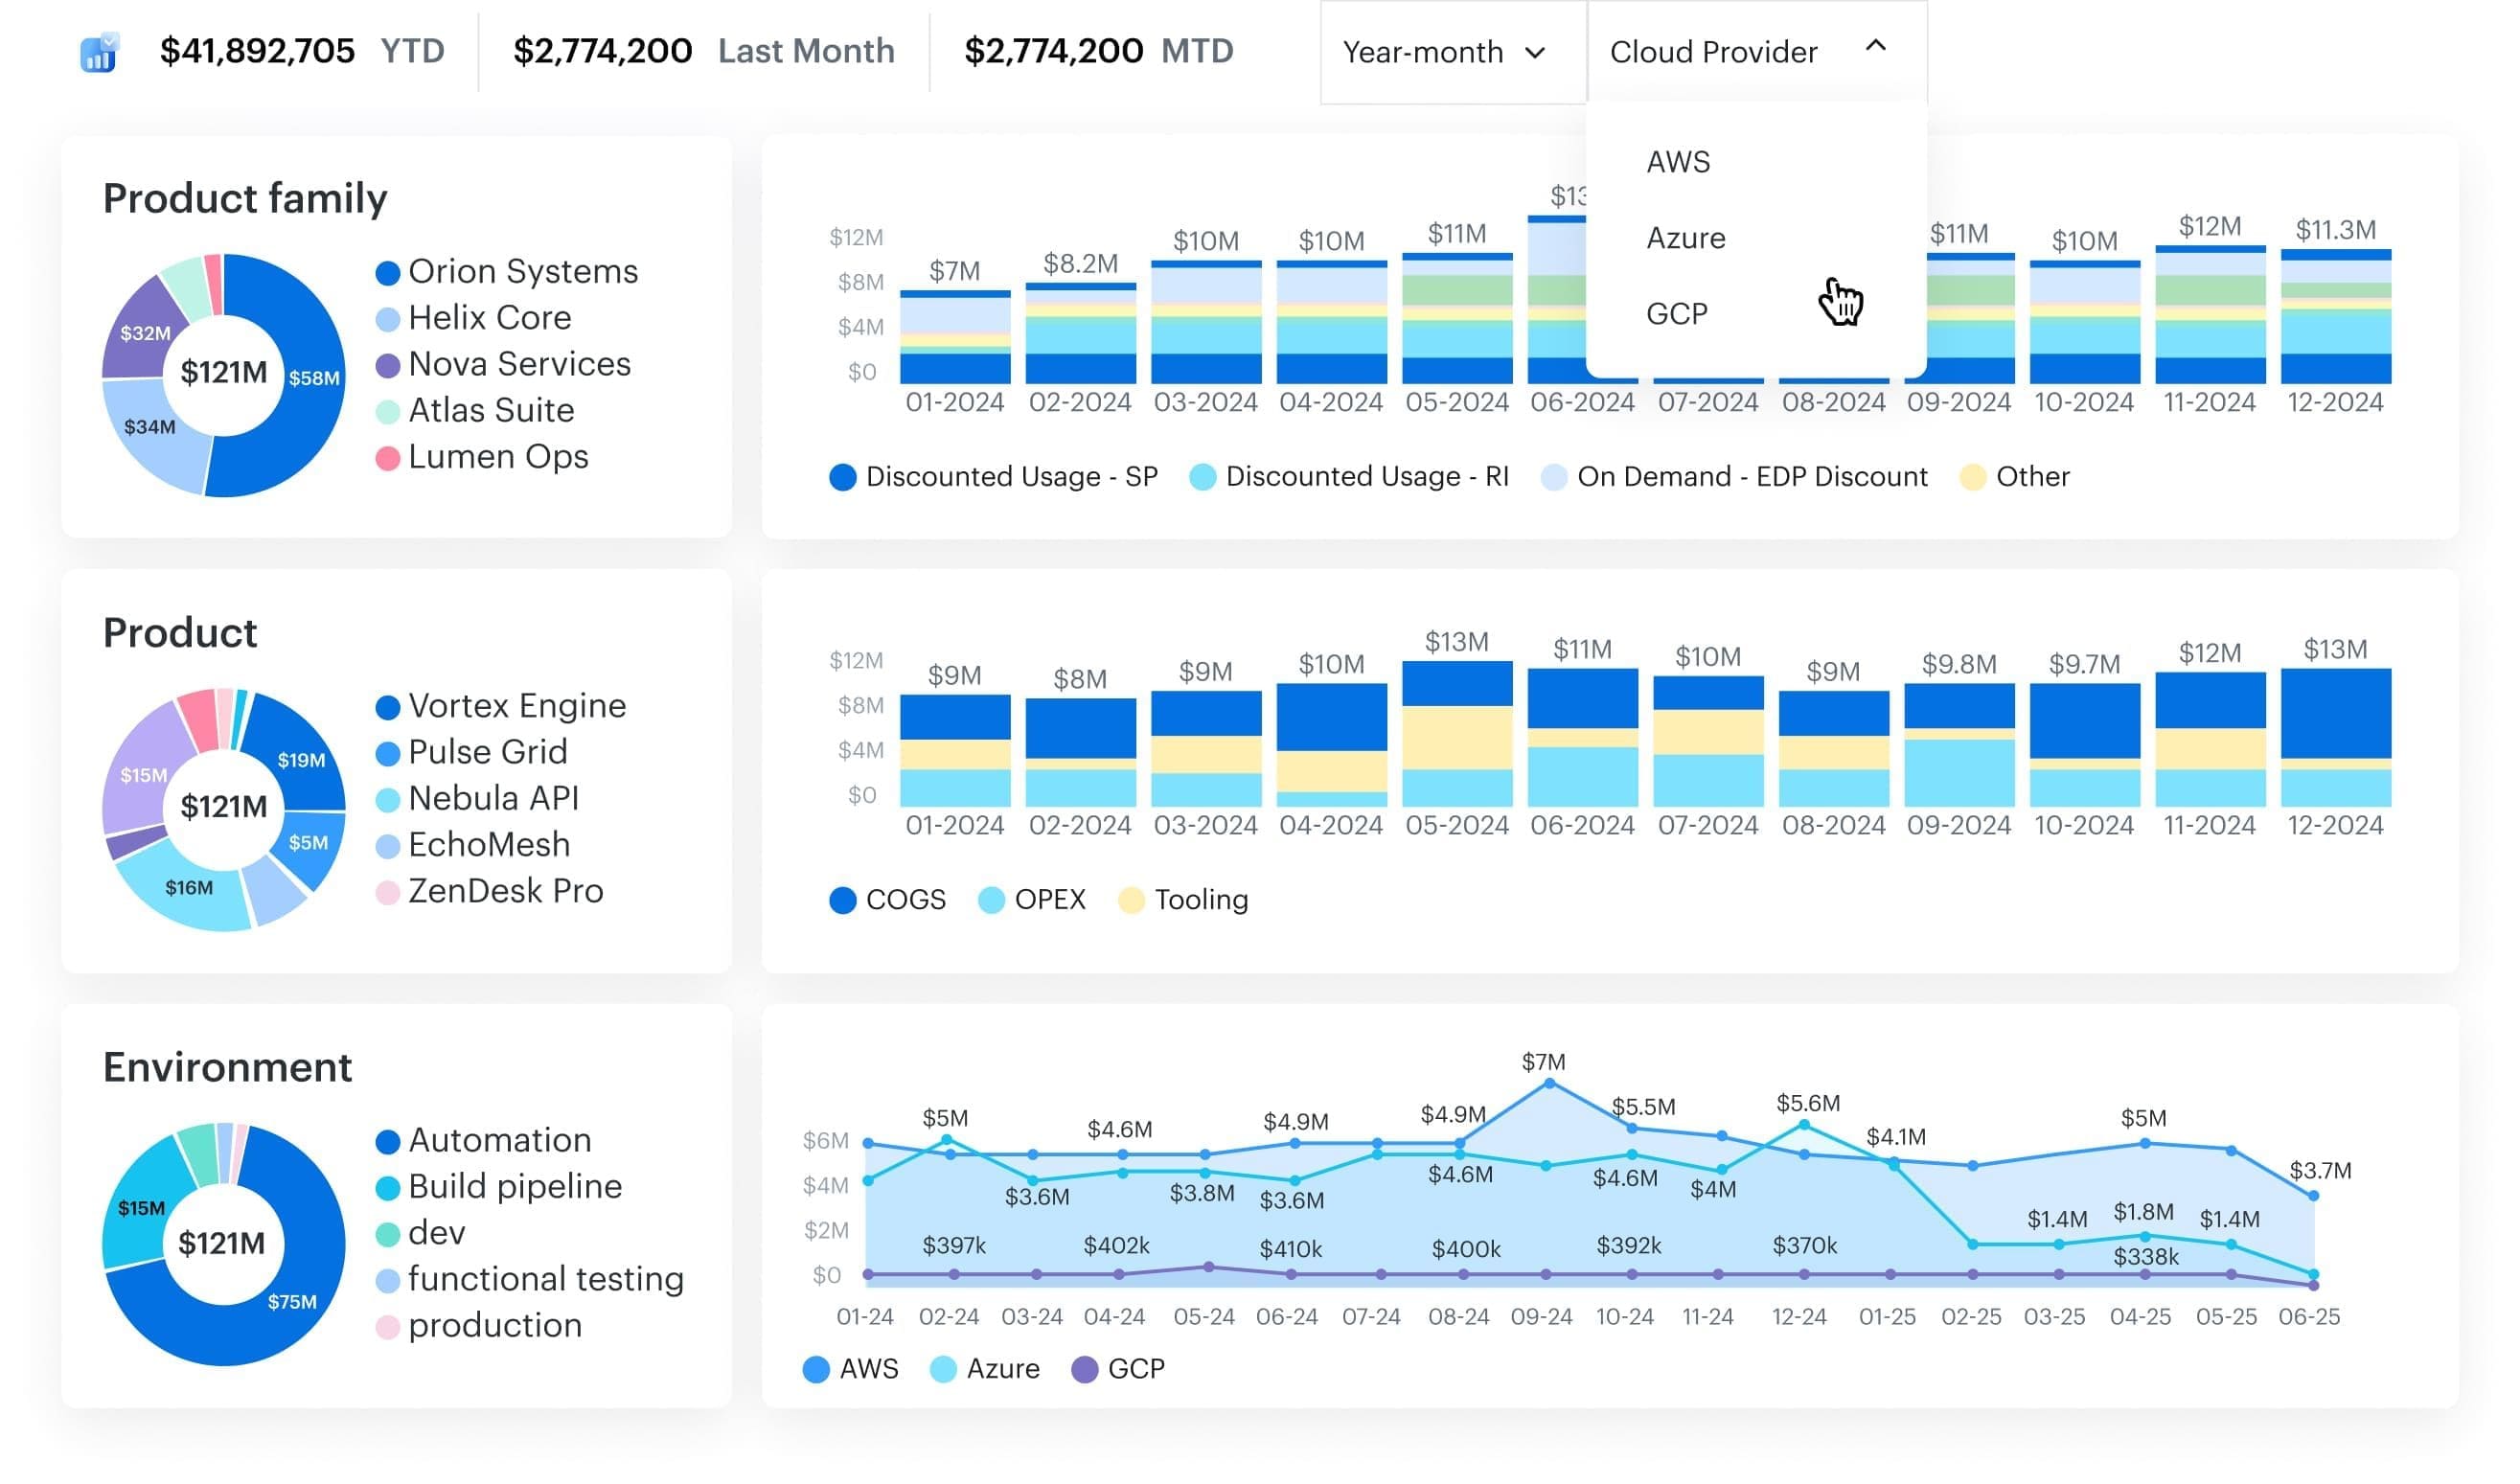
You can stop hopping between multiple portals or stitching together spreadsheets – everything is visible in one place, a single source of truth for your cloud spending. In fact, visibility is half the battle.
Surveys show that about one-third of cloud spend is typically wasted – and lack of cost visibility is a top culprit in over half of that waste. A unified view is more than a convenience – it’s essential to spot and plug those leaks early.
Read also 👉 Cloud Cost Analysis Guide 2026 - Steps, Tools & Expert Tips
Normalize and tag resources consistently
Next, bring order to the chaos of cloud tagging. Each cloud provider might use different tagging conventions (or none at all), which makes apples-to-apples comparisons tough.
The fix is a consistent tagging strategy across all platforms.
Think of tags like marketing campaign labels – without them, you can’t tell which campaign (or in this case, which app or team) drove which costs.
Cloudaware helps here by providing tagging normalization tools. It automatically cleans up and standardizes tags behind the scenes, so “DevTeam” on AWS and “Development” on Azure merge into one coherent category.
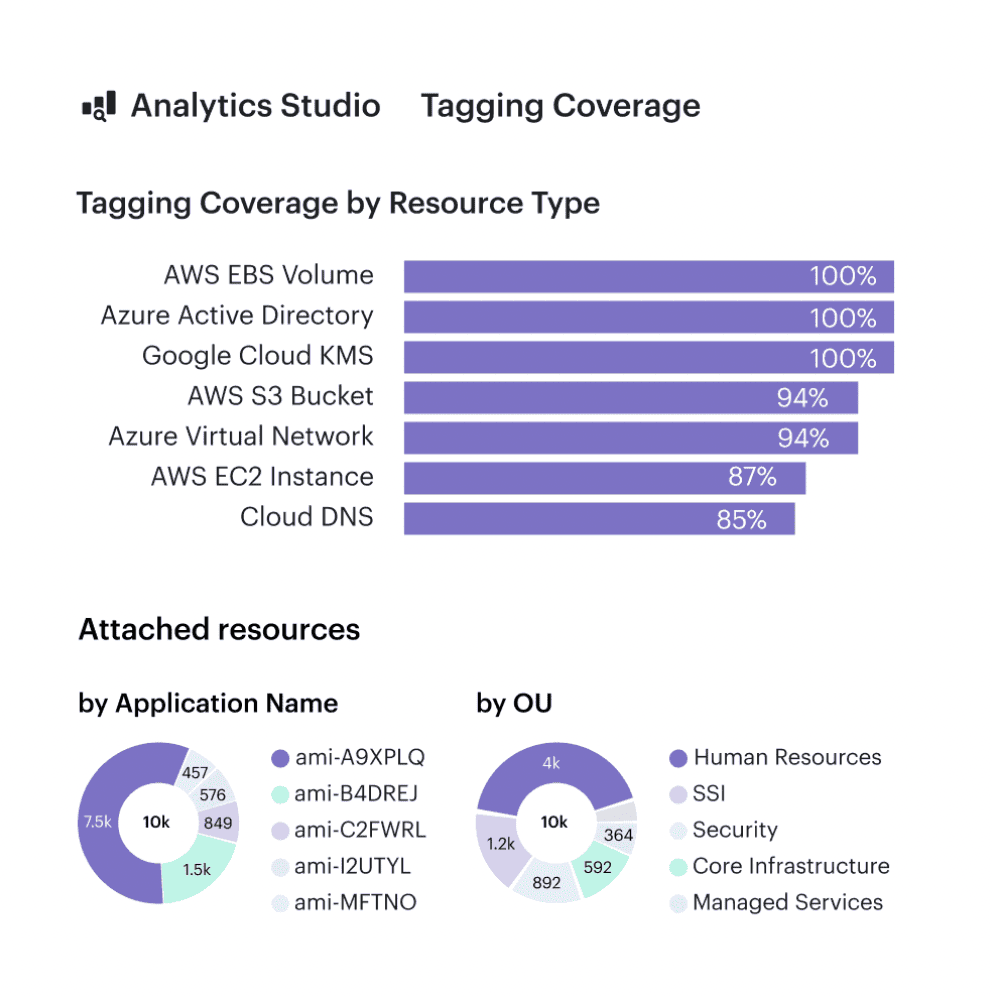
Cloudaware tagging report. Any questions on how it works? Ask them on a live call.
The result? You gain clarity on who’s using what.
Those once-mysterious “untagged” expenses? Gone.
And with clear tags, you can attribute every cloud expense to a specific feature, team, or product – just like an ASO expert pinpoints which keyword is boosting app installs.
Align costs with your business structure
Now that your data is organized, decide how you want to slice the pie. Effective cost allocation means mapping cloud spend to the way your business actually runs. Are you dividing costs by product? By department? By customer or environment?
Choose a model that resonates with your organization’s goals.
Cloudaware’s FinOps platform shines here by leveraging its CMDB (Configuration Management Database) to add context. It can map every cloud resource to your existing service catalog or org chart.
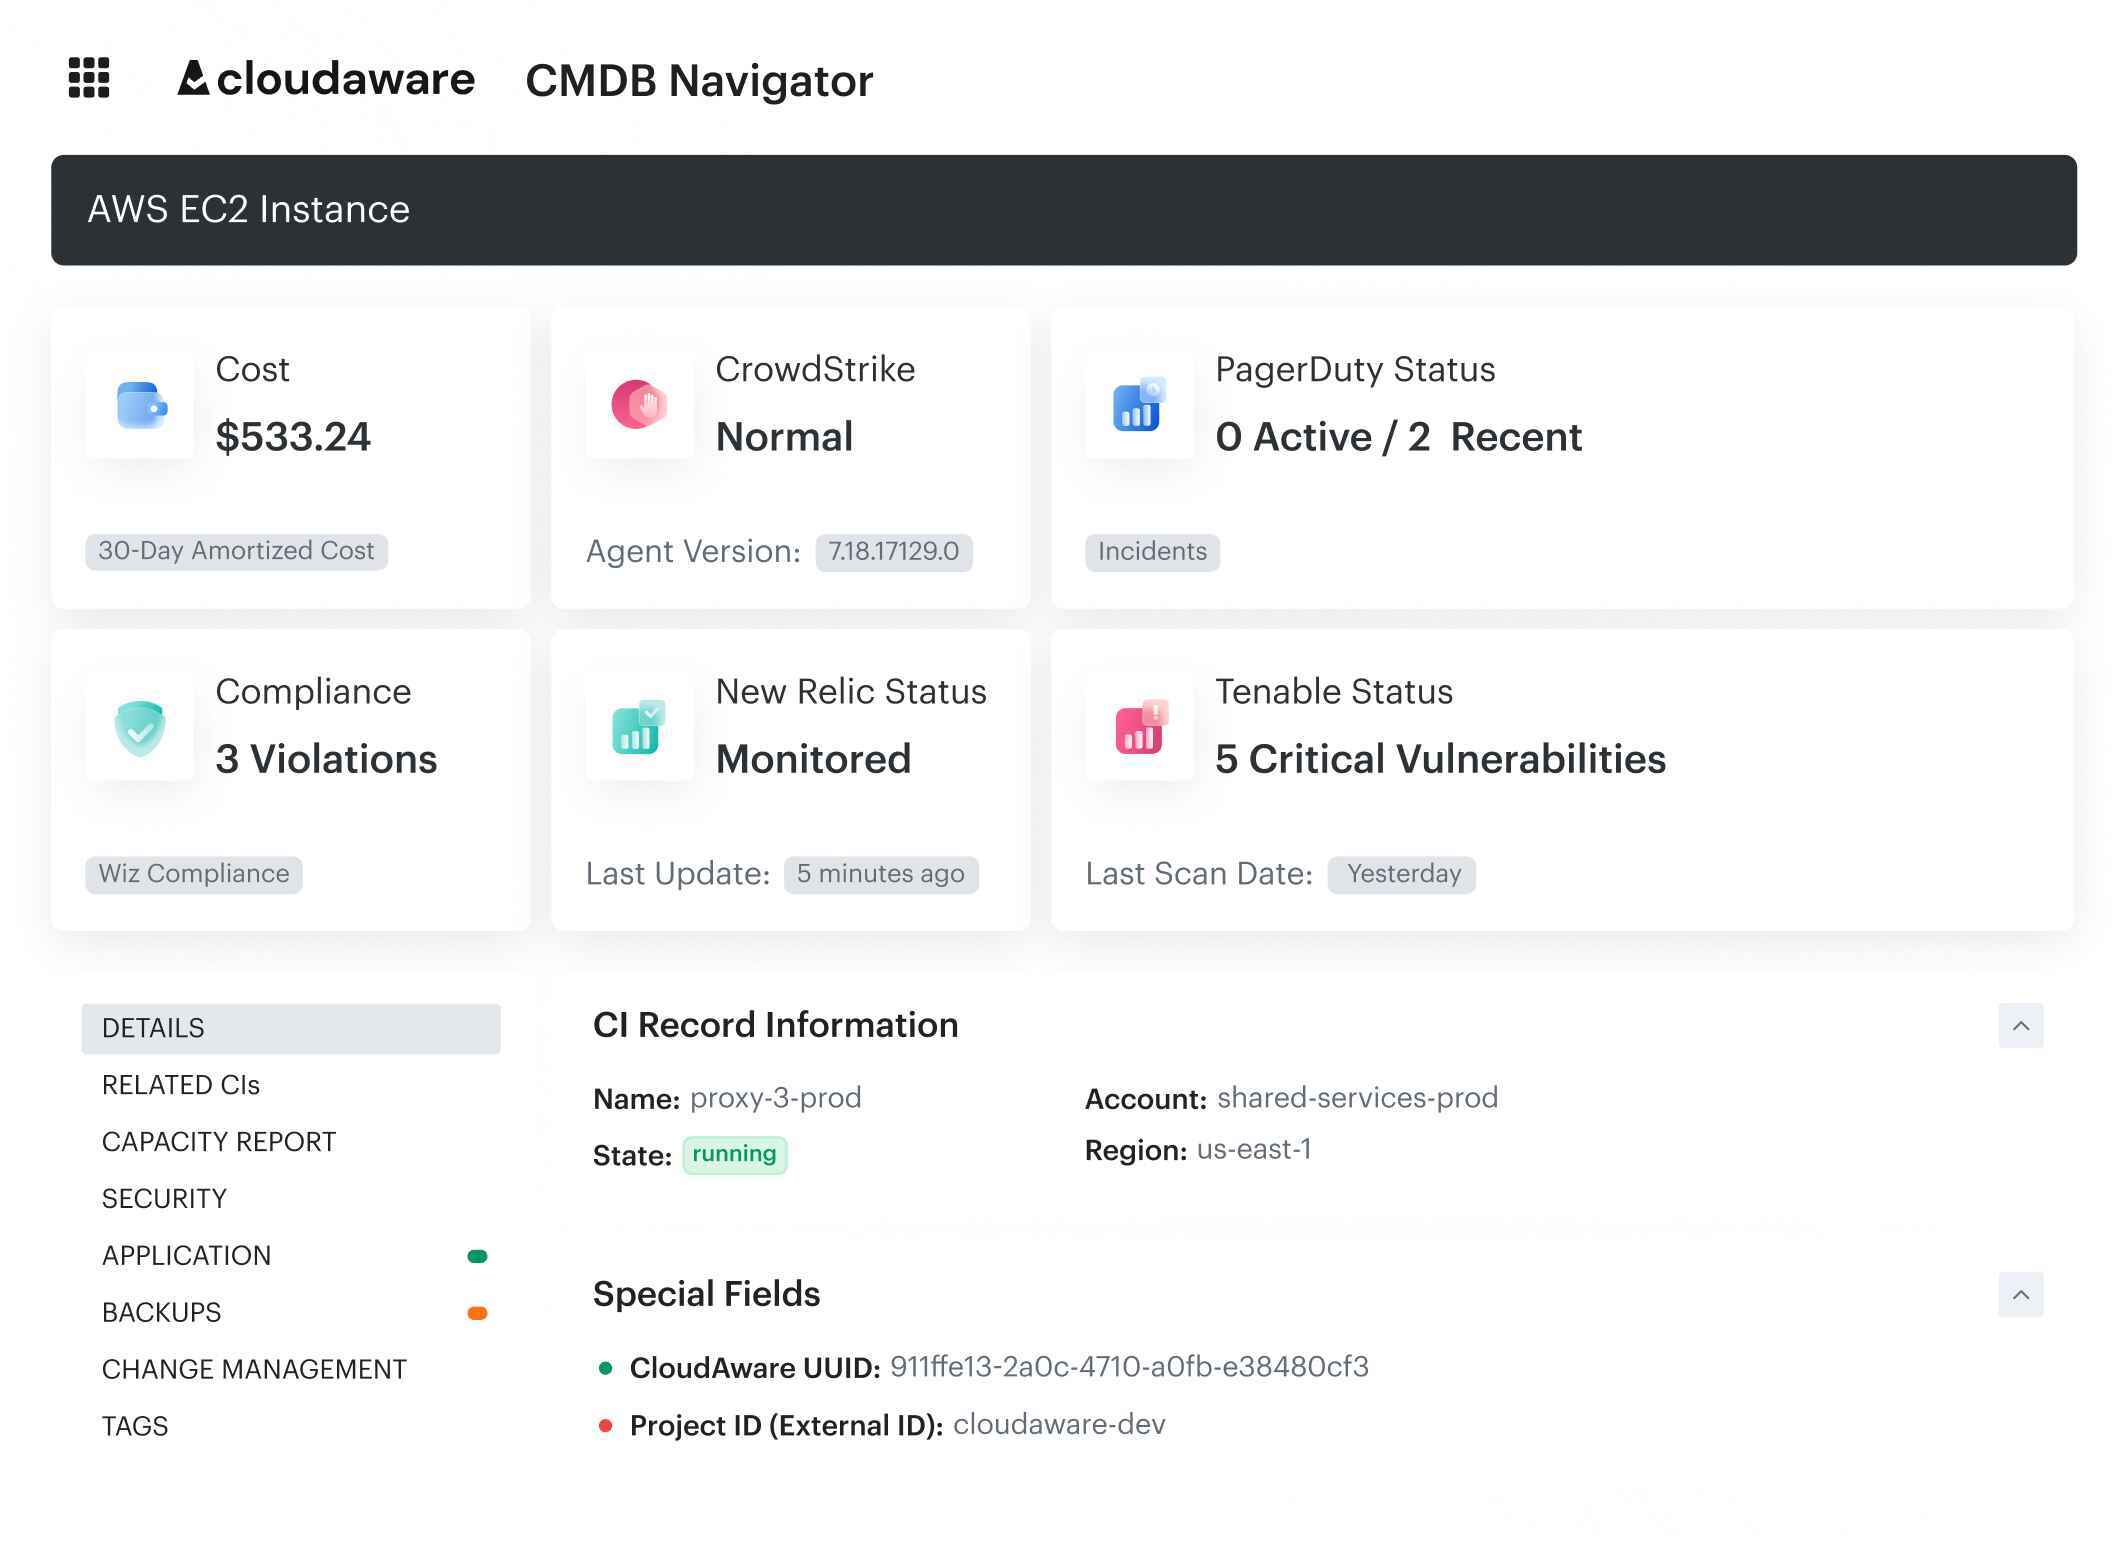
CMDB enriched data about CI in Cloudaware. Schedule a demo to see lit live.
That means if your company already groups resources by, say, “Shopping App” vs “Analytics Service,” your cost reports will mirror those same groupings.
This alignment is powerful: it lets you present cloud costs in terms everyone understands. Finance sees costs by department, product managers see costs by feature, and you see the ROI for each cloud investment clearly.
Read also 👉 7 Best Cost Allocation Software for FinOps Teams in 2025
Assign ownership and enable chargeback
With costs tied to business units or projects, make sure someone is responsible for each slice. Every cloud resource should have an owner – a team or product lead who can say, “Yes, that one is ours, and here’s why we need it.”
This step is all about accountability. When teams visibly see the price tag of their cloud usage, it changes behavior. You can formalize this with showback or chargeback practices: show each team what they spent, or even charge it against their budget.
Cloudaware supports this by merging cloud provider billing data with external data (like your org’s user or project lists) to create detailed, contextualized chargeback reports. Each app owner or team gets a window into their cloud spending with built-in dashboards and reports.
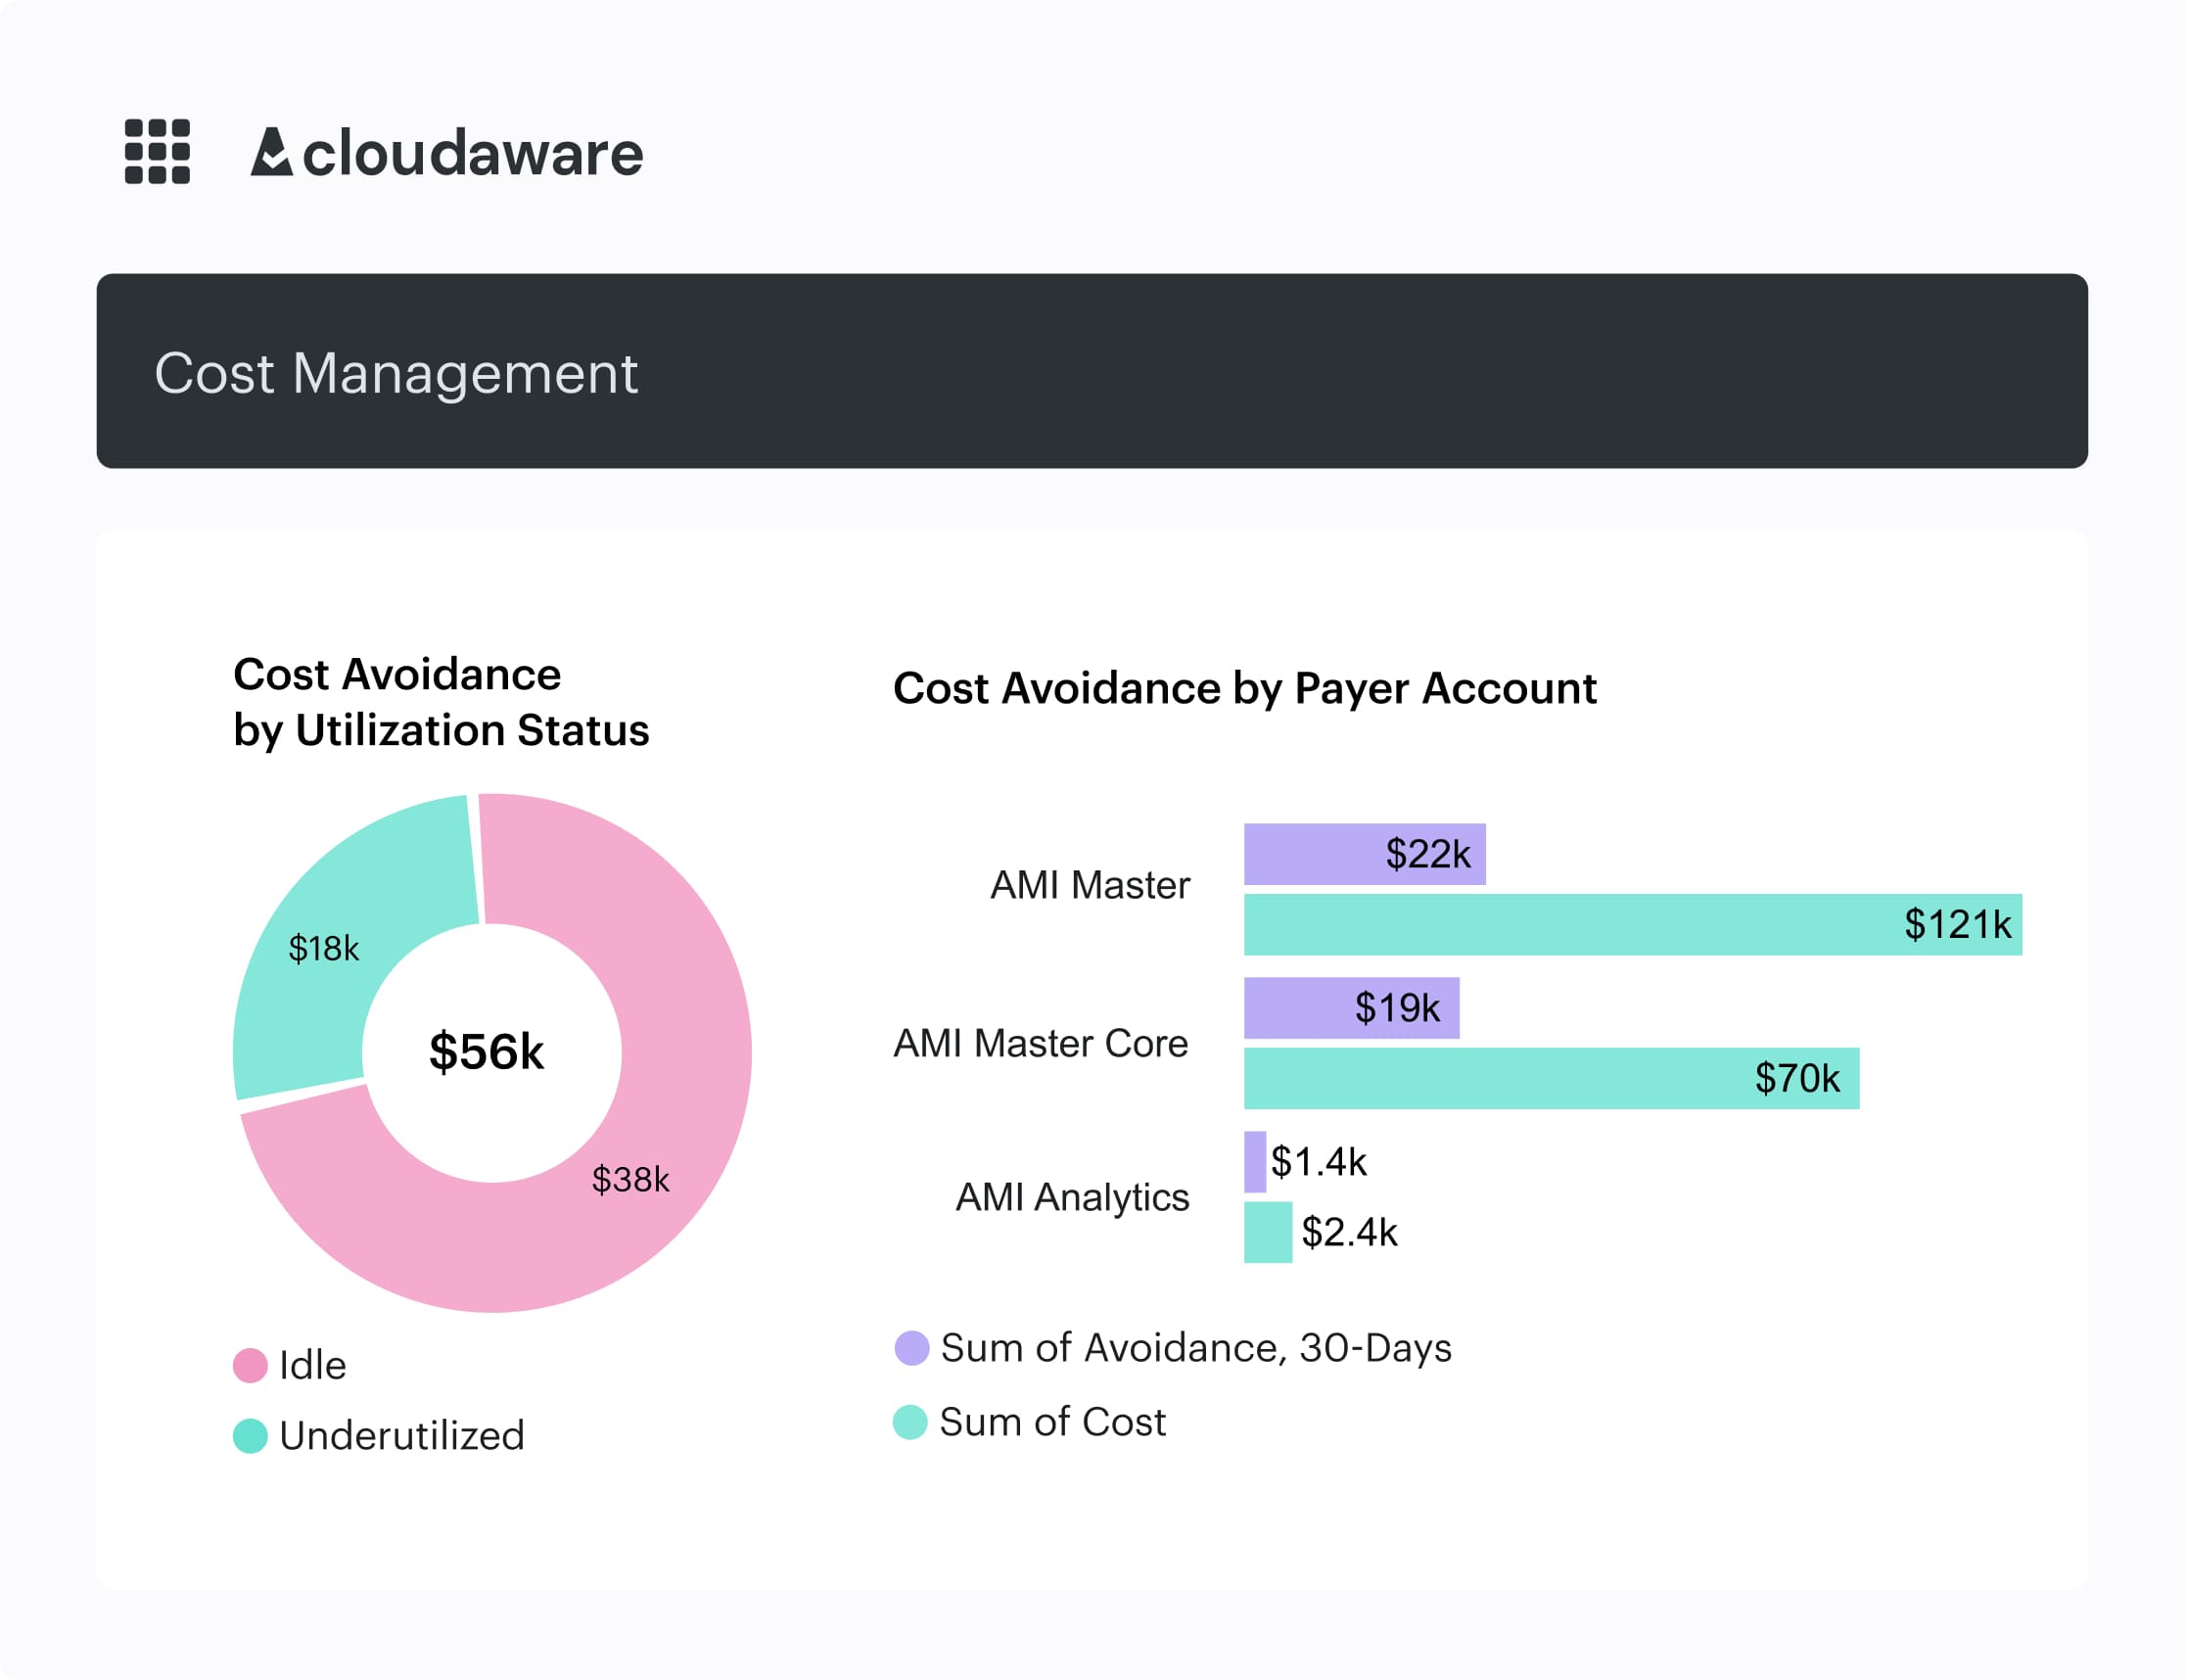
For example, Showback report element:
Imagine a dashboard where the Mobile App team sees their new feature cost $5,000 in AWS last month – and they can weigh that against the revenue it brought in. It’s eye-opening and encourages smarter decisions. Once people are accountable for their portion of the cloud bill, they start hunting for optimizations.
Idle test server on at midnight? Unused database instance? They’ll be motivated to right-size or turn it off. In short, ownership turns cloud spending from an abstract IT expense into a shared mission to use resources wisely.
Read also 👉 10 Cloud Cost Optimization Tools That Actually Reduce the Bill
Allocate shared and miscellaneous costs fairly
Not every cloud expense fits neatly into one team’s bucket. Think of costs like shared databases, networking fees, or an enterprise support contract – everyone uses them, so who gets the bill?
In multi-cloud setups, these often end up lumped into a vague “Miscellaneous” category, which isn’t helpful.
The solution is to distribute shared costs in a way that’s transparent and agreed upon. You might prorate them based on each team’s usage or user count, or assign a fixed percentage to each product.
FinOps tools can automate a lot of this heavy lifting. Cloudaware, for example, lets you apply tags, CMDB context, or custom rules to map support charges and other shared costs to the right cost centers or teams.
If one app consumes 70% of a shared service’s capacity, it can automatically shoulder 70% of that expense.
The benefit? You eliminate the black hole of “unallocated” infrastructure spend. Every dollar lands somewhere, so nothing falls into a gray area. This means when the CFO asks why the infrastructure bill spiked, you can explain it down to the last cent – including those usually-hard-to-attribute costs.
Read also 👉 IT Asset Disposition - How to Close the Loop on Retired Assets
Monitor and adjust continuously with alerts
Cost allocation isn’t a “set it and forget it” exercise – especially in the dynamic cloud world. Usage patterns change, new services spin up, others shut down, and teams might shift strategies. To keep allocations accurate, you need to monitor and refine on a regular basis.
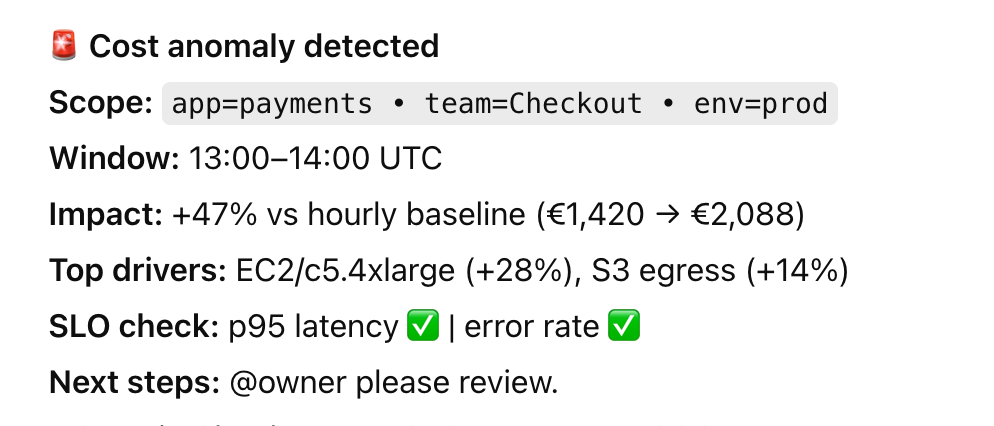
Set up alerts to catch anomalies or overspending early.
Cloudaware FinOps makes this easy by sending instant notifications when your app’s cloud spend forecast spikes or drifts off course. Did one team suddenly triple their GCP spend this week? You’ll know in time to ask why. Or perhaps an idle resource is sitting forgotten – Cloudaware’s built-in policies will flag that for you too.
Remember: the goal is zero last-minute bill shock at month-end. By reviewing reports frequently (many teams do it weekly) and leveraging automated alerts, you stay proactive. It’s like an ASO expert checking app metrics daily – you watch the trends so you can react before a small issue becomes a budget breaker.
And when you do find something off, loop back with the relevant team and adjust your tags, rules, or budget assumptions as needed. Continuous improvement is the name of the game.
Communicate and refine the strategy
Finally, make cloud cost allocation a living conversation in your organization. Share the insights with all stakeholders – not just finance. Developers, product managers, executives – everyone should see how their choices affect cloud spending.
Cloud cost data can be a storytelling tool: it reveals which features are expensive to run, which teams might need a heads-up about their usage, or where there’s potential to save.
Cloudaware facilitates this with customizable, shareable dashboards and a library of FinOps KPIs for every team. For example, you might show the engineering group a metric like “Percentage of Unused Resources” so they can track how well they’re optimizing.
An element of the Cloudaware FinOps dashboard. Schedule demo to see it live.
Encourage teams to ask questions about their portion of the bill and provide feedback. Maybe a developer spots an odd spike in their report – investigating it could uncover a rogue process to shut down or an opportunity to buy a reserved instance and save money.
Use those discoveries to refine your allocation model. Perhaps you need a new tag category, or a tweak in how you split a shared cost – go for it.
Over time, this open communication creates a culture where cloud costs become a regular part of planning discussions rather than an afterthought. Just as an app marketer iterates on campaigns using performance data, you’ll iterate on your cost allocation approach using cloud data.
The result is a practice that continuously gets better at driving accountability and efficiency.
With this process in place, you’ve transformed what could be an overwhelming multi-cloud tangle into a clear, actionable cost map. You know where every penny is going, who’s responsible for it, and how it ties back to business value.
Up next, we’ll explore the 7 most effective cloud cost allocation strategies to take your FinOps game even further.
7 most effective cloud cost allocation strategies
Directly from Cloudaware expert 😉
Build rule-based business mappings (accounts + tags → teams/products) for showback/chargeback
Once your tagging is in shape, you’re ready to move past spreadsheets and create something every FinOps team dreams of – a living cost map that updates itself. This is where rule-based business mappings come in.
Think of it like a content taxonomy for your cloud. You group related accounts, environments, and tags under one business unit – the same way an app marketer groups campaigns, creatives, and audiences under one product funnel. The logic turns chaos into clarity.
Inside Cloudaware, this happens in three steps:
- Define your business structure once. Start with how your teams actually work: apps, product lines, environments. Then, build rules in Cloudaware’s dashboard builder that match accounts and tags to that structure. For example, all AWS prod accounts + tags with
team:paymentsroll into the Payments BU automatically. - Apply rules across clouds. The mapping engine lets you align Azure subscriptions, GCP projects, and AWS accounts without manual sorting. It continuously updates as new resources appear, keeping your cloud cost reports current and comparable.
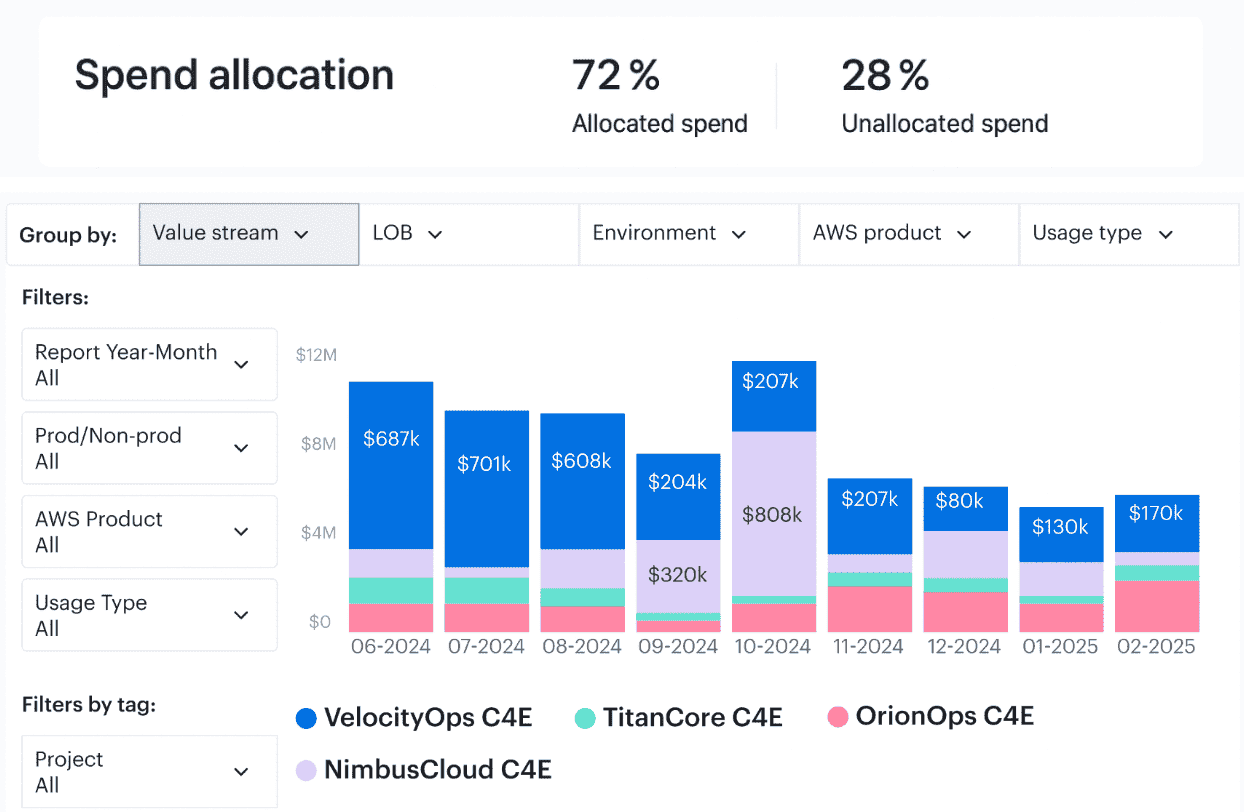
- Publish showback and chargeback views. Once the rules are live, Cloudaware’s report builder turns them into recurring exports or dashboards. Finance sees totals by BU. Product managers see their feature spend. Engineering sees their usage footprint. Everyone operates from the same data, without touching a CSV.
A clean cost allocation model like this gives every stakeholder one source of truth. It surfaces shared spend transparently, drives accountability, and makes cloud cost allocation part of everyday decision-making – not a quarterly surprise.
Split shared costs with simple, auditable drivers (GB, requests, CPU-hours)
Some resources don’t belong to just one team – they’re shared resources by design. Think NAT gateways, Kubernetes control planes, DNS zones, enterprise support contracts. Everyone uses them. No one wants to own the bill.
That’s where driver-based allocation comes in.
The allocation strategy here is to link shared costs to real-world usage metrics – GB transferred, CPU-hours burned, number of requests processed. That way, you assign costs based on consumption, not guesswork.
Here’s how teams do it:
- Set up buckets for shared costs – like “Networking,” “Security,” or “Shared K8s Infra.”
- Map each bucket to a usage driver – e.g., split NAT costs by outbound GB per VPC; divide Kubernetes control plane charges by running pod count per namespace.
- Join billing data with usage metrics – Cloudaware Advanced Reports lets you pull usage signals from AWS, Azure, or GCP, and link them to raw spend. That becomes your allocation logic.
- Tag the result with ownership – Cloudaware enriches this output with allocation metadata – product line, team, environment – so every cost finds a home in the right cost centers.
- Review and adjust monthly – You can document logic, assign reviewers, and schedule recurring exports for audit-ready transparency.
“You don’t need complex models. You need consistent ones,” said Rob Martin, a FinOps architect at Adobe*. “The best driver is the one your teams already understand and trust.”*
When done right, driver-based splits clear out your “Miscellaneous” bucket and give shared services the visibility they deserve. It’s a small shift that fixes a huge blind spot.
Reflect commitments & enterprise discounts correctly (report effective cost separately)
You know those Reserved Instances, Savings Plans, or CUDs your org keeps stacking? Great for cutting cloud bills – tricky for showing who actually saved what.
The raw invoice won’t tell you. It’ll just dump discounts across the board like glitter. So if you're a finance lead or FinOps manager, you're left guessing whether the teams using those resources are getting the benefit… or whether it's just smoothing out someone else’s overspending.
Here’s the fix: track effective cost – the real cost after commitments and discounts – and allocate it to the right teams, cleanly.
In Cloudaware, that means:
- Pull in raw billing data – including RI/SP/CUD usage, commitments, and discounts from AWS, Azure, and GCP.
- Match commitments to consumers – the platform maps usage back to the services, accounts, or projects that actually consumed those discounted hours or vCPUs. So you’re not spreading shared costs blindly.
- Report effective vs. on-demand side-by-side – dashboards in Cloudaware show what a team would’ve paid at on-demand rates versus what they actually paid after discounts. That delta? It’s your ROI from commitment planning.
- Document it all in your allocation model – you can add RI/SP logic to Cloudaware’s custom reporting engine, include commitment metadata, and send scheduled exports to Finance or BU owners – no manual management of spreadsheets needed.
The payoff? Instead of debates over discount fairness, you get clear attribution, smarter reforecasting, and better collaboration across organizations. Especially in multi-account, multi-cloud setups, aligning discounts to usage is what levels up your cloud cost allocation game.
Operate on a cadence: weekly showback, monthly chargeback, automated distribution
One-off reports don’t build accountability. Cadence does. That’s what makes weekly showbacks and monthly chargebacks a FinOps staple – they keep everyone’s eyes on the prize: aligned usage, smart allocation, and controlled cloud cost.
But let’s be real. Without automation, this rhythm becomes a full-time job. You’re exporting CURs, massaging Excel sheets, fielding questions from finance, and rechecking formulas at 11 PM before the MBR.
That’s where a solid process – and tooling – changes the game.
Here’s how FinOps experts put this cadence into motion:
- Lock your reporting rhythm. Showbacks every Friday. Chargebacks by the 5th. Engineering, finance, product – they all know what to expect, when. It builds trust in the data and confidence in decisions.
- Tailor views to your audience. Cloudaware lets you customize dashboards and exports by role. Teams see usage and cost allocation by app, environment, or feature. Finance sees % coverage, top deltas, and shared cost splits. No one’s digging for answers.
- Automate the delivery. Reports land as PDFs or Excel files in inboxes or shared drives – automatically. Need a billing breakdown by region for your Azure app group every Monday at 9am? Done. Want the full chargeback packet distributed to BU heads on the first? Also done.
- Track improvement. Layer in KPIs: tagging coverage, shared costs bucket size, forecast variance. Cloudaware tracks these over time so you can spot gaps early – and show progress in every review.
“The trick isn’t getting one clean report. It’s making clean reports normal,” said Ashley Hromatko, FinOps lead at Salesforce. “When your showbacks run like clockwork, teams stop resisting them. They start using them.”
A strong allocation model is only useful if people actually see and trust the results. By putting cost data on a cadence, you embed it into the rhythm of your organizations – not just the backlog of your ops team. That’s the kind of cost allocation habit that sticks.
Read also 👉 13 Cloud Cost Optimization Best Practices from Field Experts
Centralize multi-cloud ingest and scope access (RBAC) to the right cloud cost views
Every FinOps lead hits this moment eventually: too many teams, too many dashboards, too many opinions about what “real” cloud cost looks like. And once your organization spans three clouds – say, Azure, AWS, and GCP – it’s chaos if your data isn’t centralized and scoped cleanly.
The fix? One place to see it all. One way to access what matters.
Here’s how Cloudaware gets you there:
- Ingest once, view everywhere. Cloudaware pulls raw billing data from AWS CUR/DBR, Azure EA, and GCP billing exports. Doesn’t matter how your accounts are structured – the platform normalizes usage across clouds so your allocation model starts with apples-to-apples data.
- Scope access with RBAC. You don’t want the mobile app team poking around Kubernetes infra costs – and finance doesn’t need 1,000 SKUs per project. Cloudaware uses role-based access controls to scope who sees what: by account, app, BU, region – whatever your reporting needs.
- Create cost views tailored to your business. Once data’s in and access is locked, you can build allocation views: show spend by shared service, by feature, by team, or even by stage of development. And you can isolate shared costs with tagging or group logic – no more mystery buckets in month-end reviews.
- Lock consistency into your management flow. With everything centralized, your reviews get faster and cleaner. No more back-and-forth over whether that number came from AWS or Azure, or if someone ran the report from a different date range. You’re all using the same data source. Always.
No matter how your cloud estate grows, centralized views and scoped access keep your cloud cost allocation process clean, scalable, and sane. That’s the heartbeat of cost management in multi-cloud orgs.
Fund the rollout with quick wins: daily spend alerts & waste detection
Before you overhaul your cloud cost allocation, buy-in matters. Start with proof.
You don’t need months of tagging audits or org-wide policy rewrites to show value. Just surface what’s burning dollars today – and fix it fast.
Here’s how Cloudaware lets you do that:
- Turn on daily spend alerts. Get Slack or email pings when a team’s usage spikes, when a project’s forecast slips, or when your budget threshold breaks. You can scope it by account, product, even Azure subscription. Want alerts for top 10 spenders by delta? Done. This lets you act within hours, not wait for the invoice.
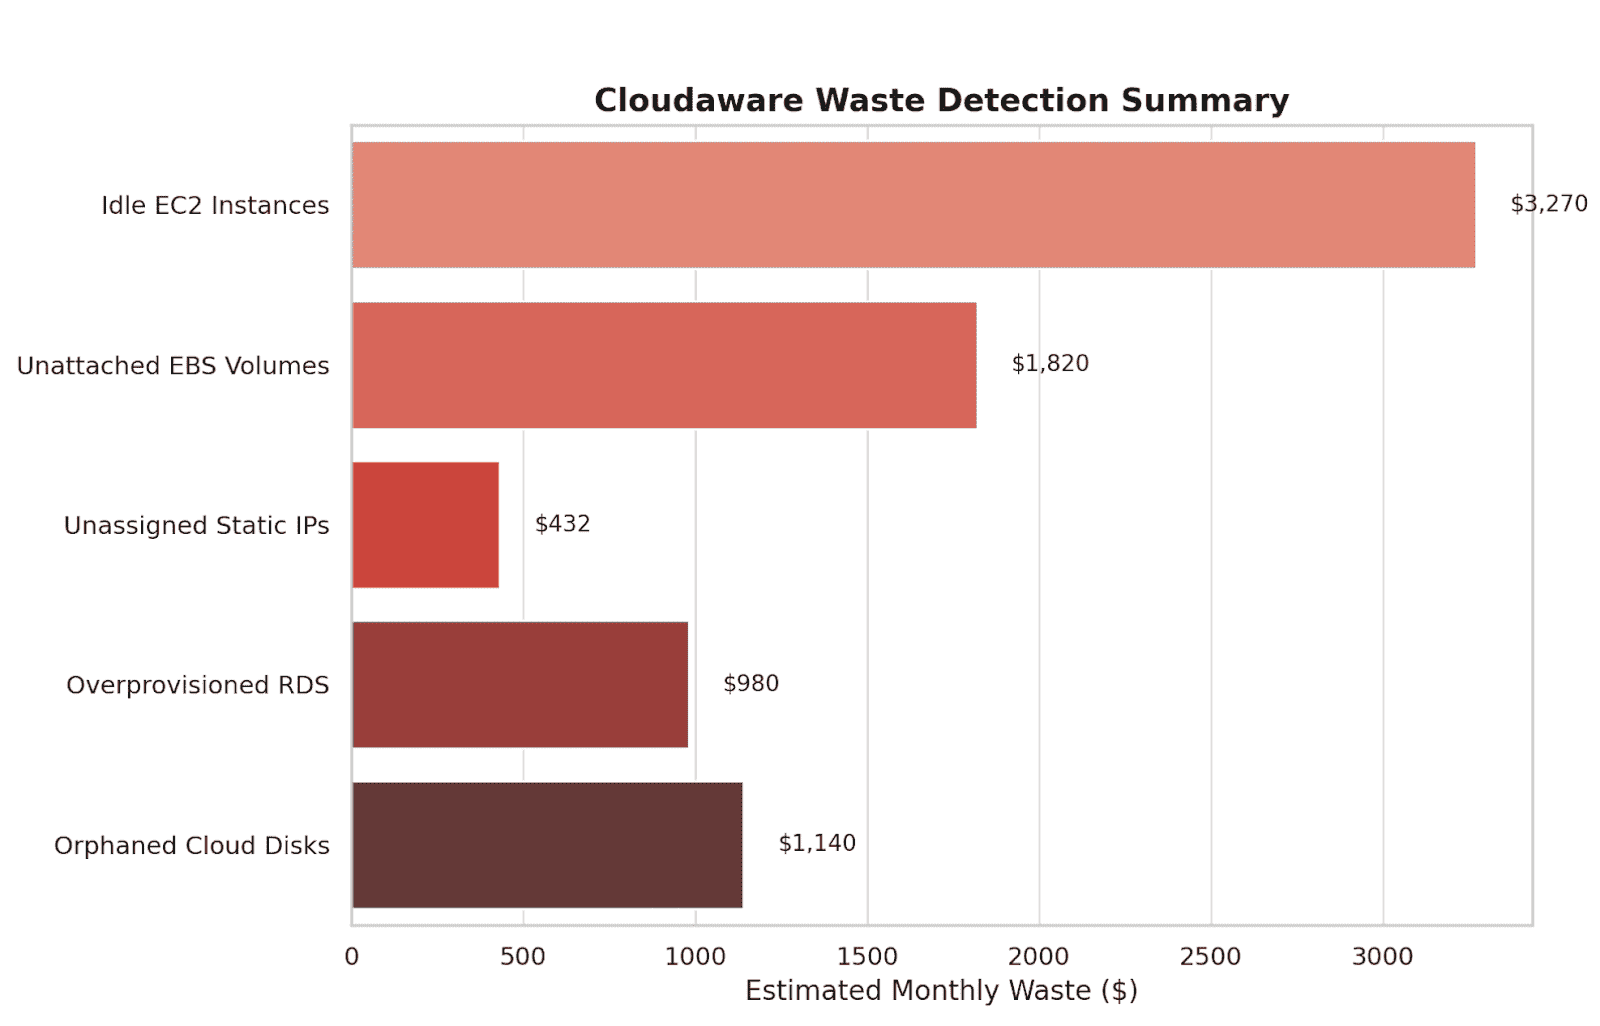
- Enable waste policies out of the box. Unused EBS volumes >10 days? Stale snapshots? Zombie NAT gateways? Cloudaware ships with 100+ waste detection policies mapped to common usage patterns – no need to write them yourself. Customize thresholds and push tickets to Jira or your internal workflow.
- Show savings by resource and timeframe. Roll those savings into a dashboard anyone – finance, management, app owners – can see. “This week we cut $3,450 by terminating unused instances across three environments.” That’s momentum. And it makes your case for investing in deeper cost allocation models.
- Document and reapply fixes. Tag the actions that led to savings. Build a policy for recurring cleanup. Add a lifecycle status to your CMDB and trigger automation when a shared cost hits a usage dip. That’s how this effort pays for itself.
Element of the Cloudaware FinOps report. See it live
Quick wins make your FinOps rollout tangible. They build trust across organizations. And they buy you the time and buy-in you need to scale a real allocation model.
How can Cloudaware help with cloud cost allocation strategy?
If your cloud bill feels like a black box, Cloudaware helps you crack it open – and tie every line item back to a team, product, or service.
This platform was built for FinOps managers, DevOps leads, and cloud architects who live in the loop between engineering and finance. It's already used by organizations like NASA, Coca-Cola, and Boeing – teams running thousands of cloud resources across AWS, Azure, Oracle, Alibaba, and GCP who need a single, trusted place to see and explain their cloud cost.
At its core? CMDB‑powered FinOps. Cloudaware maps cloud spend to business context – automatically, consistently, and across providers.
FinOps features you’ll actually use
- Multi-cloud billing ingest for AWS, Azure, and GCP. See blended and unblended rates side by side.
- Tagging analysis to track coverage, highlight schema mismatches, and shrink that “unknown” bucket fast.
- Advanced Reports to join cost data with usage drivers and split shared costs by GB, vCPU-hours, or custom rules.
- Daily spend and waste detection – idle disks, zombie NATs, unattached EBS volumes – surfaced before month-end.
- Showback/chargeback packet delivery by BU, app, or team – automatically distributed in PDF/CSV format on a cadence.
- Automation hooks via Force.com: trigger Jira tickets, Slack alerts, or custom webhooks when thresholds break or tags go missing.
It’s real-time, auditable, and aligned with FinOps maturity goals – from attribution and accountability to cloud cost forecasting and optimization.