


Last quarter, your cloud costs shot up, and nobody seems to know why.
Engineering swears nothing changed, finance wants answers, and your AWS account is now full of untagged resources eating through five figures a month.
That’s when cloud cost analysis tools start to earn their keep. They turn chaos into clarity, showing not just how much you’re spending but also where that money’s going and why it’s happening in the first place.
AWS Cost Explorer and similar dashboards only scratch the surface. They give you the numbers, not the story. Modern cost management platforms go deeper. They bring automation, tagging control, and FinOps workflows that connect cost data to the teams and systems behind it.
This guide walks through the top tools, the features that actually matter, and how to choose one that fits your multi-cloud setup. There’s no filler here — just what helps you cut waste, stay accountable, and finally see where your cloud budget really goes.
What is cloud cost analysis?
Cloud cost analysis is about understanding where your cloud money goes and why. It’s not just reading a bill; it’s connecting every dollar to the service, resource, or decision that created it. The goal is to turn a list of charges into a clear picture of ownership and intent.
When you get it right, you start seeing patterns instead of surprises. You notice waste before it grows, and your cost data begins to look like business data, not noise. Without that analysis, pinpointing the budget leaks becomes a challenge.
Key concepts and goals
The main idea is simple: clarity.
You collect all the usage and billing data, normalize it across providers, and map it to your internal structure: teams, applications, or environments. Once everything lines up, you can make sense of what’s driving the numbers.
A solid cost analysis framework usually delivers three things:
- Visibility: a complete and accurate view of total and unit costs by team, product, or environment.
- Responsibility: clear ownership and budgets tied to those costs.
- Optimization: the ability to spot idle or oversized resources before they waste money.
The goal isn’t just to lower bills. It’s to build predictable, sustainable cloud cost management, where finance and engineering finally speak the same language.
Read also: Cloud Cost Analysis for FinOps Teams: Full Playbook
Why visibility isn’t enough
Visibility alone doesn’t fix anything. Seeing that your monthly bill jumped 20% tells you something, but not why it happened. If you can’t trace that spike to a specific service or deployment, you’re still guessing.
Most dashboards stop at the surface-level metrics with no attribution. True analysis connects costs to configuration data, ownership, and utilization.
Read also: Top 7 CMDB Best Practices for Your 2025 [Tech Expert Review]
Role in FinOps and governance
In the FinOps cycle, the Inform → Optimize → Operate analysis defines the “Inform” stage. It provides both engineering and finance the context they need to make joint decisions. Reliable analytics are what drive the rest: allocation, forecasting, budgeting, and performance tracking.
From a governance standpoint, analysis enforces discipline. Tagging rules, anomaly detection, and integrations with ITSM systems like Jira or ServiceNow make cost accountability part of everyday operations.
Read also: Compare 12 Best FinOps Tools: Features, Price, Pros & Cons
How cloud cost analysis works
Every analysis process follows the same rhythm: gather, normalize, map, and act.
Different systems may go deeper or automate more, but the idea stays the same — raw billing data becomes usable information.
It all starts with clean, complete data.
Providers generate massive usage reports — AWS CUR, Azure EA, GCP BigQuery — each describing what ran, when, and at what price. Modern systems pull it automatically through APIs and combine it with usage from Kubernetes, VMware, or SaaS.
Accuracy matters most: if something’s missing, reports become meaningless.
Once data is collected, it must speak the same language.
AWS, Azure, and GCP all describe compute, storage, and networking differently. Normalization aligns those differences so terms like "compute" or "egress" mean the same thing everywhere.
Tagging gives data meaning by linking each resource to an owner or environment. Manual tagging doesn’t scale, so automation and policies keep labels consistent across teams.
Mapping connects usage to people and projects.
Good systems link accounts, namespaces, or configuration records so finance and engineering see the same truth — one by department, the other by workload. That structure enables showback and chargeback, giving teams a reason to optimize.
Static reports can’t keep up with how fast environments change.
Modern dashboards refresh continuously, flagging anomalies and trends as they happen. Historical baselines make it easy to spot spikes or drift, turning what used to be a month-end audit into a live feedback loop.
Read also: Proven FinOps Tagging Strategy Guide
Criteria for choosing the best cloud cost analysis tools
When choosing a cost analysis solution, you shouldn't only care about fancy dashboards. You should prove how reliable, accurate, and easy it is to use with other tools. The right platform must fit into your cloud and IT operation ecosystem you already use.
Here are the most important things that teams look for when choosing a platform for cloud cost analysis:
- Integration with Cloud Providers: The first thing to check is how well the platform talks to your clouds. It should pull data automatically from AWS, Azure, and GCP.
- Cross-Cloud Analytics: Good tools level the field between providers. Compute, storage, and network all have different pricing units, so the platform has to normalize them.
- Automated Tagging and Policy Control: Tag drift ruins every cost report. Look for systems that spot untagged resources and fix them automatically through policy-as-code.
- CMDB Context and Ownership Mapping: Tags aren’t always enough. A strong tool connects spend to business owners even when the metadata’s missing.
- Cost Visibility Dashboards: Dashboards should load fast, refresh daily, and let you pivot from total spend to team, app, or environment views. Execs need summaries; engineers need details.
- Allocation and Reporting: Built-in showback and chargeback reports are non-negotiable. Ideally, they can be scheduled like weekly Slack digests or monthly summaries that drop straight into your finance deck.
- Rightsizing and Recommendations: The platform shouldn’t just tell you what you spent, it should show where you’re wasting it. Utilization-based resize tips, commitment coverage stats, and projected savings all help drive real optimization.
- Anomaly Detection and Forecasting: Real-time anomaly detection keeps you ahead of surprise spikes, and usage-based forecasts give teams a chance to react before the budget slips.
- Security, Compliance, and Audit Trails: FinOps is still part of governance. Role-based access, SSO, and full change history are must-haves.
Read also: $1.5M in Cloud Cost Savings: Real Examples and FinOps Insights
Cloudaware
Capterra: ★★★★☆ 4.5/5
Trial days: 30
Best for: enterprise FinOps/DevOps teams with multi-cloud and hybrid on-prem estates seeking full cost-to-resource accountability
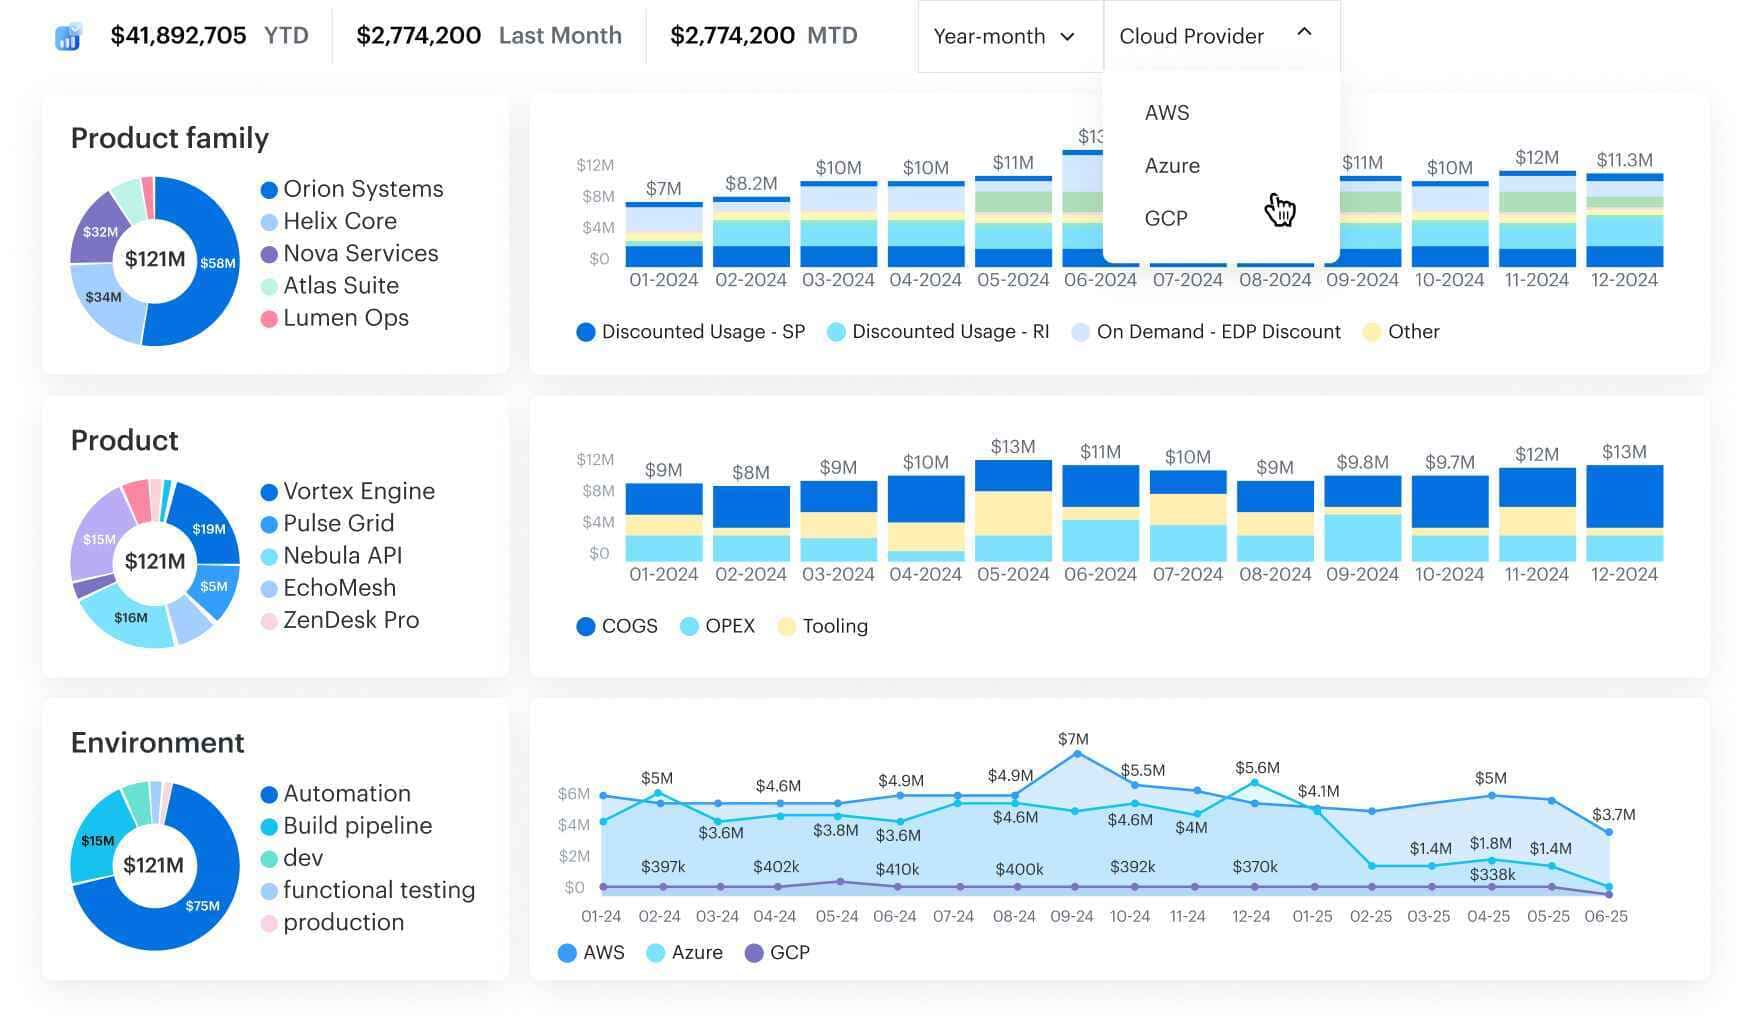
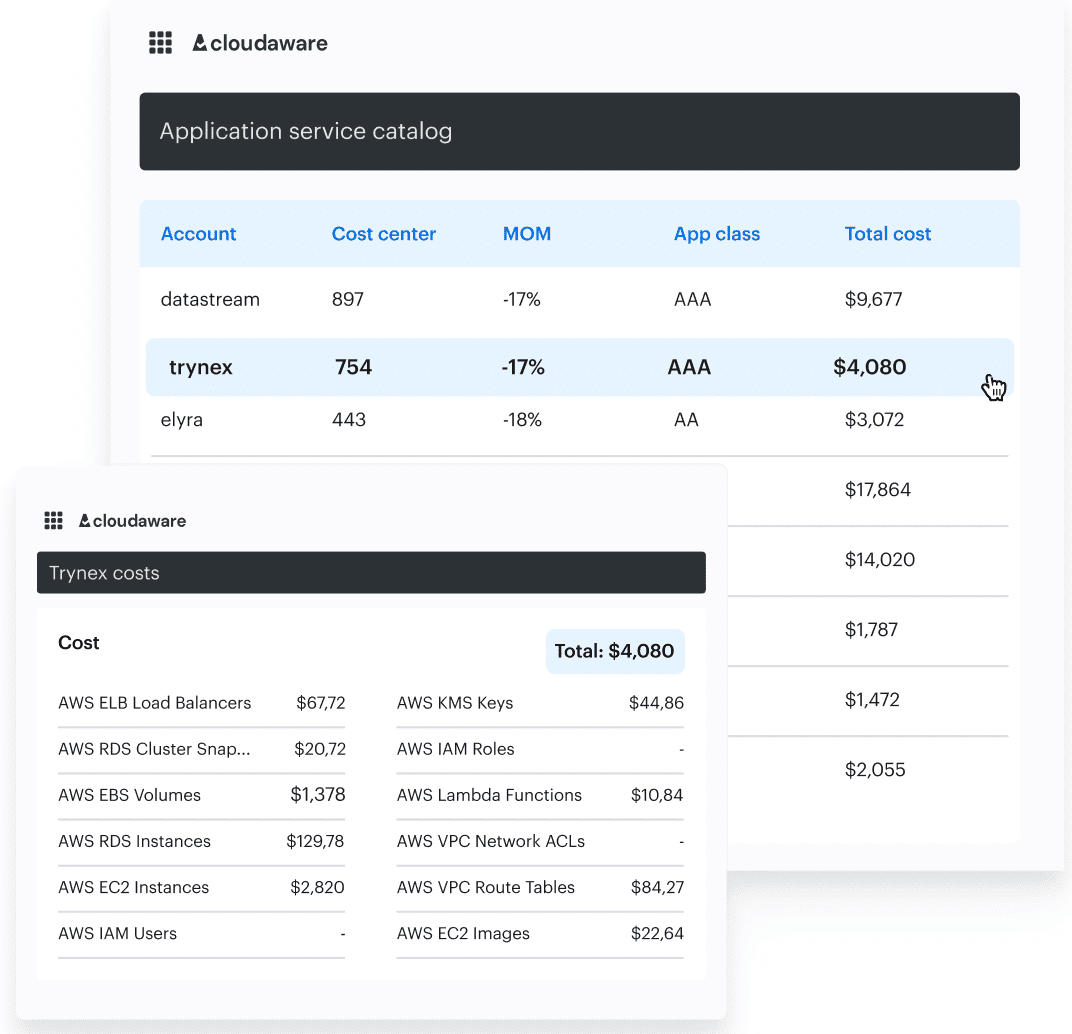
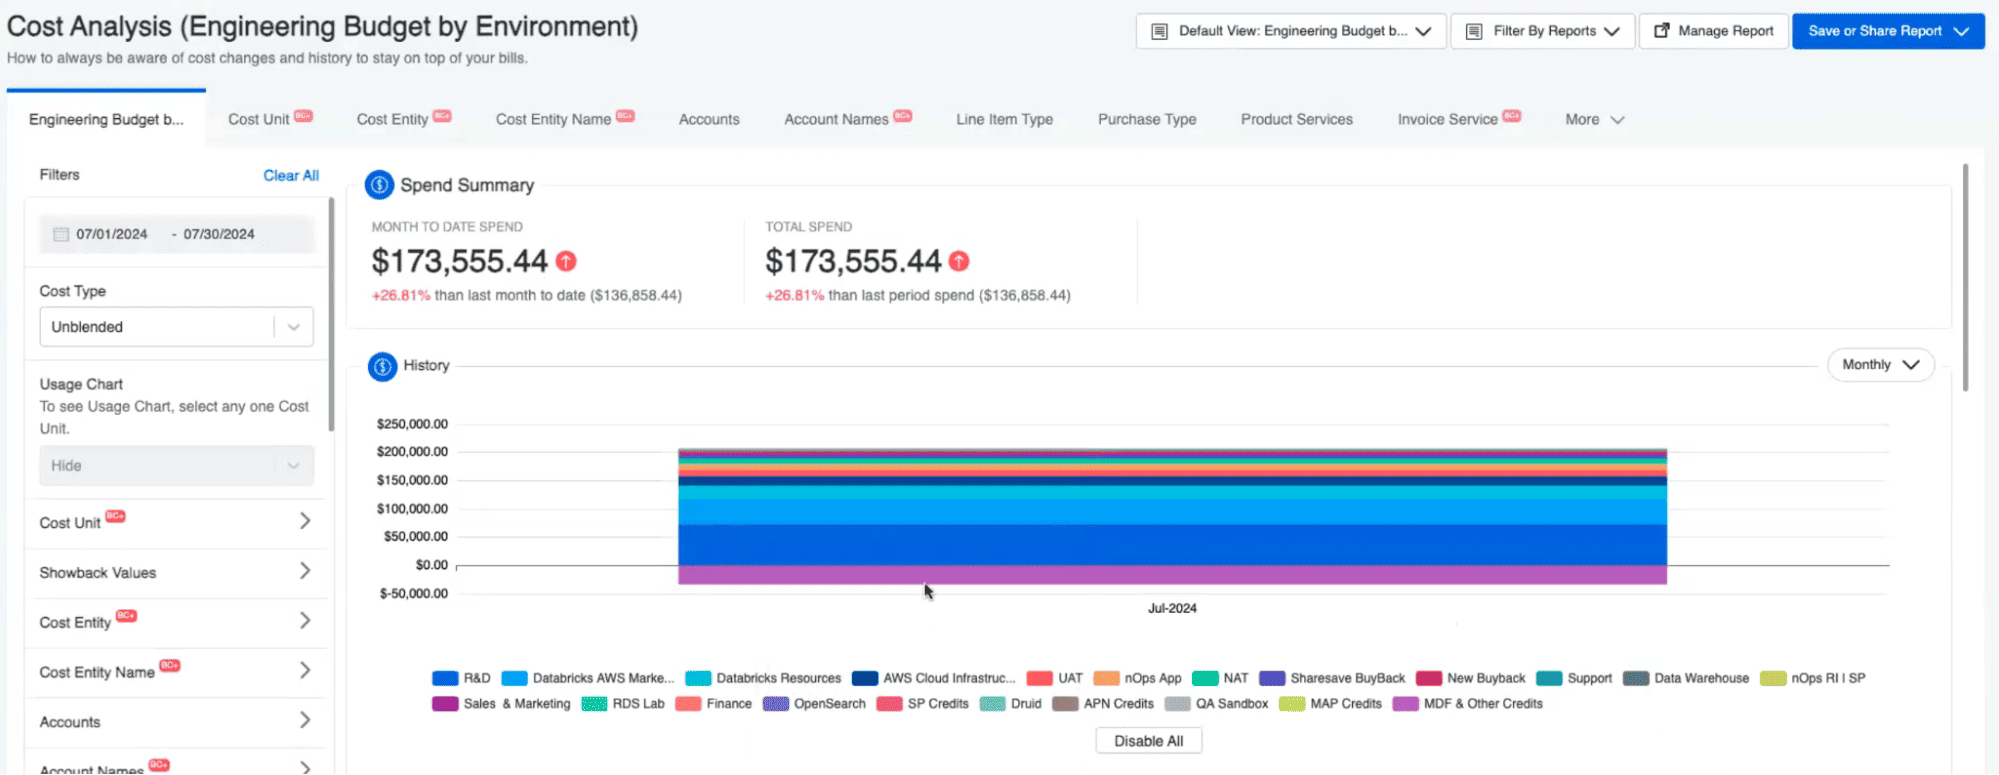
Cloudaware connects every dollar of cloud spend to the CI in your CMDB, which is something most FinOps tools can’t do. When you open an EC2 instance record, you don’t just see its cost — you also see the app that depends on it, the database it talks to, and the person responsible for the attached storage.
The platform works across AWS, Azure, Google Cloud, Oracle, and Alibaba, plus on-prem systems. It tracks not only cloud expenses but also vulnerabilities, compliance posture, and patch levels.
It’s the difference between seeing numbers and understanding them. The old “we can’t optimize it because we don’t know what it’s for” excuse disappears once every asset is mapped to its business purpose.
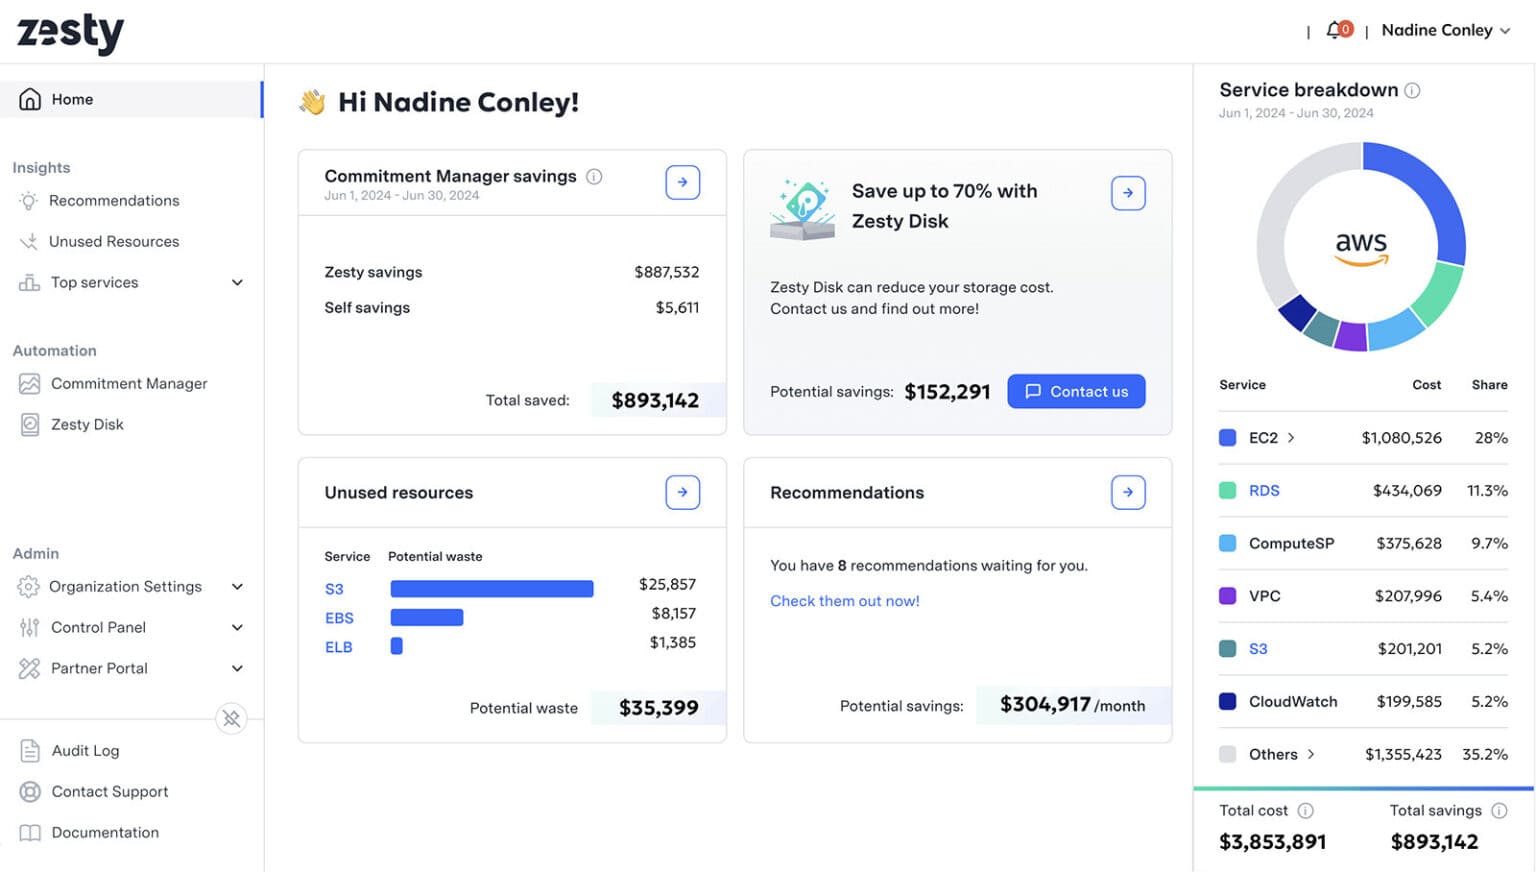
Example of Cloudaware’s FinOps dashboard with CMDB-enriched data
Features
- Cross-cloud analytics: native ingestion from AWS CUR, Azure EA, and GCP BigQuery, including amortized and blended cost metrics.
- Full CMDB context: enrich each configuration item with cost, owner, tag, and environment metadata.
- Tagging and policy enforcement: catch untagged or mis-tagged resources and apply rules automatically or alert owners.
- Live dashboards: daily-updated views for executives or engineers, supporting both top-down and workload-level breakdowns.
- Rightsizing and commitment coverage: detect idle resources, review RI/SP utilization, and manage storage tiering.
- Daily anomaly routing: send Slack, Jira, or ticket alerts with full context and likely root cause. See the full list of integrations.
- Showback and chargeback reports: map costs to products, teams, and business units, producing export-ready finance summaries.
- Forecasting and budgets: generate usage-based forecasts and send alerts when spend drifts from plan.
Pricing
Cloudaware’s pricing model starts at 50 servers and 1 user. The CMDB is the foundation, where every FinOps process starts. Without it, there’s no traceable cost story.
How it works:
CMDB Module: about $0.008 per configuration item (CI) every month. So, for example, maintaining 100 cloud servers would cost about $400 per month for the CMDB.
FinOps Module: adds automation for allocation, optimization, and reporting at +20% of the CMDB cost. In this case, $400 for CMDB and $80 for FinOps add up to $480 a month.
This model works well in mature cloud environments where costs and configurations go up together. It rewards teams that clean up inventory and tagging instead of punishing teams that bill more.
Pros & cons
✅ The ability to manage and deploy apps across different cloud service providers. Amazon Web Services.
✅ Strong cost-to-resource linking via CMDB: high clarity on spend, ownership, and configuration.
✅ Robust governance & policy enforcement: enables FinOps maturity, not just cost reporting.
✅ Dashboards are really flexible and give you real-time chargeback information.
⚠️ The platform offers extensive functionalities, and users may need time to become fully comfortable and proficient with all the features. Amazon Web Services.
Flexera One
G2: ★★★★☆ 4.3/5
Trial days: 60
Best for: large FinOps and IT governance teams managing multi-cloud estates with strict compliance requirements
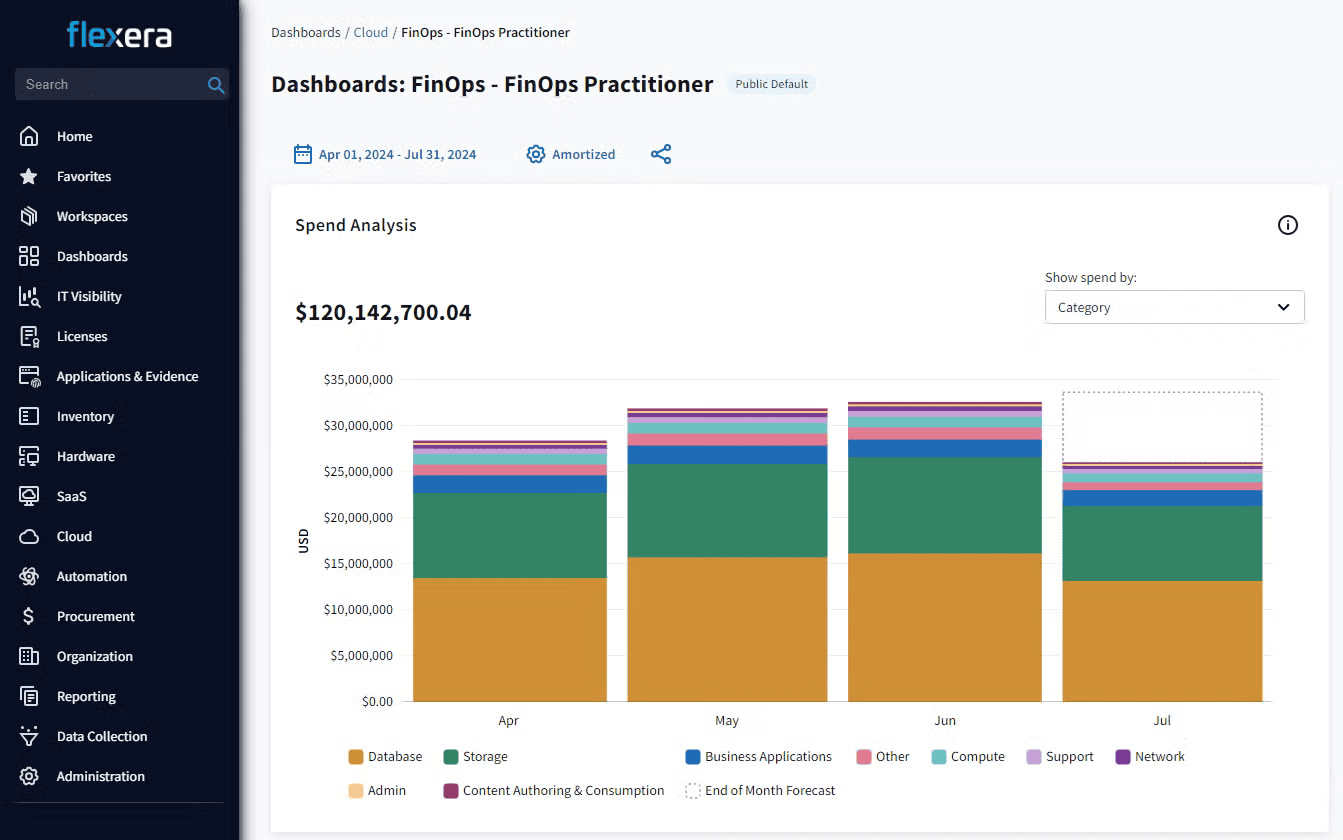 Image source.
Flexera One is one of the most established platforms for analyzing and governing cloud costs at the enterprise level. The Cloud Cost Optimization module combines visibility, automation, and compliance control inside one FinOps framework.
The platform focuses on policy-driven automation. Idle or oversized resources can trigger alerts, automatic shutdowns, or appear in rightsizing reports. Untagged assets are routed through governance checks before they distort next month’s bill. The system integrates with ITSM and CMDB tools, letting organizations tie every dollar to its owning service, team, or policy.
Features
- Normalization engine: Standardizes SKUs, metrics, and currencies for accurate cross-cloud comparison.
- Governance policies: Detect drift, untagged resources, or over-budget projects.
- Rightsizing and idle-resource analysis: Compute and database optimization with utilization-based recommendations.
- Commitment management: Plan and monitor RIs/Savings Plans coverage across providers.
- Anomaly detection: Receive alerts when cost spikes deviate from established baselines.
Pricing
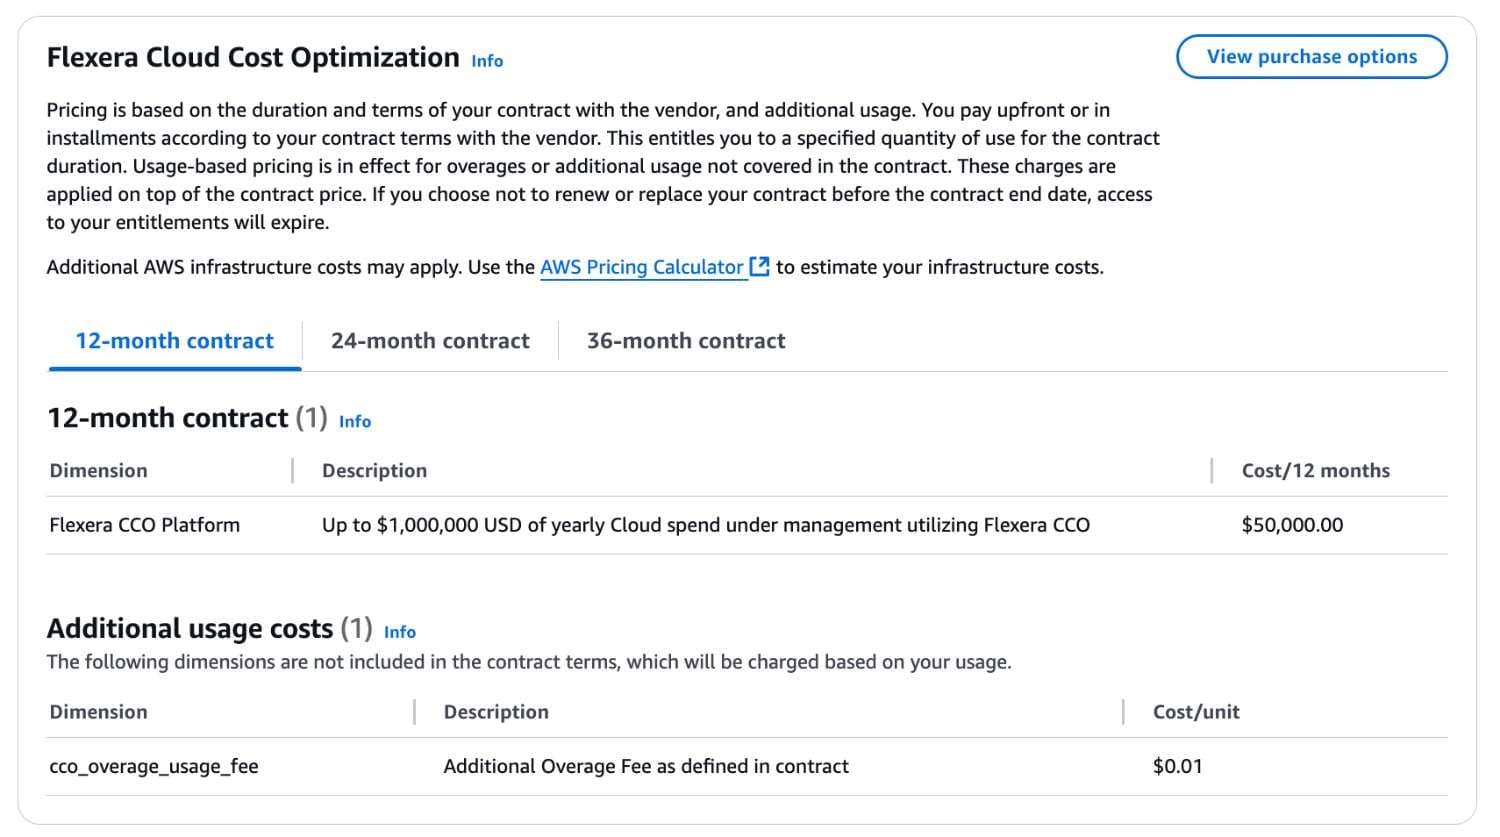 Image source.
Flexera uses an enterprise spend-based pricing model, usually starting around $50,000 per year for managing up to $1M in annual cloud spend. Beyond that, pricing scales predictably with usage and module selection.
Pros & cons
✅ Flexera’s automation policies help enforce budgets, tagging, and lifecycle rules across clouds. G2.
✅ Easily connects cost data with ServiceNow and SAP for audit-ready chargeback and forecasting. Gartner.
⚠️ Initial setup and normalization take time and dedicated support to configure. G2.
⚠️ Strong features, but the interface can feel heavy and the data refresh cycle long. Reddit.
Read also: 10 Cloud Cost Optimization Tools That Actually Reduce the Bill in 2026
CloudZero
Capterra: ★★★★☆ 4.5/5
Trial days: 14
Best for: engineering-led FinOps teams that need precise visibility into where and why cloud costs change
CloudZero focuses on how engineers actually build and run systems. It maps every dollar of cloud spend to real-world constructs — services, features, environments, and even individual releases. That’s why many DevOps and platform teams see it as a visibility layer for engineering, not finance.
The platform ingests cost and usage data from AWS, Azure, and GCP, combines it with CI/CD and observability signals, and shows how architectural choices affect efficiency. For example, a team can see how much a new API endpoint or batch job added to monthly costs right after deployment.
Features
- Event-driven cost mapping: correlates cloud spend with product releases, environments, and repositories using tags and telemetry.
- Cross-cloud ingestion: supports AWS, Azure, GCP, and Snowflake, normalizing spend across all major providers.
- Kubernetes cost tracking: breaks down workloads by namespace, service, and pod to show over-allocated or idle capacity.
- Real-time anomaly alerts: identifies spend spikes right after deployments and pushes notifications to Slack or Jira.
- Unit economics dashboards: tracks cost per customer or transaction, helping teams measure profitability.
Pricing
CloudZero charges based on how much cloud spend you analyze through the platform, not on the number of users.
The base plan usually starts around $1,500–$3,000 per month for up to $1 million in managed cloud spend, and scales from there. On average, pricing lands between 0.3% and 1% of the analyzed spend, depending on volume and integrations.
Pros & cons
✅ Lets engineers see how their architectural choices impact spend, not just totals per account. G2.
✅ Fast and clean dashboards with near real-time refresh and intuitive navigation. Reddit.
⚠️ Even though it supports Azure and GCP, users report that “most of the deeper insights still come from AWS integration.” G2.
⚠️ Several enterprise reviews note that “the per-spend model is fair but can feel expensive once workloads scale into high-data pipelines. Gartner.
Read also: 7 Best Cost Allocation Software 2025: Tools, Features & Pricing
IBM Cloudability (Apptio Cloudability)
G2: ★★★★☆ 4.3/5
Trial days: 30
Best for: enterprise FinOps and cloud-financial teams managing complex multi-cloud estates
Cloudability is built to turn complex cloud usage and billing data into actionable insights for both finance and engineering. It ingests cost and usage data from AWS, Azure, GCP (and Kubernetes/containers), normalizes it, and gives teams a unified view of cloud spend, allocations, and efficiency.
Unlike simple dashboards that just show “_how much_”, Cloudability helps you ask “*who spent, on what, and how efficient was that spend?*” By linking bills to business units, services, tags and usage patterns, it supports showback/chargeback, forecasting and rightsizing.
Features
- True Cost Explorer: provides visual pivot-type views across cloud providers, cost categories, BUs, and applications.
- Multi-cloud cost ingestion & normalization: supports AWS, Azure, GCP billing exports, usage data and unifies metrics.
- Cost allocation / business mapping: allows mapping of spend to applications, teams, cost centers, etc.
- Forecasting, budgeting and commitment optimization: automates RI/SP/savings-plan analysis, rightsizing recommendations, and cost forecasts.
- Integrations and automation: connects with Jira, Datadog, PagerDuty and others.
Pricing
Cloudability uses a spend-based enterprise pricing model. According to pricing research, starting around $30,000 per year for up to ~$1 million in cloud spend monitoring/analysis, scaling upward as spend increases.
| Plan | Managed Cloud Spend | Annual Cost |
|---|---|---|
| CLDY1MYEAR | Up to $1M | $30,000 |
| CLDY3MYEAR | Up to $3M | $76,680 |
| CLDY6MYEAR | Up to $6M | $132,480 |
This model suits large organizations where cloud spend is substantial and cost transparency is a business requirement. It may be less optimal for small teams or simple single-cloud setups.
Pros & cons
✅ A clear breakdown of cloud spend across AWS, Azure, GCP, and IBM Cloud. G2.
✅ Tagging functionality has helped us accelerate our FinOps journey and bring accountability of spending. G2.
⚠️ Huge cost difference between reporting and container insights; views created with BM or tags are not supported for most of the cloud ability features. G2.
⚠️ You can avoid certain instance types for EC2 in AWS, but you can't do the same for EBS and avoid SC1 storage. This leads to a lot of rightsizing alerts. G2.
Read also: Cloud Cost Optimization - The Complete 2026 FinOps Guide
Finout
G2: ★★★★☆ 4.5/5
Trial days: 14
Best for: FinOps, DevOps, and Finance teams that need full cost-allocation clarity, shared-resource handling, and unit-economics insights across multi-cloud estates
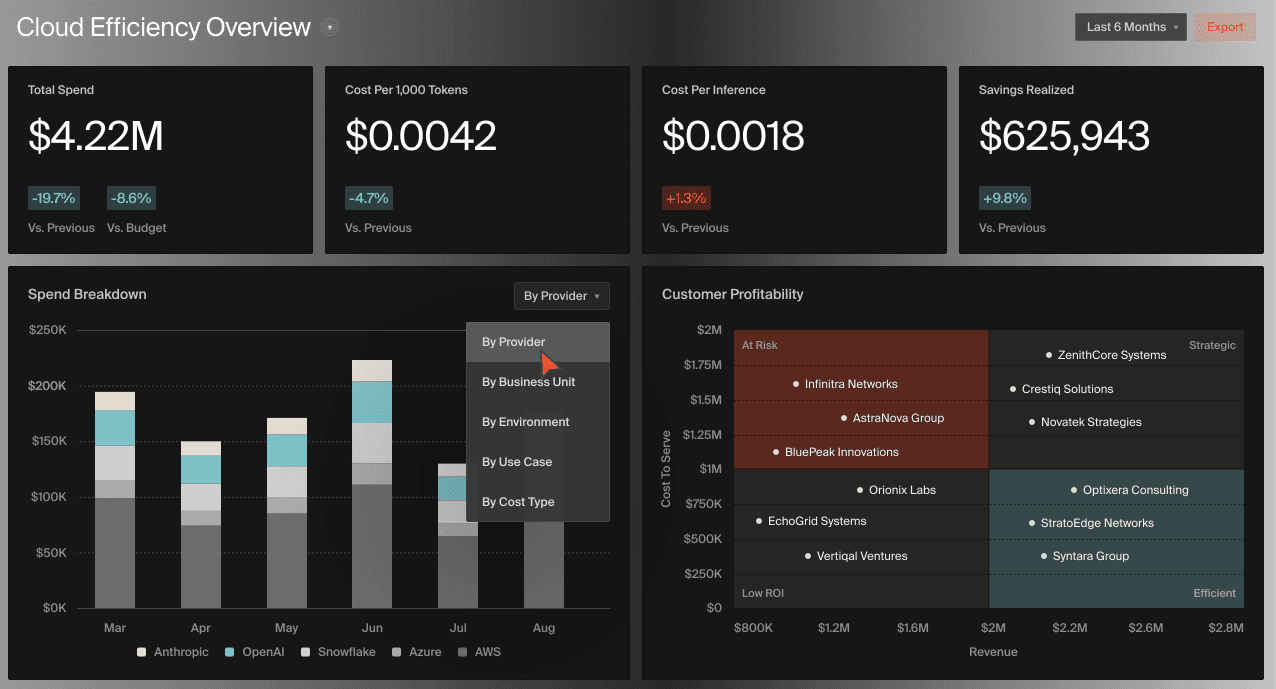
Finout is built to deliver 100% cost allocation and deep visibility into cloud spending — even when tagging is incomplete or infrastructure is complex. It targets environments where shared resources, multi-cloud services, and container platforms blur cost boundaries.
By treating cloud spend as a strategic metric, Finout helps organizations translate usage into operations-ready insight — not just show how much, but reveal who consumed it, why, and how to act.
Features
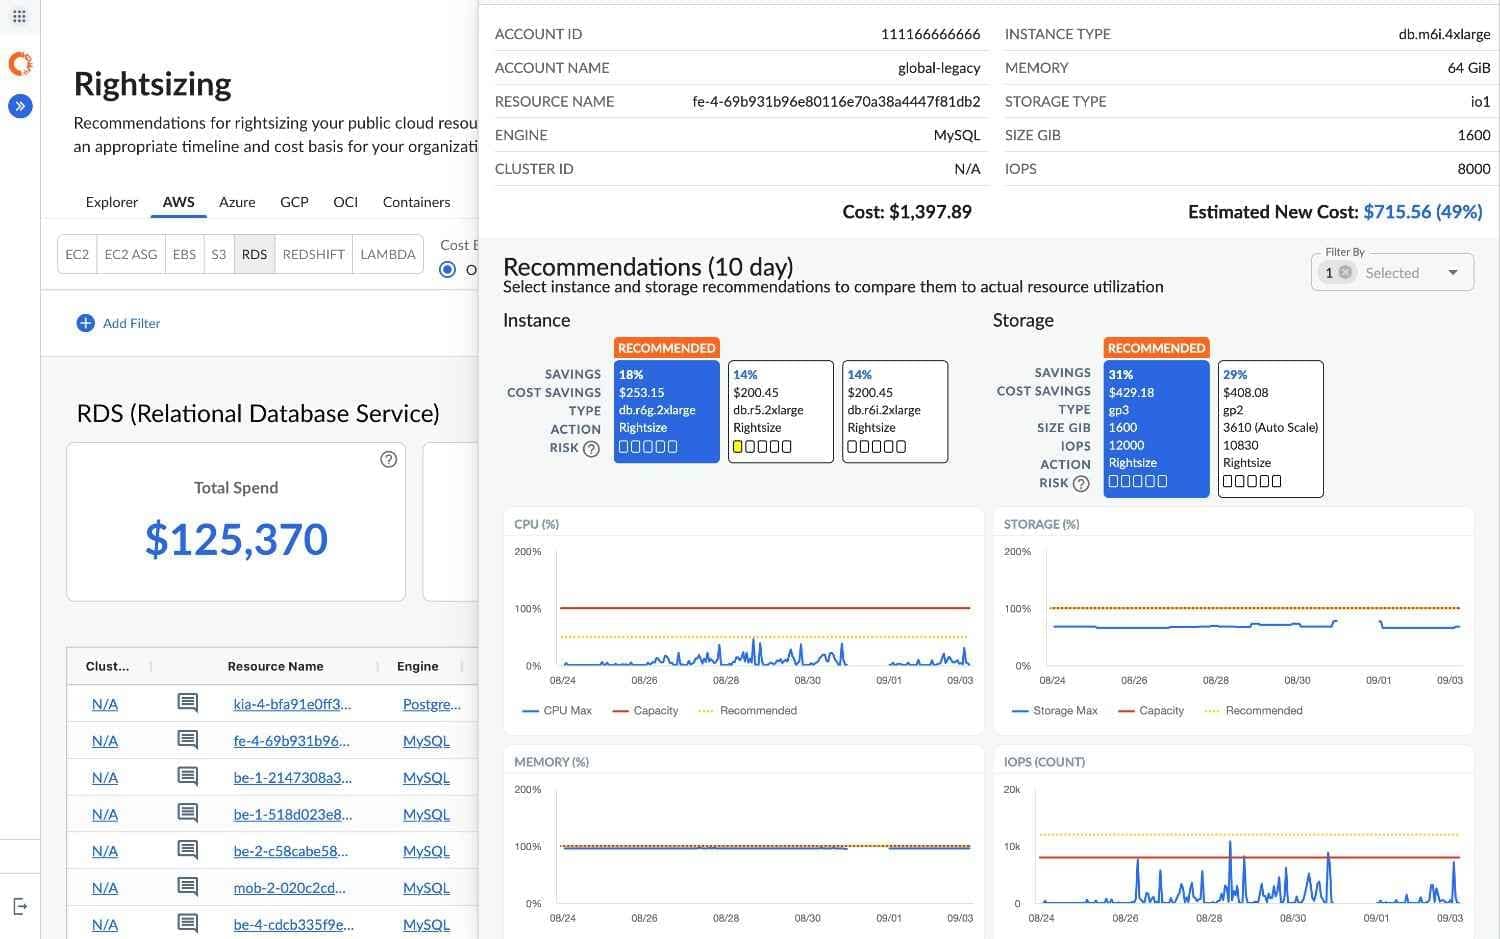
- Cross-cloud cost ingestion: pulls AWS CUR, Azure EA, GCP BigQuery, and SaaS billing data into a single normalized model.
- Virtual tagging and shared-cost allocation: redistributes spend from shared or untagged resources automatically, maintaining allocation accuracy without manual tagging.
- CostGuard anomaly detection: identifies abnormal spikes or trends and routes them to owners with context.
- Unit economics view: tracks cost per transaction, feature, or customer to align engineering work with product efficiency.
- Scalable architecture: agentless setup, RBAC/SSO, and support for large datasets and multiple clouds.
Pricing
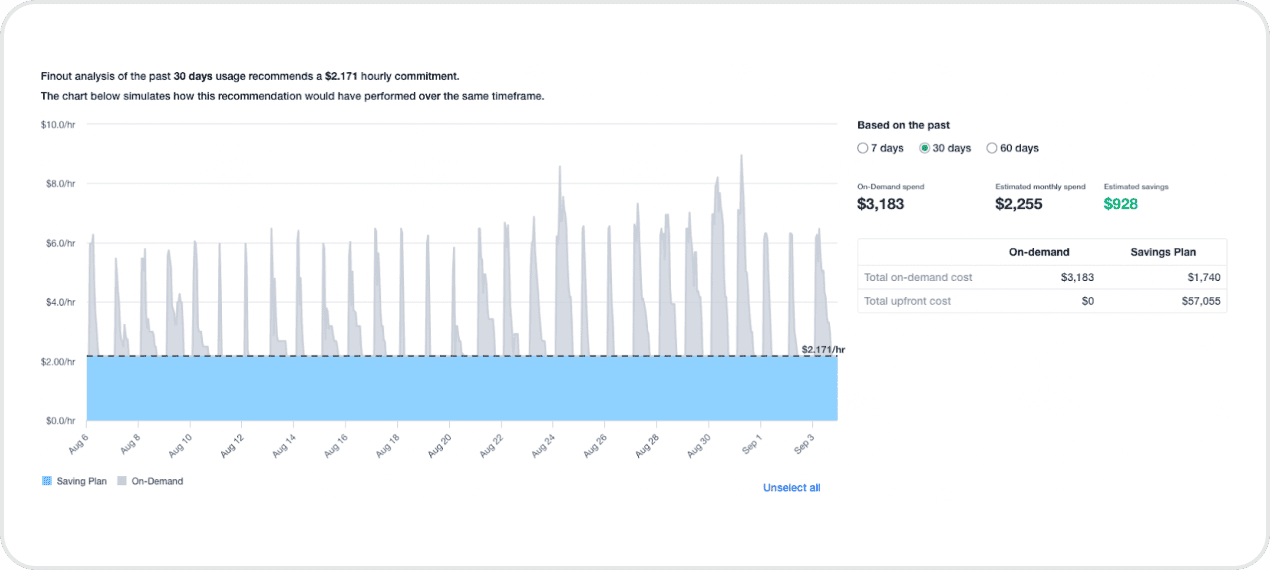
Finout uses fixed monthly plans based on your yearly cloud spend. Pricing stays predictable. You choose a plan and connect your bills. There are no hidden fees or overage charges.
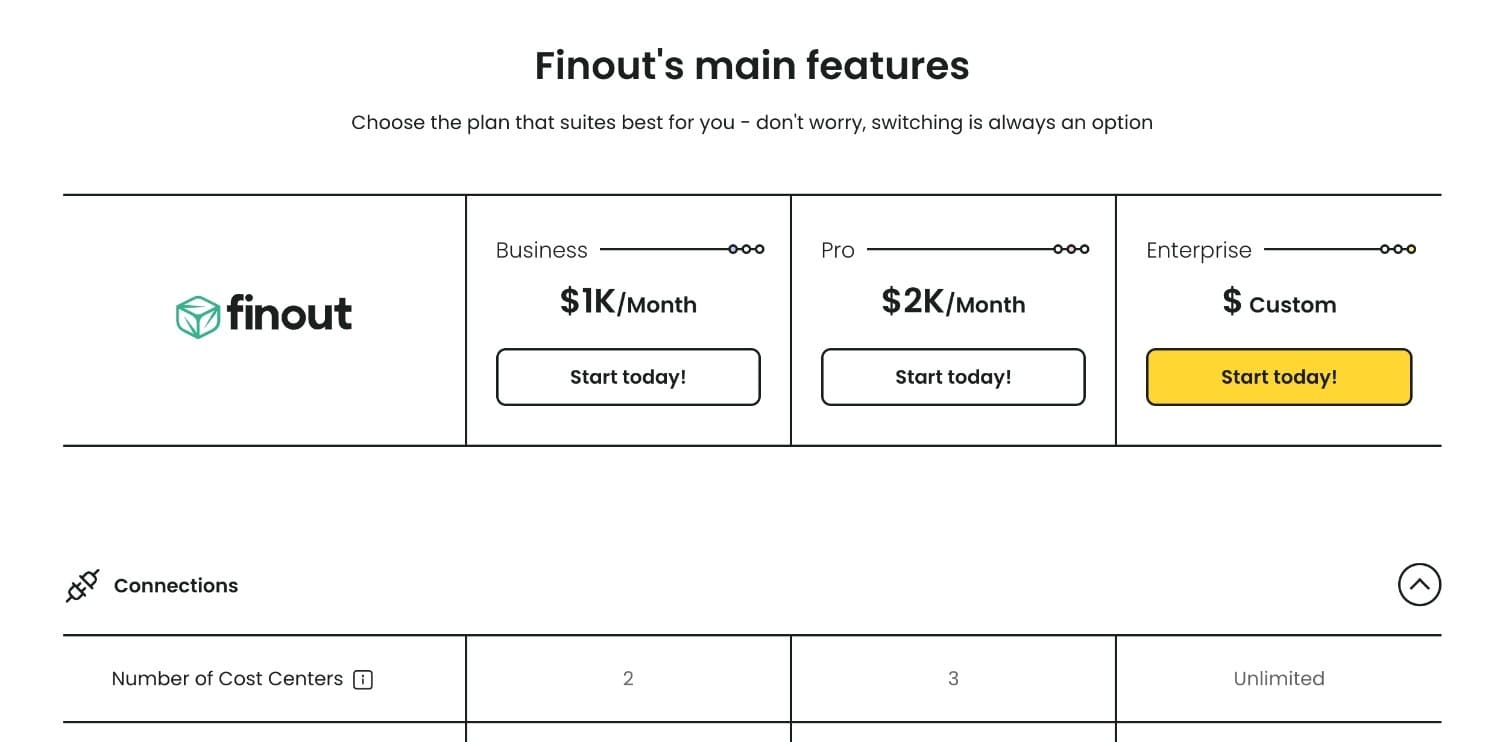 Image source.
For example, a company managing $500,000 in annual cloud spend might pay around $12,000–$15,000 per year to run Finout. Finout usually covers this expense by finding 5–10% of hidden waste in shared resources or unused services. The model fits teams that want to achieve cost optimization through visibility and actionable data before automating changes.
Pros & cons
✅ Virtual tagging and shared-cost features allow accurate allocation without forcing full tag compliance.
✅ Real-time anomaly detection and alerts. G2.
⚠️ Not enough visualization options for comparing costs of a selected time period to a previous period of the same length. G2.
⚠️ Occasionally, some reports load slower than expected when handling large datasets.
Read also: Automated Asset Management: From Tag Spaghetti To Clean Inventory
Zesty
G2: ★★★★★ 4.8/5
Trial days: 14
Best for: DevOps and FinOps teams managing dynamic AWS workloads that constantly change in size and demand
Zesty is an optimization tool that focuses heavily on infrastructure cost reduction. It dresses up as a cloud cost analysis tool by automating rightsizing, commitment/discount optimization, and storage adjustment around AWS compute, storage, and container workloads.
In practice, Zesty ingests usage data from your cloud accounts, applies machine-learning-based algorithms or policy rules to identify waste, and then executes or recommends actions. For example, the platform’s Commitment Manager automatically manages AWS Reserved Instances or Savings Plans, while Zesty Disk adjusts storage volumes in real time.
Features
- Automated rightsizing of compute, containers, and storage across AWS accounts.
- Commitment (Reserved Instances/Savings Plans) optimization: Buy and sell based on usage trends to maximize discount coverage.
- Compute rightsizing and spot-instance management: Analyze compute workloads and adjust resources automatically, scaling down idle capacity or using discounted spot instances when it’s safe to do so.
- Live cost tracking and reporting: The system consolidates cost and usage data across compute and storage, showing real-time changes, savings, and usage patterns in one place.
- Waste detection and proactive optimization: Identify idle or underused resources and adjust them before they generate unnecessary spend.
Pricing
Zesty breaks down its pricing into a base fee plus usage-aligned pricing per resource managed (vCPU or storage) or savings generated.
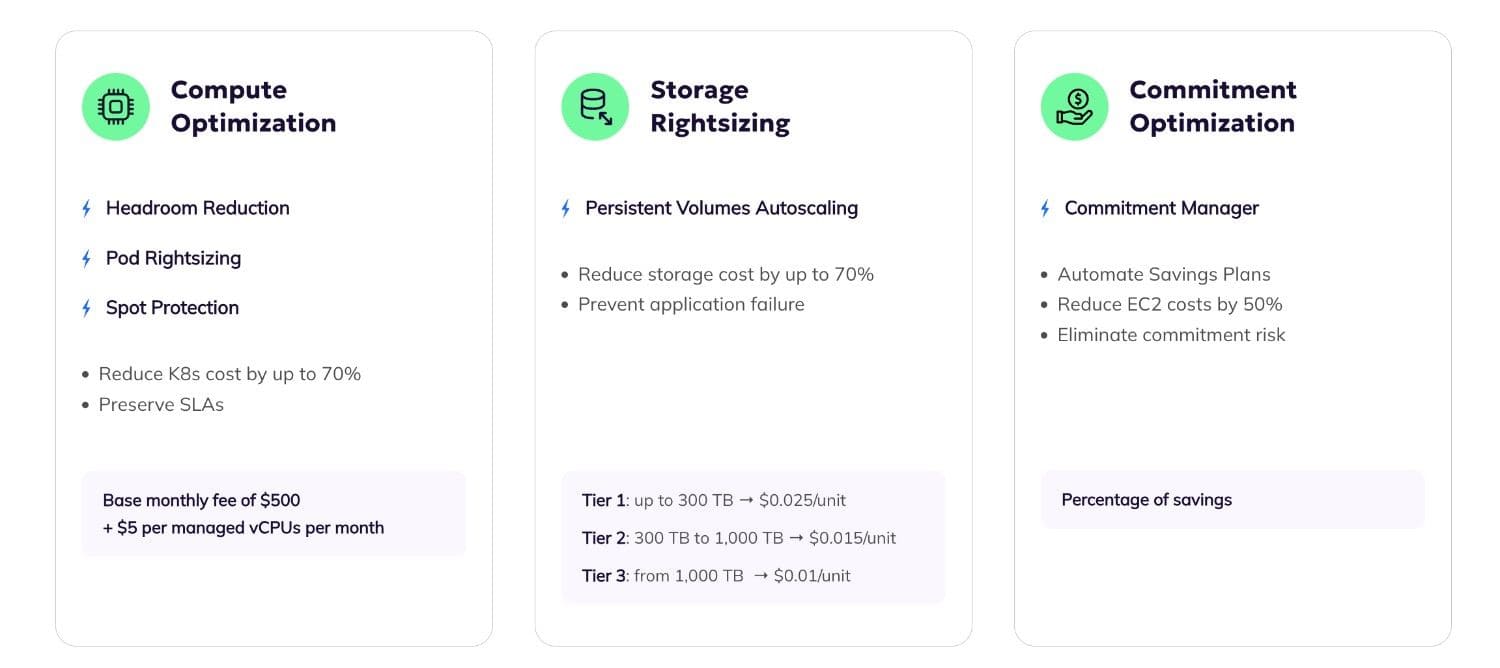
In another model (AWS Marketplace listing), the tool is priced at a fixed platform fee (e.g., $250/month) plus a “savings fee” tied to each dollar of saved commitment. This kind of pricing suits teams where bill control is urgent and infrastructure is large enough that traditional licensing would be inefficient.
Pros & cons
✅ Strong discipline on commitments and storage rightsizing. The platform makes visible what many teams struggle to track manually. PeerSpot.
⚠️ Primarily AWS-focused. While multi-cloud support is claimed, feature depth outside AWS is reported as less. G2.
⚠️ Smaller feature scope for finance/FinOps workflows. Some users mention limited out-of-the-box reporting for allocation or showback models. G2.
Read also: Cloud Cost Optimization Metrics - 18 KPIs FinOps Track
CAST AI
G2: ★★★★★ 4.8/5
Trial days: available
Best for: DevOps teams running Kubernetes at scale who need real-time cost control, not just monthly reports
CAST AI is a real-time automation engine for Kubernetes cost efficiency. That’s exactly why it fits into the cloud costs analyzing space. Most analysis platforms stop at showing you where the money went. CAST AI takes the next step and adjusts the cluster automatically so the next bill is smaller.
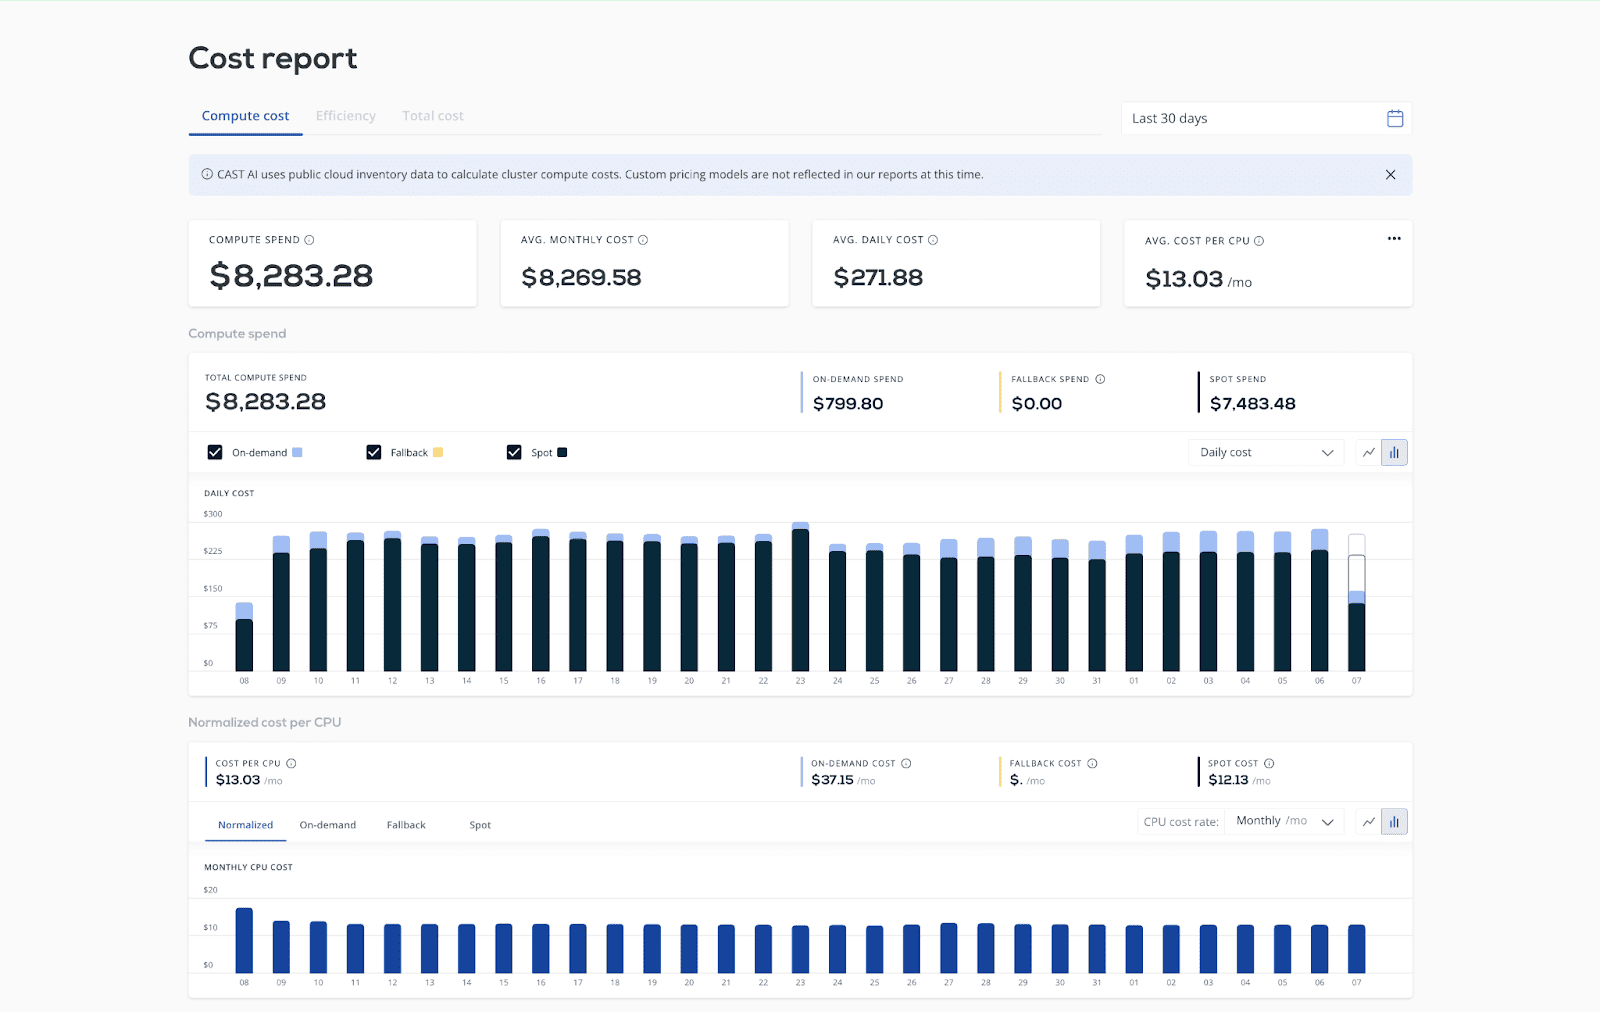
Where traditional tools work with monthly billing data, CAST AI reads Kubernetes metrics directly from the cluster. That means it can show the cost of every namespace, deployment, or workload almost instantly and link those numbers to utilization.
Features
- Automated node rightsizing: continuously adjusts instance types and sizes to match real demand.
- Spot-instance automation: replaces on-demand nodes with cheaper spot capacity when reliability allows.
- Multi-cloud optimization: supports AWS, Azure, and GCP clusters from a single control plane.
- Real-time cost dashboard: shows spend per namespace and workload with live utilization data.
Pricing
CAST AI’s pricing follows a savings-based model. The platform charges a percentage of the savings it achieves through optimization — currently around 20% of verified monthly savings, with a free plan available for visibility only.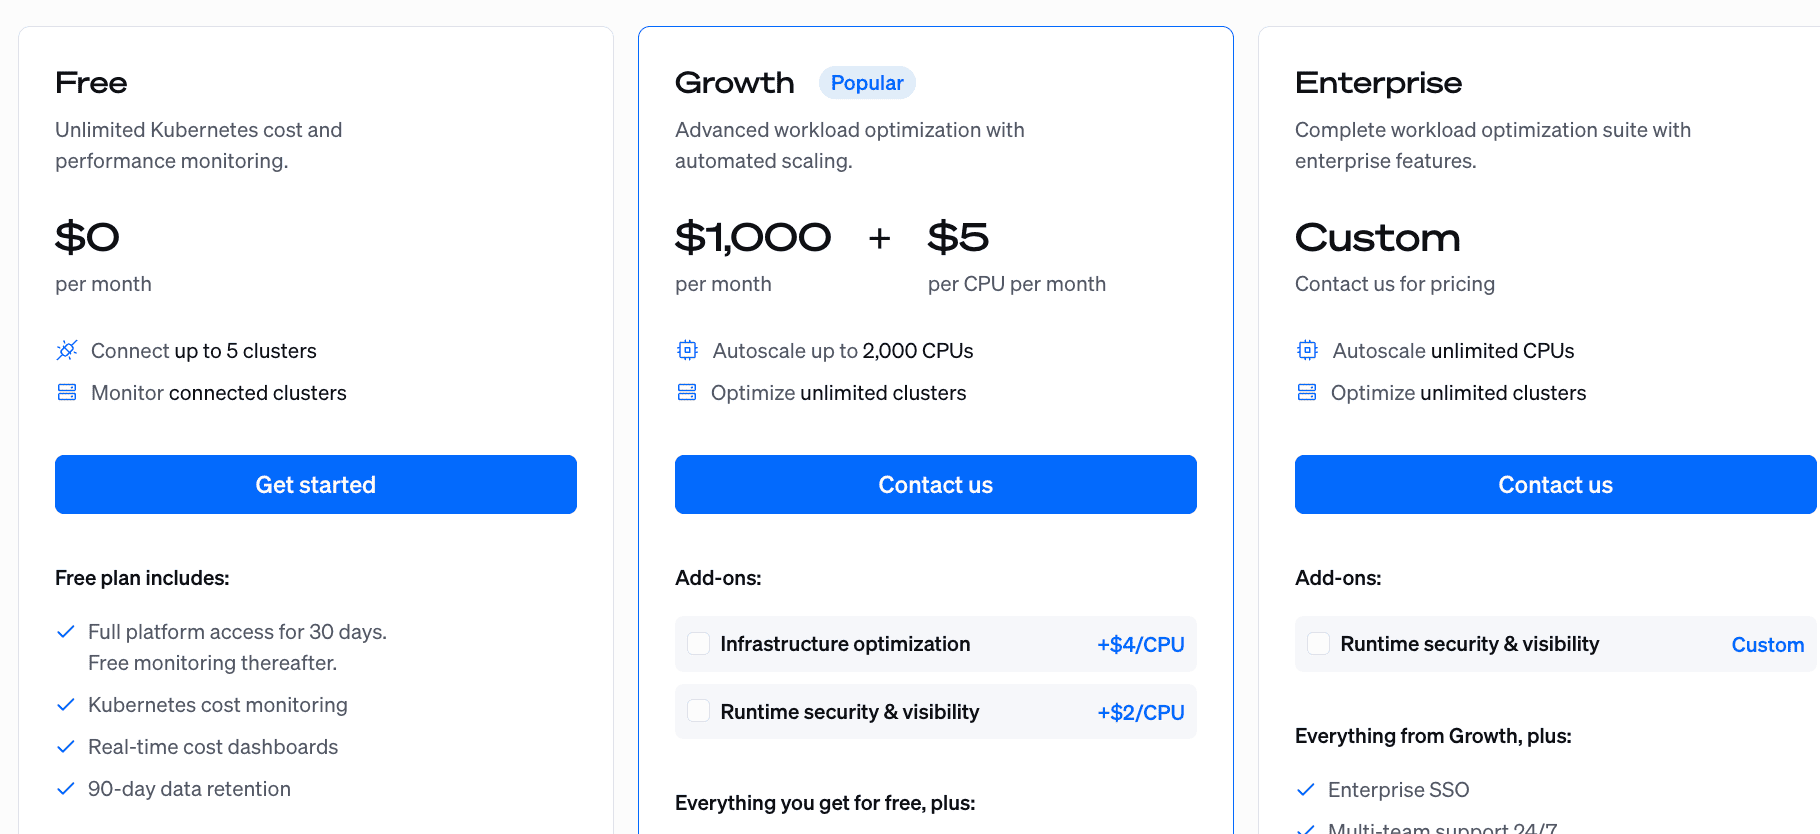 Image source.
That model fits engineering-driven FinOps teams: visibility and analysis are free; automation only costs when it actually delivers value.
Pros & cons
✅ CAST AI helps organizations in managing cloud resources and optimizing the costing part with high availability at low cost. G2.
✅ Adaptability and proactive service significantly alleviated potential operational hurdles. G2.
⚠️ Kubernetes-only focus. Great depth for clusters but limited insight into other types of cloud services.
⚠️ Complex governance setup; fine-tuning policies for production workloads may take time. Reddit.
Read also: FinOps Automation That Works: Tips & Tools from Pros
nOps
G2: ★★★★★ 4.8/5
Trial days: 14
Best for: teams heavily focused on AWS who need automation and FinOps capabilities layered on top of cost visibility and governance
nOps was built to help organizations take control of cloud spend in complex AWS environments. The platform collects data from the AWS Cost & Usage Report (CUR), then connects it with operational context and applies recommendations, rightsizing, scheduling, and commitment management automatically.
In short: if your organization spends heavily on AWS and you need a tool that handles visibility, allocation, and proactive cost control with minimal manual effort, nOps fits that use case perfectly.
Features
- Cross-account cost ingestion and normalization for AWS with 100% cost allocation even when tags are incomplete.
- Automated rightsizing and scheduling: identifies idle or oversized resources and applies schedules or rightsizes.
- Anomaly detection and spend forecasting: detects unusual spikes and helps you stay ahead of surprise bills.
- Integration with FinOps practices: allocation, chargeback/showback, tagging policies and governance workflows built in.
Pricing
nOps does not publicly list a simple, fixed license price. According to their documentation, they handle environments across many millions in spend and claim significant savings for their customers.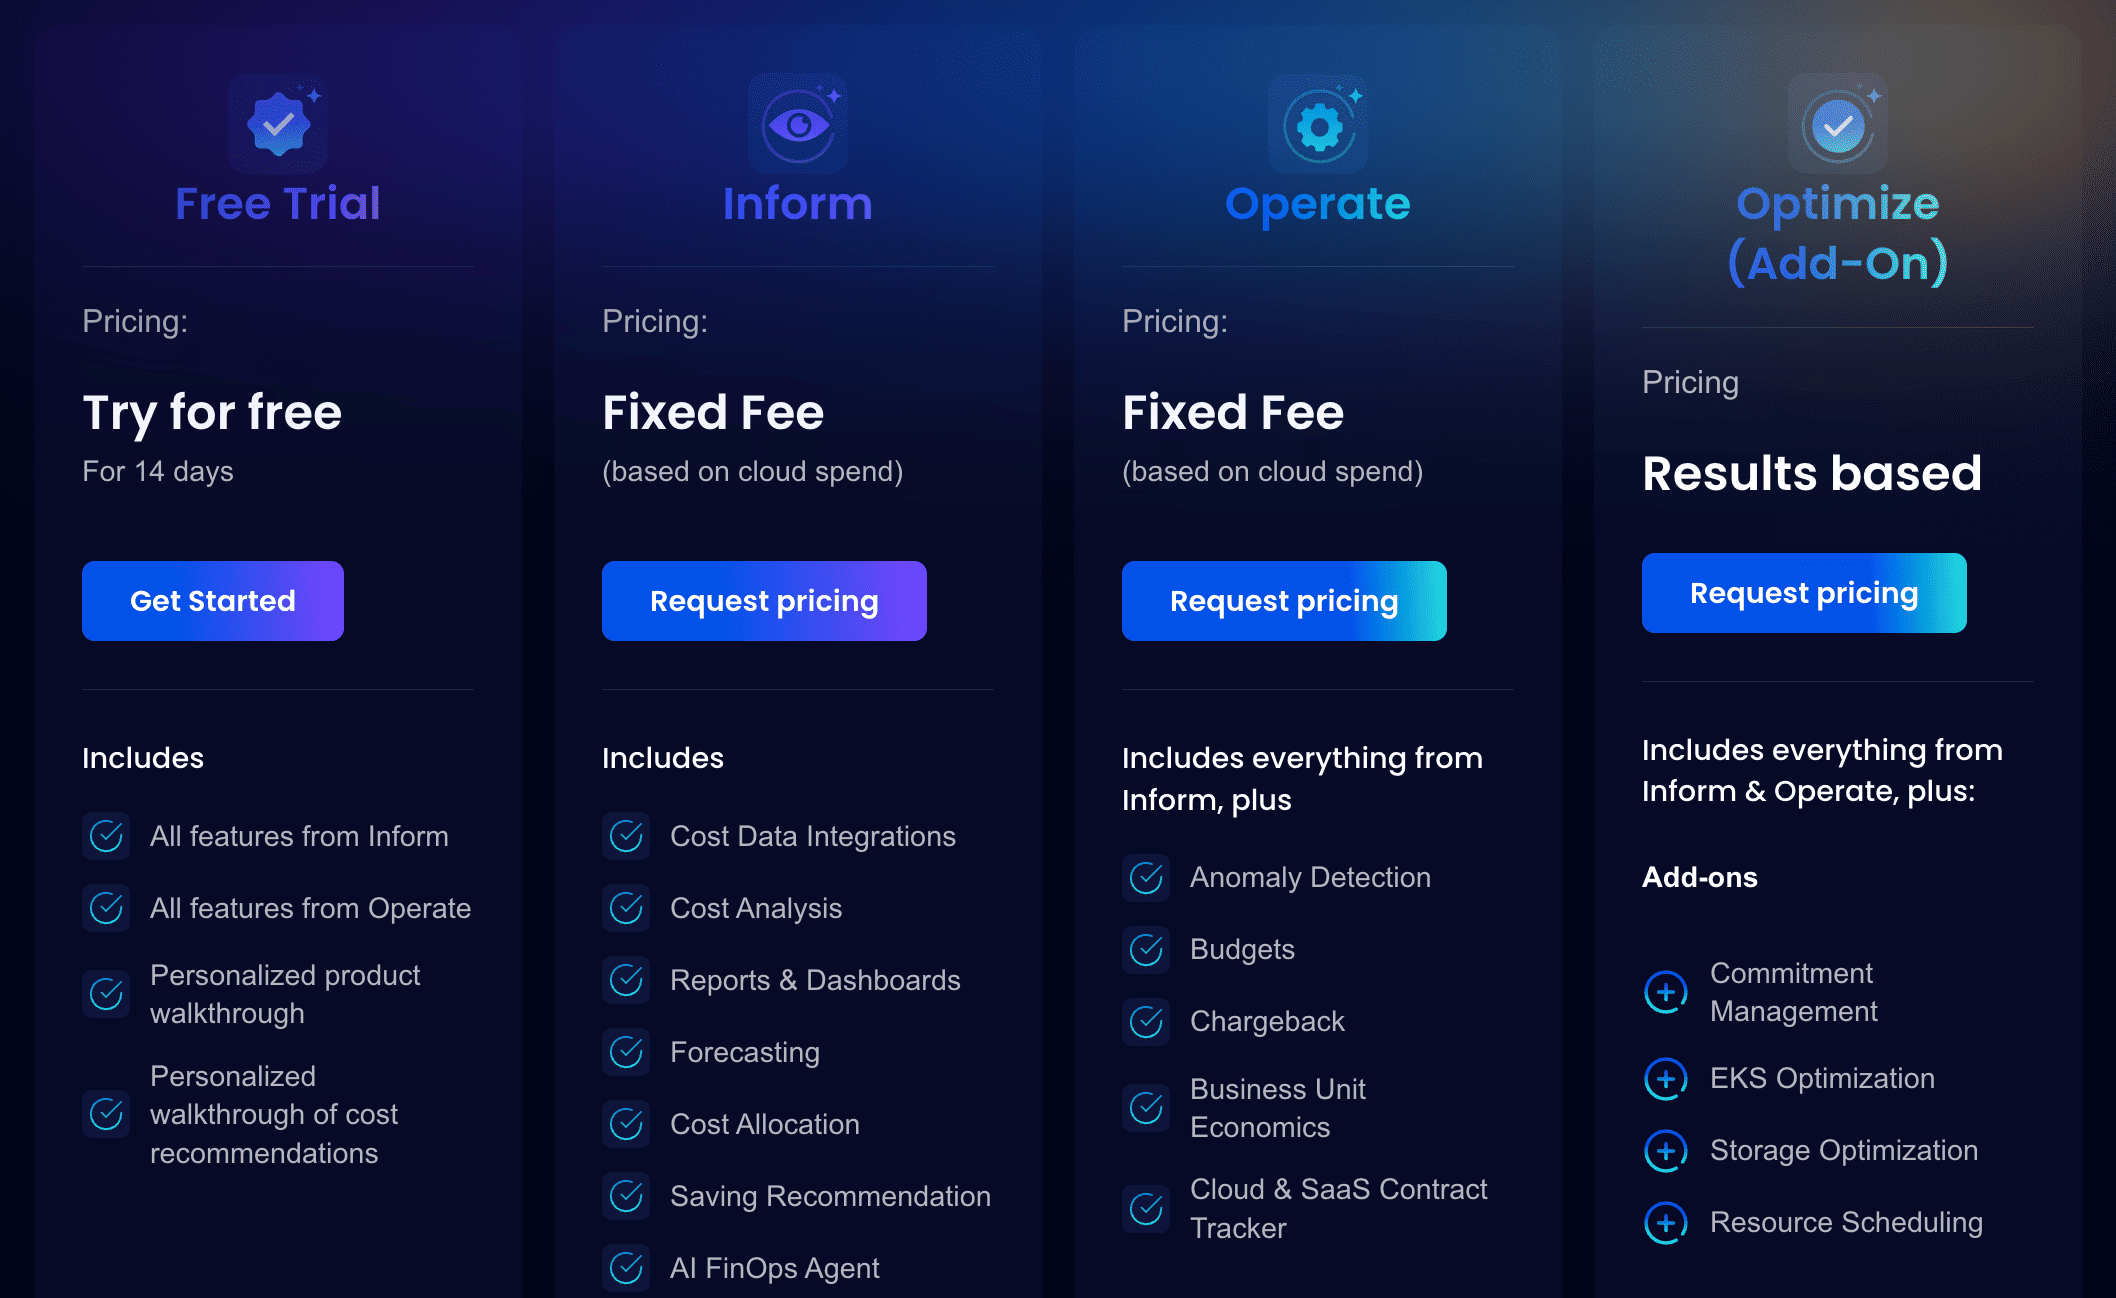 Image source.
The model is usage-aligned: as you manage more resources, scheduling, rightsizing, commitments, and spend analysis grow, so the cost of the tool scales with complexity and value.
For teams looking to get started quickly, the free trial through AWS Marketplace gives you access to core visibility and some automation features.
Pros & cons
✅ Significant cost savings and rapid time-to-value. G2.
✅ Built-in rightsizing and commitment management reduce waste and maximize utilization of discount models.
⚠️ Focus is primarily AWS — multi-cloud or hybrid environments may find fewer features available outside AWS. The CTO Club.
⚠️ Setup and onboarding can be complex for large or highly dynamic environments — configuration of automation and schedules takes time. G2.
Read also: Cloud Cost Optimization Framework: 11 Steps to reducing spend in 2026
Densify
G2: ★★★★★ 4.7/5
Trial days: 60
Best for: engineering and platform teams that want deep, data-driven analysis of cloud and Kubernetes workloads rather than just billing summaries
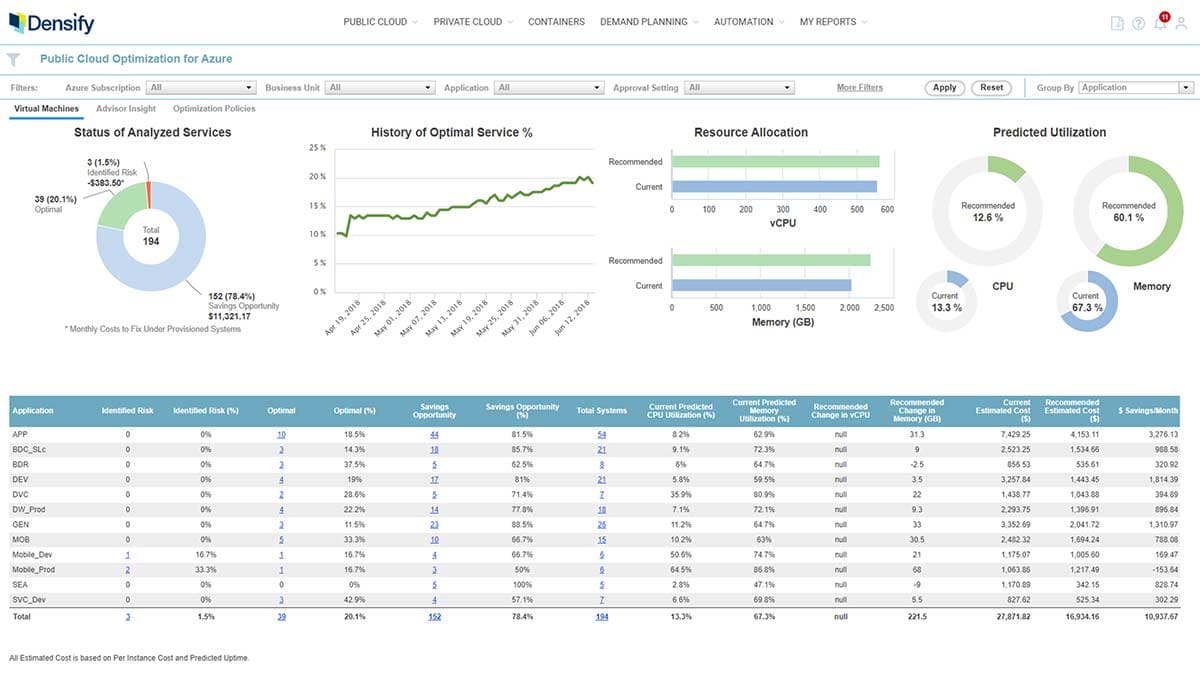
Densify approaches cost analysis from the performance side, not the finance side. It looks at how workloads behave and then decides what those resources should cost.
Instead of just showing “your EC2 instance is expensive,” Densify can tell you why — maybe the CPU is throttling, maybe the storage tier is wrong, maybe the node type doesn’t fit the pattern. That difference makes it a real analysis tool rather than another dashboard.
Features
- Workload-level analysis: Inspect compute, storage, and memory usage to identify under- and over-provisioned resources.
- Automated rightsizing recommendations: Generates instance-type changes and configuration adjustments with projected savings and performance impact.
- Forecasting and simulation: Model workload growth and shows what future cloud costs would look like under different instances or scaling strategies.
- Integrations: Connect to AWS Compute Optimizer, ServiceNow, and CI/CD pipelines for continuous optimization feedback loops.
Pricing
Densify offers a usage-based subscription model tied to the number of resources analyzed rather than flat licensing.
Public listings indicate entry-level pricing around US $0.10–0.15 per resource per month, depending on volume and features.
Pros & cons
✅ Deep technical insight: analyzes CPU, memory, and I/O at the workload level instead of just billing lines. G2.
✅ Strong integration with AWS Compute Optimizer and Kubernetes.
⚠️ The interface and reports feel dated with solid data, but the UX takes time to get used to. G2.
⚠️ Steeper learning curve for non-technical FinOps users; better suited for engineers comfortable with utilization metrics.
Read also: Cloud Cost Forecasting: Build a Reliable Cloud Budget
Ternary
G2: ★★★★★ 4.9/5
Trial days: available
Best for: FinOps, engineering, and finance teams working across AWS, Azure, and GCP who require profound visibility of multi-cloud spend
Ternary is built for teams that live in a mixed cloud world. It connects billing data from AWS, Azure, and GCP, aligns all the fields, and gives you one clean view of spend.
Unlike simpler dashboards that just total your spend, Ternary gives you context. You can break down costs by team, product, or business unit, and see which workloads actually drive the bill. It also runs rightsizing checks, manages commitments, and flags anomalies before they spiral.
Features
- Data from all major clouds: Connect directly to AWS, Azure, and GCP billing exports and roll everything into one consistent dataset.
- Label spend the way your business actually works: Slice costs by project, product, team, or environment, even if your accounts aren’t cleanly organized.
- Catch waste and idle capacity: See low-usage resources and get suggestions on right-sizing or commitment adjustments.
- Notice cost spikes early: Ternary flags anomalies and can send alerts to Slack or Jira.
Pricing
Ternary uses a fixed-fee subscription model based on your total cloud spend tier. According to its AWS Marketplace listing, pricing starts at $25,000 per year for organizations with up to $1 million in annual multi-cloud spend.
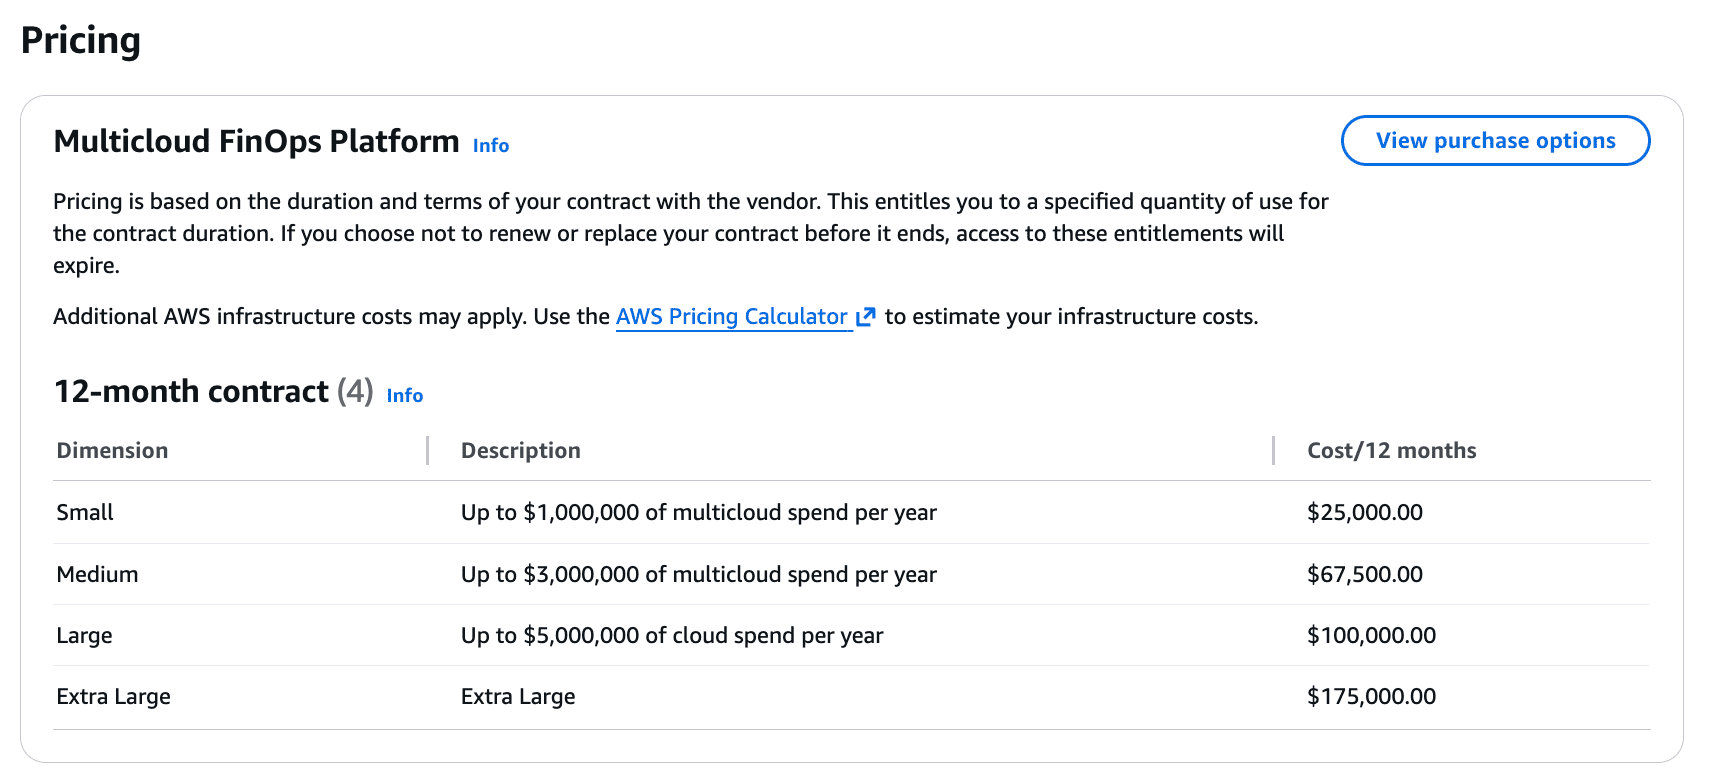
For example, a SaaS company managing roughly $2.8 million in annual multi-cloud spend across AWS, Azure, and GCP would fit into Ternary’s Medium tier. At that level, they’d pay about $67,500 per year for a 12-month contract, covering their entire FinOps team under a single fixed subscription.
Pros & cons
✅ Strong multi-cloud visibility and business-context mapping.
✅ Cost incidents or optimization tasks can be routed to Jira or other ticketing systems automatically.
⚠️ Some features roll out slowly, and analytics may lag. CloudZero.
⚠️ Managing members and subscriptions can be extremely tedious and complicated. G2.
Read also: 6 Finops Domains: The Essential Map For Cloud Spend Control
Comparison table: best cloud cost analysis tools
The comparison reflects each product’s actual focus area, based on public documentation and user reviews. Some tools specialize in optimization or governance, others go deeper into analysis or FinOps automation.
Legend:
✅ — strong or native capability
⚠️ — partial or limited support
❌ — not a core feature
| Tools → Criteria ↓ | Cloudaware | Flexera One | CloudZero | Apptio Cloudability | Finout | Zesty | CAST AI | nOps | Densify | Ternary |
|---|---|---|---|---|---|---|---|---|---|---|
| Automated Tagging | ✅ | ✅ | ⚠️ | ⚠️ | ✅ | ❌ | ❌ | ✅ | ❌ | ⚠️ |
| CMDB Context | ✅ | ⚠️ | ❌ | ⚠️ | ⚠️ | ❌ | ❌ | ❌ | ❌ | ⚠️ |
| Visibility Dashboards | ✅ | ✅ | ✅ | ✅ | ✅ | ⚠️ | ✅ | ✅ | ⚠️ | ✅ |
| Allocation | ✅ | ✅ | ⚠️ | ✅ | ✅ | ❌ | ❌ | ✅ | ⚠️ | ✅ |
| Rightsizing | ✅ | ✅ | ⚠️ | ✅ | ⚠️ | ✅ | ✅ | ✅ | ✅ | ✅ |
| Anomaly Detection | ✅ | ✅ | ✅ | ✅ | ✅ | ⚠️ | ✅ | ✅ | ⚠️ | ✅ |
| Forecasting | ✅ | ✅ | ⚠️ | ✅ | ✅ | ⚠️ | ⚠️ | ✅ | ⚠️ | ✅ |
| Security, Compliance | ✅ | ✅ | ✅ | ✅ | ✅ | ⚠️ | ⚠️ | ⚠️ | ✅ | ✅ |