


Updated: September 16, 2026
Reviewed by: Alla Lebedeva, Cloudaware CMDB & ITAM Expert
Cloud cost management rarely breaks because a dashboard lacks charts. It breaks when finance sees one total, engineering sees another, and nobody can explain the shared platform bill.
In practice, that gap can turn a routine variance review into a week of tag exports, billing files, and Slack archaeology. The expensive part is not finding the number. It is finding an owner who trusts it.
This guide compares 12 cloud cost management tools for five jobs: allocation, showback or chargeback, forecasting, anomaly detection, and commitment management. The shortlist covers enterprise suites, engineering-led platforms, observability products, and Kubernetes specialists. It does not rank tools built mainly to automate rightsizing or commitment purchases. For that job, compare cloud cost optimization tools. If you need a broader operating platform spanning FinOps practices and cross-functional accountability, compare FinOps tools.
Cloudaware publishes this comparison, so Cloudaware appears in it. Product claims were checked against current official pages and documentation on Sep 16, 2026. We did not run a controlled hands-on test of every platform. Where public evidence was incomplete, the table says so.
Here’s what we’ll break down:
- Which are the best FinOps apps for tracking cloud spending across AWS, GCP, Azure?
- How much they actually cost to run?
- What trial days and limits matter?
- How they handle anomaly detection, forecasting, tagging?
- What to ask before you choose cloud cost management software for your org?
The short answer
There is no universal winner. Start with the operating problem that keeps surviving your monthly cost meeting.
| If your hard problem is... | Start with... | Why it belongs on the shortlist |
|---|---|---|
| Multi-cloud allocation needs service and ownership context | Cloudaware | It connects provider billing with CMDB relationships and business allocation rules. |
| Enterprise showback, forecasting, and financial governance | IBM Cloudability | It covers cost sharing, forecasting, and commitment workflows for large FinOps programs. |
| Broad hybrid FinOps plus automated commitment operations | Flexera One FinOps | Its portfolio joins cost governance with ProsperOps commitment automation. |
| Existing IT workflows run through ServiceNow | ServiceNow Cloud Cost Management | It puts showback, budgets, and forecasting inside the ServiceNow operating model. |
| Engineering wants governance and automated optimization together | Harness AI and Cloud Costs | It combines allocation and forecasts with anomaly and commitment automation. |
| SaaS unit economics matter more than provider accounts | CloudZero | Its cost dimensions map spend to products, customers, and features. |
| Cost investigation should sit beside telemetry | Datadog Cloud Cost Management | It connects cost changes with service and observability context. |
| Kubernetes allocation is the center of the problem | IBM Kubecost | It is purpose-built for container allocation, showback, and cluster cost visibility. |
That list should narrow the first demo round. The matrix below does the harder work.
Cloud cost management is not cloud cost optimization
The distinction sounds academic until a tool recommends a change that nobody is allowed to make.
Cloud cost management creates a trusted record of spend. It ingests bills, normalizes data, allocates shared costs, produces showback, tracks budgets, forecasts demand, and routes anomalies to owners.
Cloud cost optimization changes the bill. It rightsizes resources, removes waste, adjusts architecture, schedules workloads, or buys and manages commitments.
| Management job | Optimization job |
|---|---|
| Explain which team, service, customer, or product caused the cost. | Change usage, architecture, or purchasing to reduce that cost. |
| Reconcile dashboards with provider billing data. | Validate that an approved action produced savings. |
| Forecast future spend and show variance. | Choose rightsizing, autoscaling, spot, or commitment actions. |
| Detect an unusual movement and assign an owner. | Execute or approve the corrective change. |
| Report commitment coverage and utilization. | Buy, exchange, renew, or automate commitments. |
Commitment management straddles both categories. Coverage reporting is management. Automatic purchasing or renewal is optimization. Ask vendors which side they actually deliver.
If your primary need is execution, compare cloud cost optimization tools instead.
Methodology: How we tested cloud cost management tools
Here’s how we did it – no fluff, just the real steps behind the shortlist.
First, we narrowed 30+ cloud cost management tools Gartner kept naming. Then we signed up. Trials, demos, sandboxes – whatever they gave us, we got our hands dirty. We tracked how long it took to onboard, how clearly they visualized spend, how fast we could detect anomalies. One tool flagged idle RDS instances in five clicks. Another buried the same insight behind four pricing tiers.
We didn’t stop at UI. We hit up G2, Capterra, and TrustRadius to pull raw user feedback – pain points, billing surprises, feature gaps. Real ops teams talking about real roadblocks.
Then we crawled cloud spend management convos on Reddit and Quora. Asked questions. Read between the upvotes. “Is this just another dashboard, or does it help my team avoid six-figure billing accidents?”
We dug through docs, pricing pages, support chatbots. Measured how well each one helps actual cloud financial decisions. Is the tool useful to engineering? Or just another spreadsheet for financial management?
If a FinOps platform didn’t give value in week one, it didn’t make this list.
Cloudaware
Gartner: 5/5
Trial days: 30
Best for: automating multi‑cloud cost allocation and waste elimination using its CMDB-driven FinOps platform
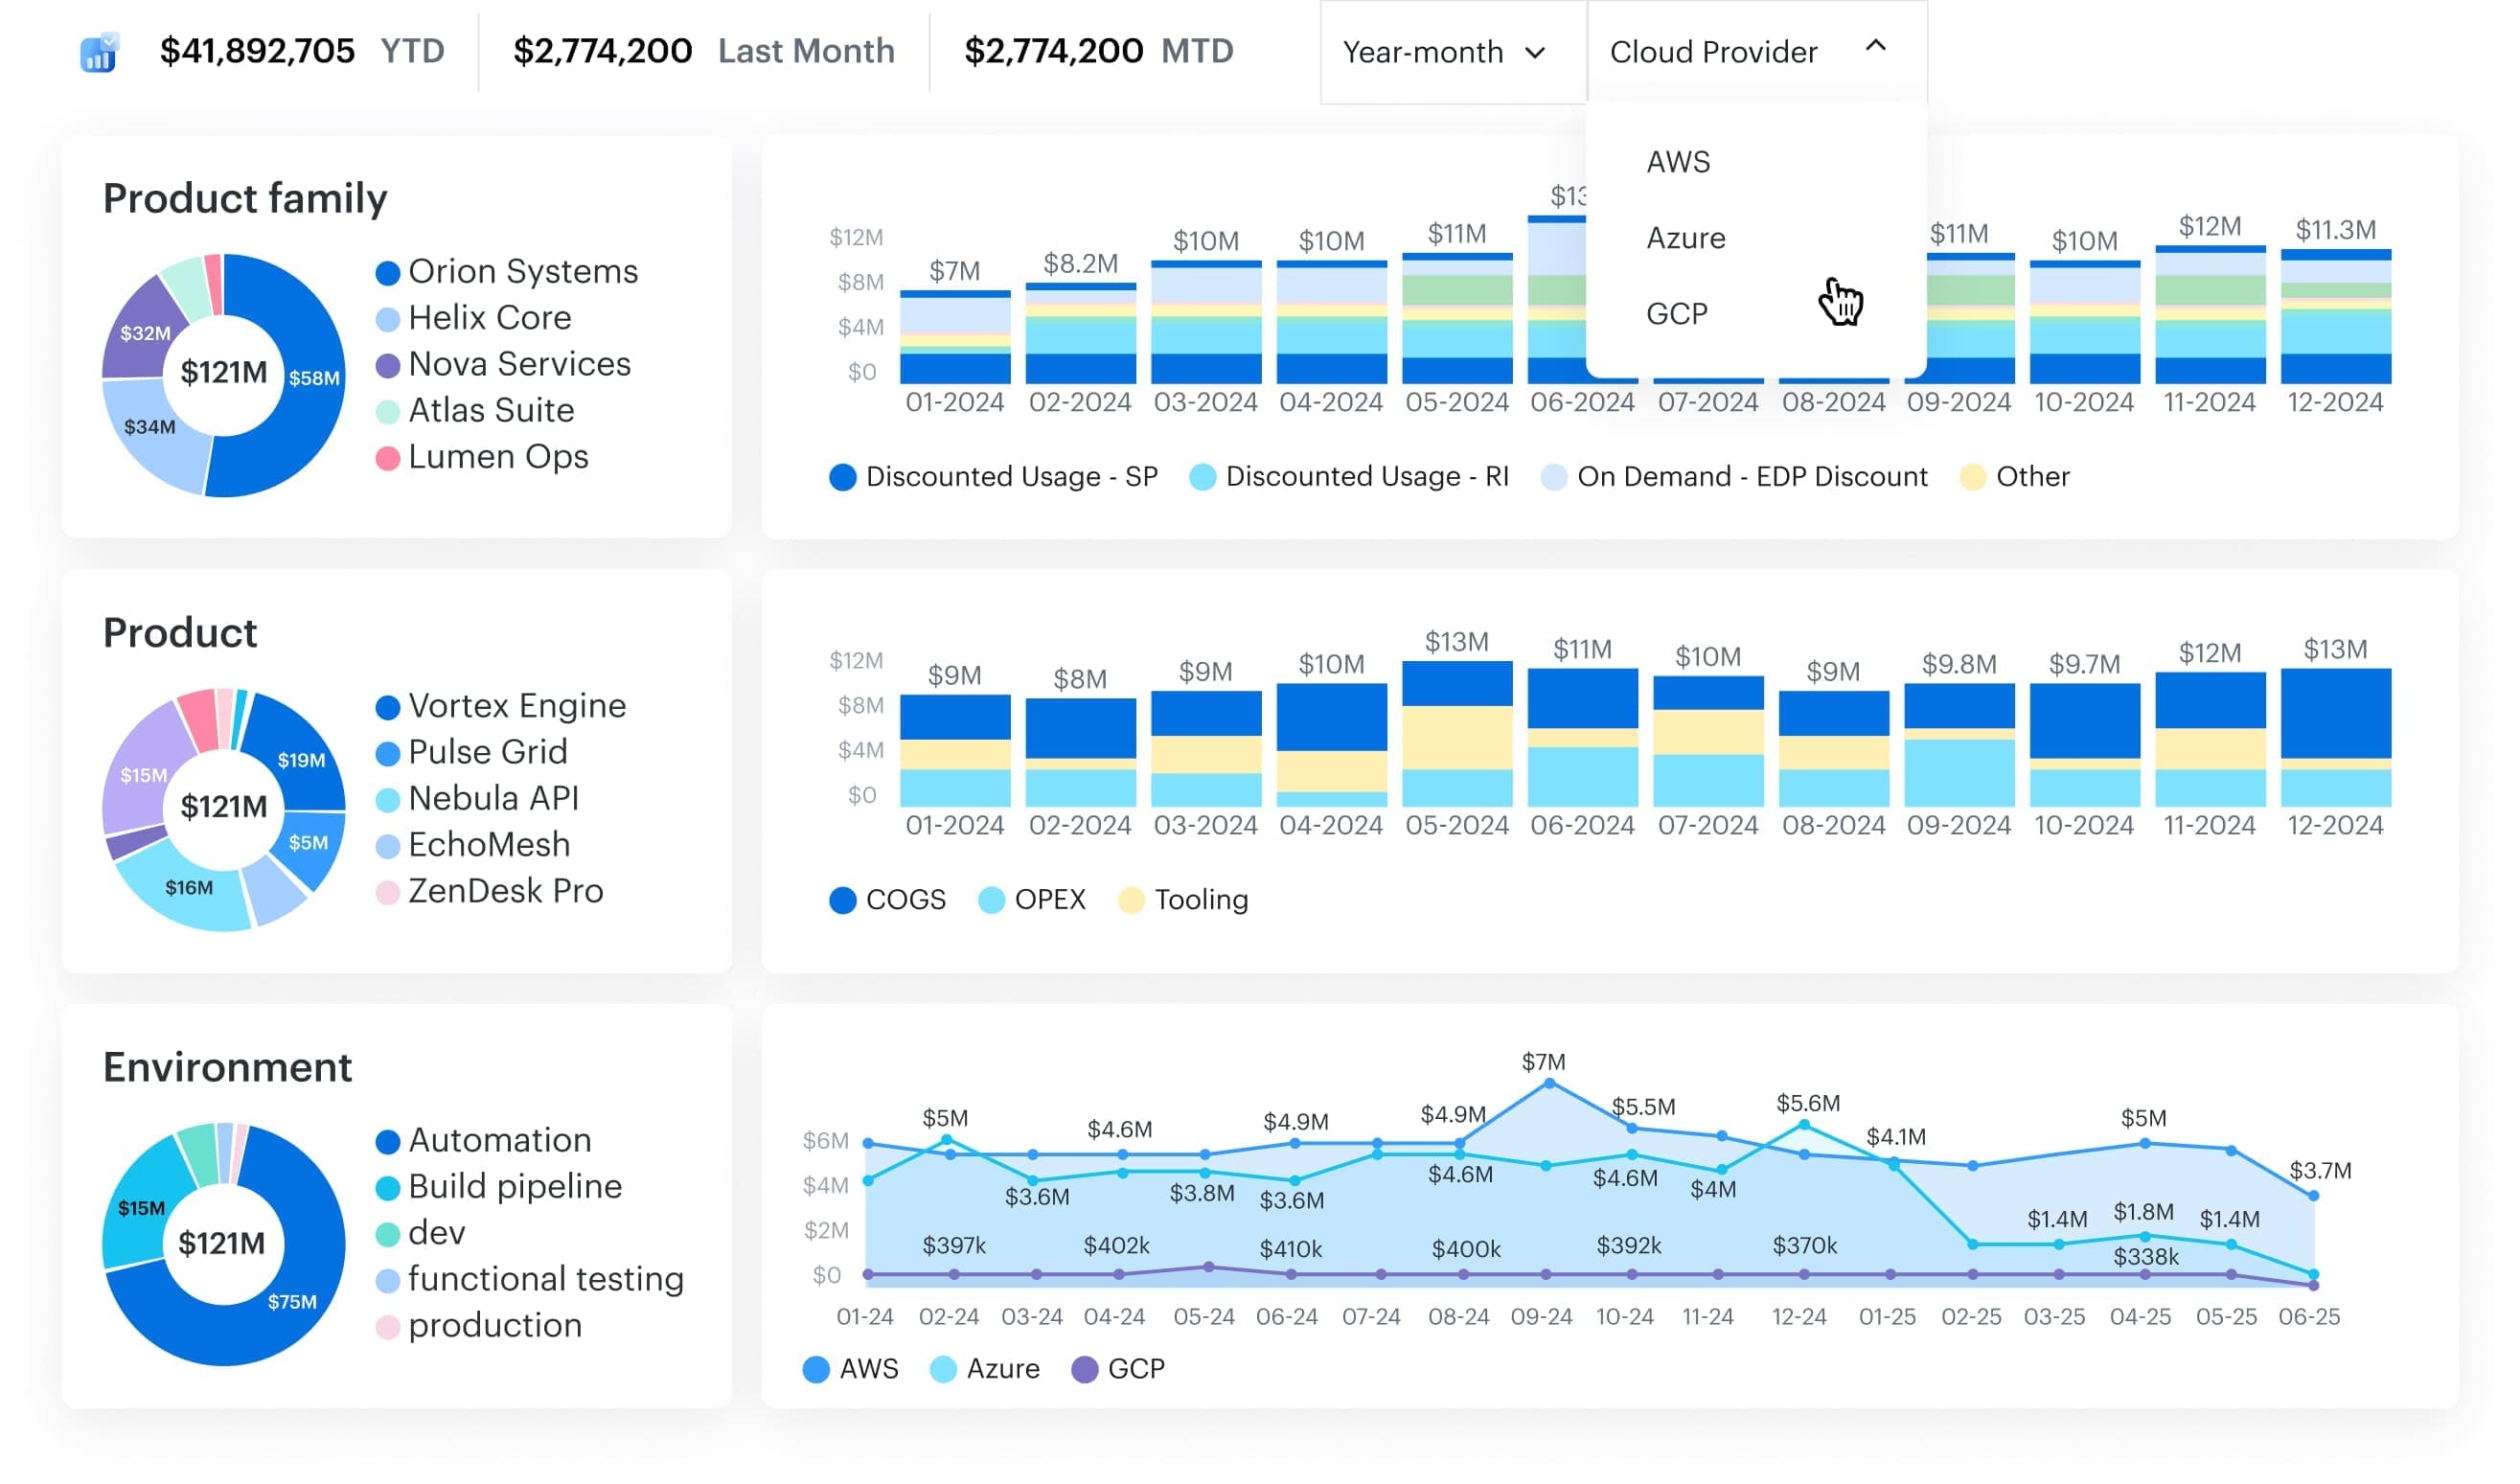
Cloudaware gives FinOps teams cloud cost management with CMDB context, so every dollar lands on a service, owner, and environment. Caterpillar used it to close tagging gaps and rightsizing waste ($627K annual savings). Boeing used it to break down Azure OpenAI tokens, track SP/RI coverage, and catch anomalies ($958,250/year). Coca-Cola calls out visibility and efficiency.
Cloudaware maps raw billing to CMDB services, allocates shared costs, and adds a cloud cost management service for hands-on ITAM help. Among cloud cost management tools, this one tool keeps management crisp, ties optimization to spend, and drives cost optimization.
Features
- CMDB-linked allocation: automatically maps line items to service catalog context (service/app/team/env).
- Shared-charge allocation: handle support fees + “everyone touched it” resources with rules (tags/CMDB logic).
- Multi-cloud coverage (incl. Oracle): track AWS, Azure, GCP, and Oracle in one place.
- Tagging gap detection: surfaces where ownership/allocation breaks down, so chargeback stops leaking.
- RI/SP visibility: coverage + underuse flags so you can actually act on commitments.
- AI billing clarity: token-level breakdowns for Azure OpenAI (plus visibility into AWS AI services in the same workflow). The AI cost tracking guide explains how to attribute and allocate that spend across teams.
- Anomaly alerts + forecasting: catch spikes/drops early, and plan with interactive projections by account/unit.
- Storage + compute cleanup: idle storage findings and rightsizing recommendations tied to owners.
Pricing
Cloudaware doesn’t do cookie-cutter pricing. Instead, it offers a modular structure that starts with its core product — the CMDB. Why? Because in Cloudaware’s world, there’s no FinOps without full visibility into your infrastructure. The CMDB maps every server, service, and tag in your environment, making cost analysis meaningful.
Here’s how the pricing breaks down:
- First, you buy the CMDB module, which is priced based on the number of configuration items (CIs). For most environments, this averages out to about $0.008 per CI per month.
- For a setup with 100 cloud servers, you're looking at around $400/month for CMDB.
- Then, if you want cost management features, you add the FinOps module, which is priced at 20% of your CMDB spend.
So in this case:
- CMDB: $400/month
- FinOps module: 20% of $400 = $80/month
- Total: $480/month
Compared to native tools like AWS Cost Explorer or high-cost standalone FinOps platforms, Cloudaware offers a clean, infrastructure-aware cost control platform—without the surprise bills.
Pros & Cons
Here are what users of Cloudaware cloud cost management software talk about their experience on G2 and Capterra:
✅ Unified multi-cloud cost visibility: “It provides a unified view of all cloud resources… The platform offers a range of features, including … cost optimization, compliance management, and security.” aws.amazon.com
✅ Automated cost optimization recommendations: “Cloudaware provides cost optimization recommendations, such as rightsizing instances, eliminating idle resources, and leveraging reserved instances.” aws.amazon.com
✅ Comprehensive cost management integration: “Takes care of everything right from CMDB, Cost Management, Change management, … monitoring and usage analytics.” aws.amazon.com
⚠️ High cost for small organizations: “It is not free and price may not be oaky for smaller organization and limited budgets.” aws.amazon.com
⚠️ Pricing can be high for startups: “Additionally, the pricing can be high for small businesses or startups.” aws.amazon.com
⚠️ Steep pricing vs alternatives: “It’s slight[ly] expensive as compared to other cloud management platforms.” aws.amazon.com
ServiceNow
Capterra: 4.5/5
Trial days: 30
Best for: getting centralized visibility of multi‑cloud consumption and optimizing resource usage to reduce spend.
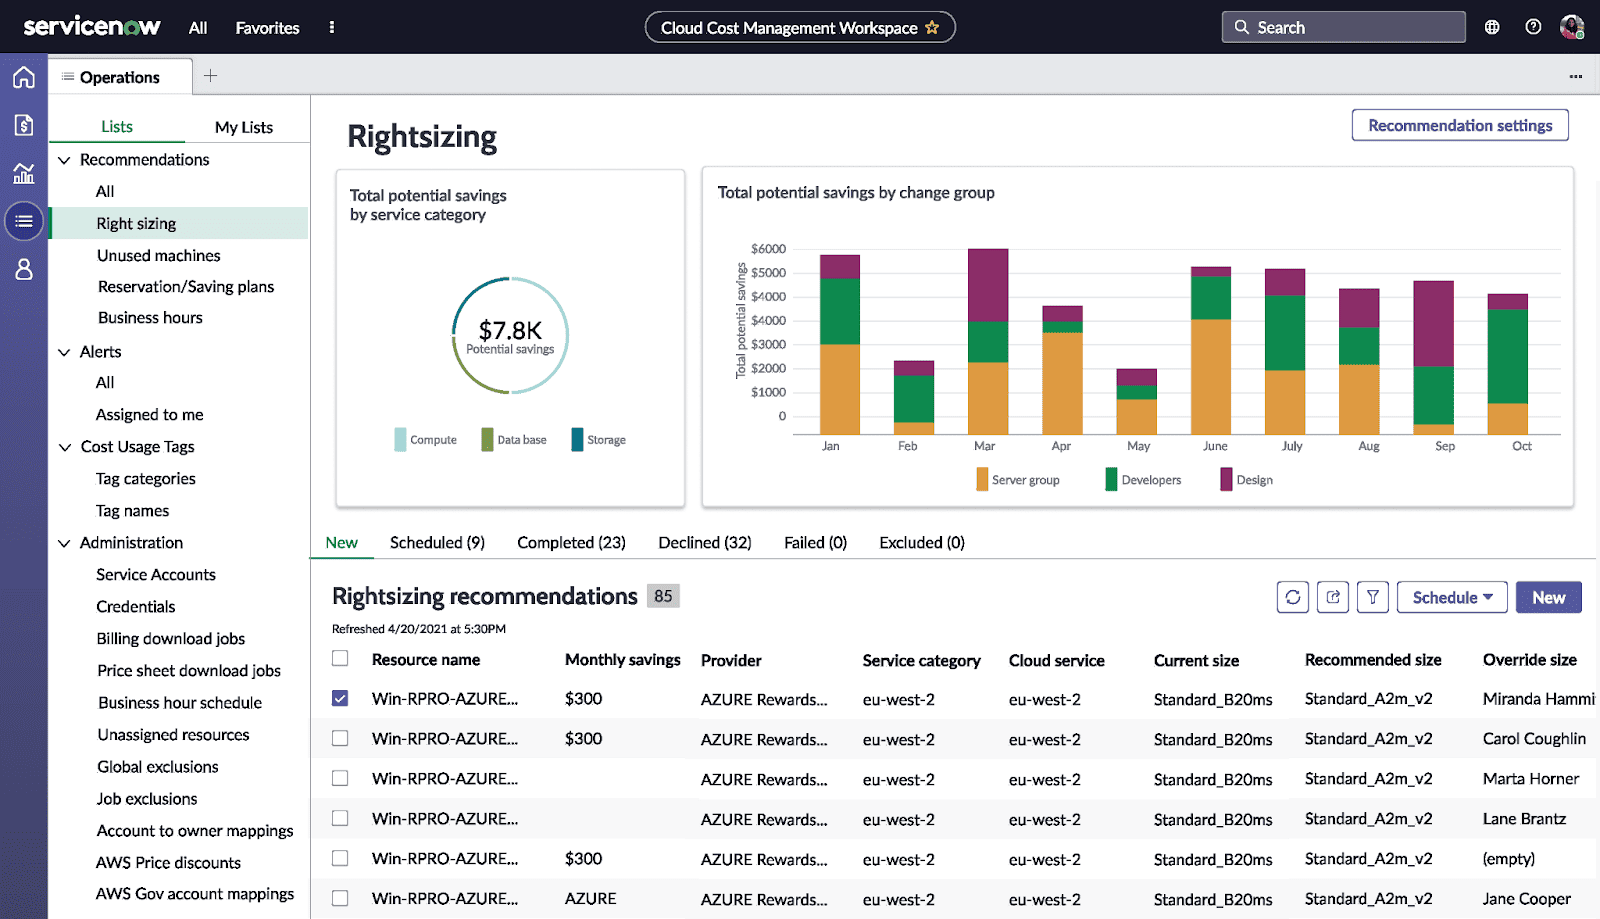
When cloud cost management ServiceNow shows up in a stack, it’s because scale’s already a thing. Think Boeing, Deloitte, Accenture – teams using it to track every dollar from AWS to on-prem. What makes it click? It lives inside the workflows your people already use. Approvals, automation, showback – all stitched into ITSM and SecOps.
You’ll find it on the ServiceNow Store and AWS Marketplace. Most teams lean on it for cloud cost tracking, optimization, budget alerts, and anomaly response. It doesn’t just surface spend – it connects costs to change tickets, incidents, and real usage.
Gartner gave it the thumbs-up in recent tools cost management cloud listings. For teams needing top-down management and bottom-up data, this is the one.
Features
- Detailed cost allocation reports.
- Rightsizing recommendations and idle detection.
- Forecasting + budget control.
- Policy-based cost management.
- Near real-time cloud cost anomaly alerts.
- Integration with provisioning + CI/CD.
- Optimization insights mapped to service models.
Pricing
ServiceNow prices like a suite, not a standalone tool. You're buying into a platform that scales across IT, SecOps, and yes – cloud cost management. The ITSM Pro plan starts around $100/user/month, but most FinOps setups with automation, CMDB hooks, and cost modeling land closer to $500–$1,000/month per admin.
There's no public trial – expect to request a custom demo or sandbox.
What drives the number? User roles, workflows, modules activated, and how deeply you integrate tools across teams. The value? Enterprise-wide spend insights plus workflow-linked cost optimization in one engine.
Pros & Cons
✅ Improved cost visibility and control: “Improve [your] visibility and control over [the] cloud environment, which can help … better understand and manage … costs, performance, and security.” g2.com
✅ Proactive cloud spend optimization: “Track and manage their cloud spend, which can help … optimize their cloud costs, identify areas of overspending and take proactive steps to manage them.” g2.com
✅ Overall cost savings via unified management: “Overall, it allows organizations to have a better control… resulting in cost savings, improved efficiency and compliance.” g2.com
⚠️ High cost for budget-conscious orgs: “High cost: The platform can be expensive for some organizations, which may make it out of reach for smaller businesses or those on a tight budget.” g2.com
⚠️ Complex setup can incur extra effort: “Complex setup and configuration: … can be complex to set up… especially for large and complex cloud environments.” g2.com
⚠️ Steep learning curve for cost module: “The learning curve for new users can be steep… which may require additional … training.” g2.com
Harness
Capterra: 4.5/5
Best for: AI‑driven FinOps (natural-language cost analysis, anomaly detection, and automated rightsizing of cloud resources)
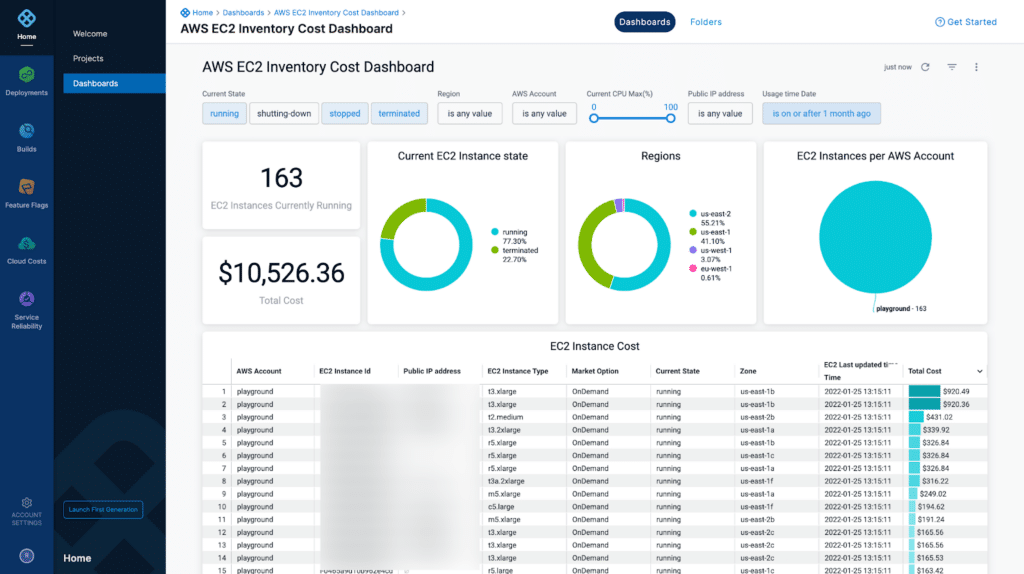
Image source.
Harness Cloud Cost Management shows up when engineering teams are tired of monthly surprise costs and want answers in minutes, not retros. Brands like Snowflake, eBay, and United use it to tie cloud cost directly to deployments, features, and dev teams. It plugs right into CI/CD flows and Kubernetes – turning spend into something engineers can actually manage.
You’ll find it in the AWS Marketplace and on the Harness platform.
What gives it the edge? Its AI-powered insights feel built for devs – not just finance. It flags anomalies fast, suggests rightsizing, and even integrates with change events.
G2 crowned it a leader in cost optimization. This isn’t another generic tool – it’s precision-fit for modern engineering workflows.
Harness cloud cost management features
- Kubernetes-aware cost management.
- Anomaly detection with ML context.
- Idle resource cleanup.
- Cost per deployment insight.
- Budget guardrails + forecast alerts.
- Real-time management dashboards.
FinOps platform pricing
Harness makes cloud cost management feel like less of a bet. You can start with a zero-dollar plan – yep, free forever – for up to 100 AWS resources. Want more horsepower? The Premium plan kicks in at $780/month for up to 250 resources.
From there, pricing scales based on active cloud resources, not seats. You’re not paying for shelfware – you’re paying for insight.
They give you 14 days to test full optimization features across environments. Among tools built for engineers, this one actually respects the budget.
Pros & Cons
✅ Granular cloud cost insights for savings: “The best feature of Harness is the granular details of cloud resources which will help you while doing cost savings in cloud.” g2.com
✅ Cross-cloud billing visibility: “This will provide you [a] granular view of resources billing that is not possible from the cloud providers… so no need to create … manual automation for resources.” g2.com
✅ Broad DevOps platform with cost management: “It provides a broad set of features, covering CI/CD, security, observability, cost management, and more.” g2.com
⚠️ Limited cost data filtering options: “It will not support multiple filters by account name or services type – that is really a big lack.” g2.com
⚠️ High cost for smaller teams: “Pricing is considered relatively high, particularly for small to mid-sized organizations, with some feeling the value may not justify the cost unless the full feature set is utilized.” finout.io
⚠️ Evolving features need maturity: “Certain features are still evolving and may not yet be fully developed… the lack of maturity in some areas can limit functionality.” invgate.com
Flexera cloud cost management
Capterra: 5/5
Trial days: 14
Best for: monitoring and optimizing multi‑cloud (AWS/Azure/GCP) and Kubernetes spend with ML‑driven forecasting, anomaly detection and savings recommendations.
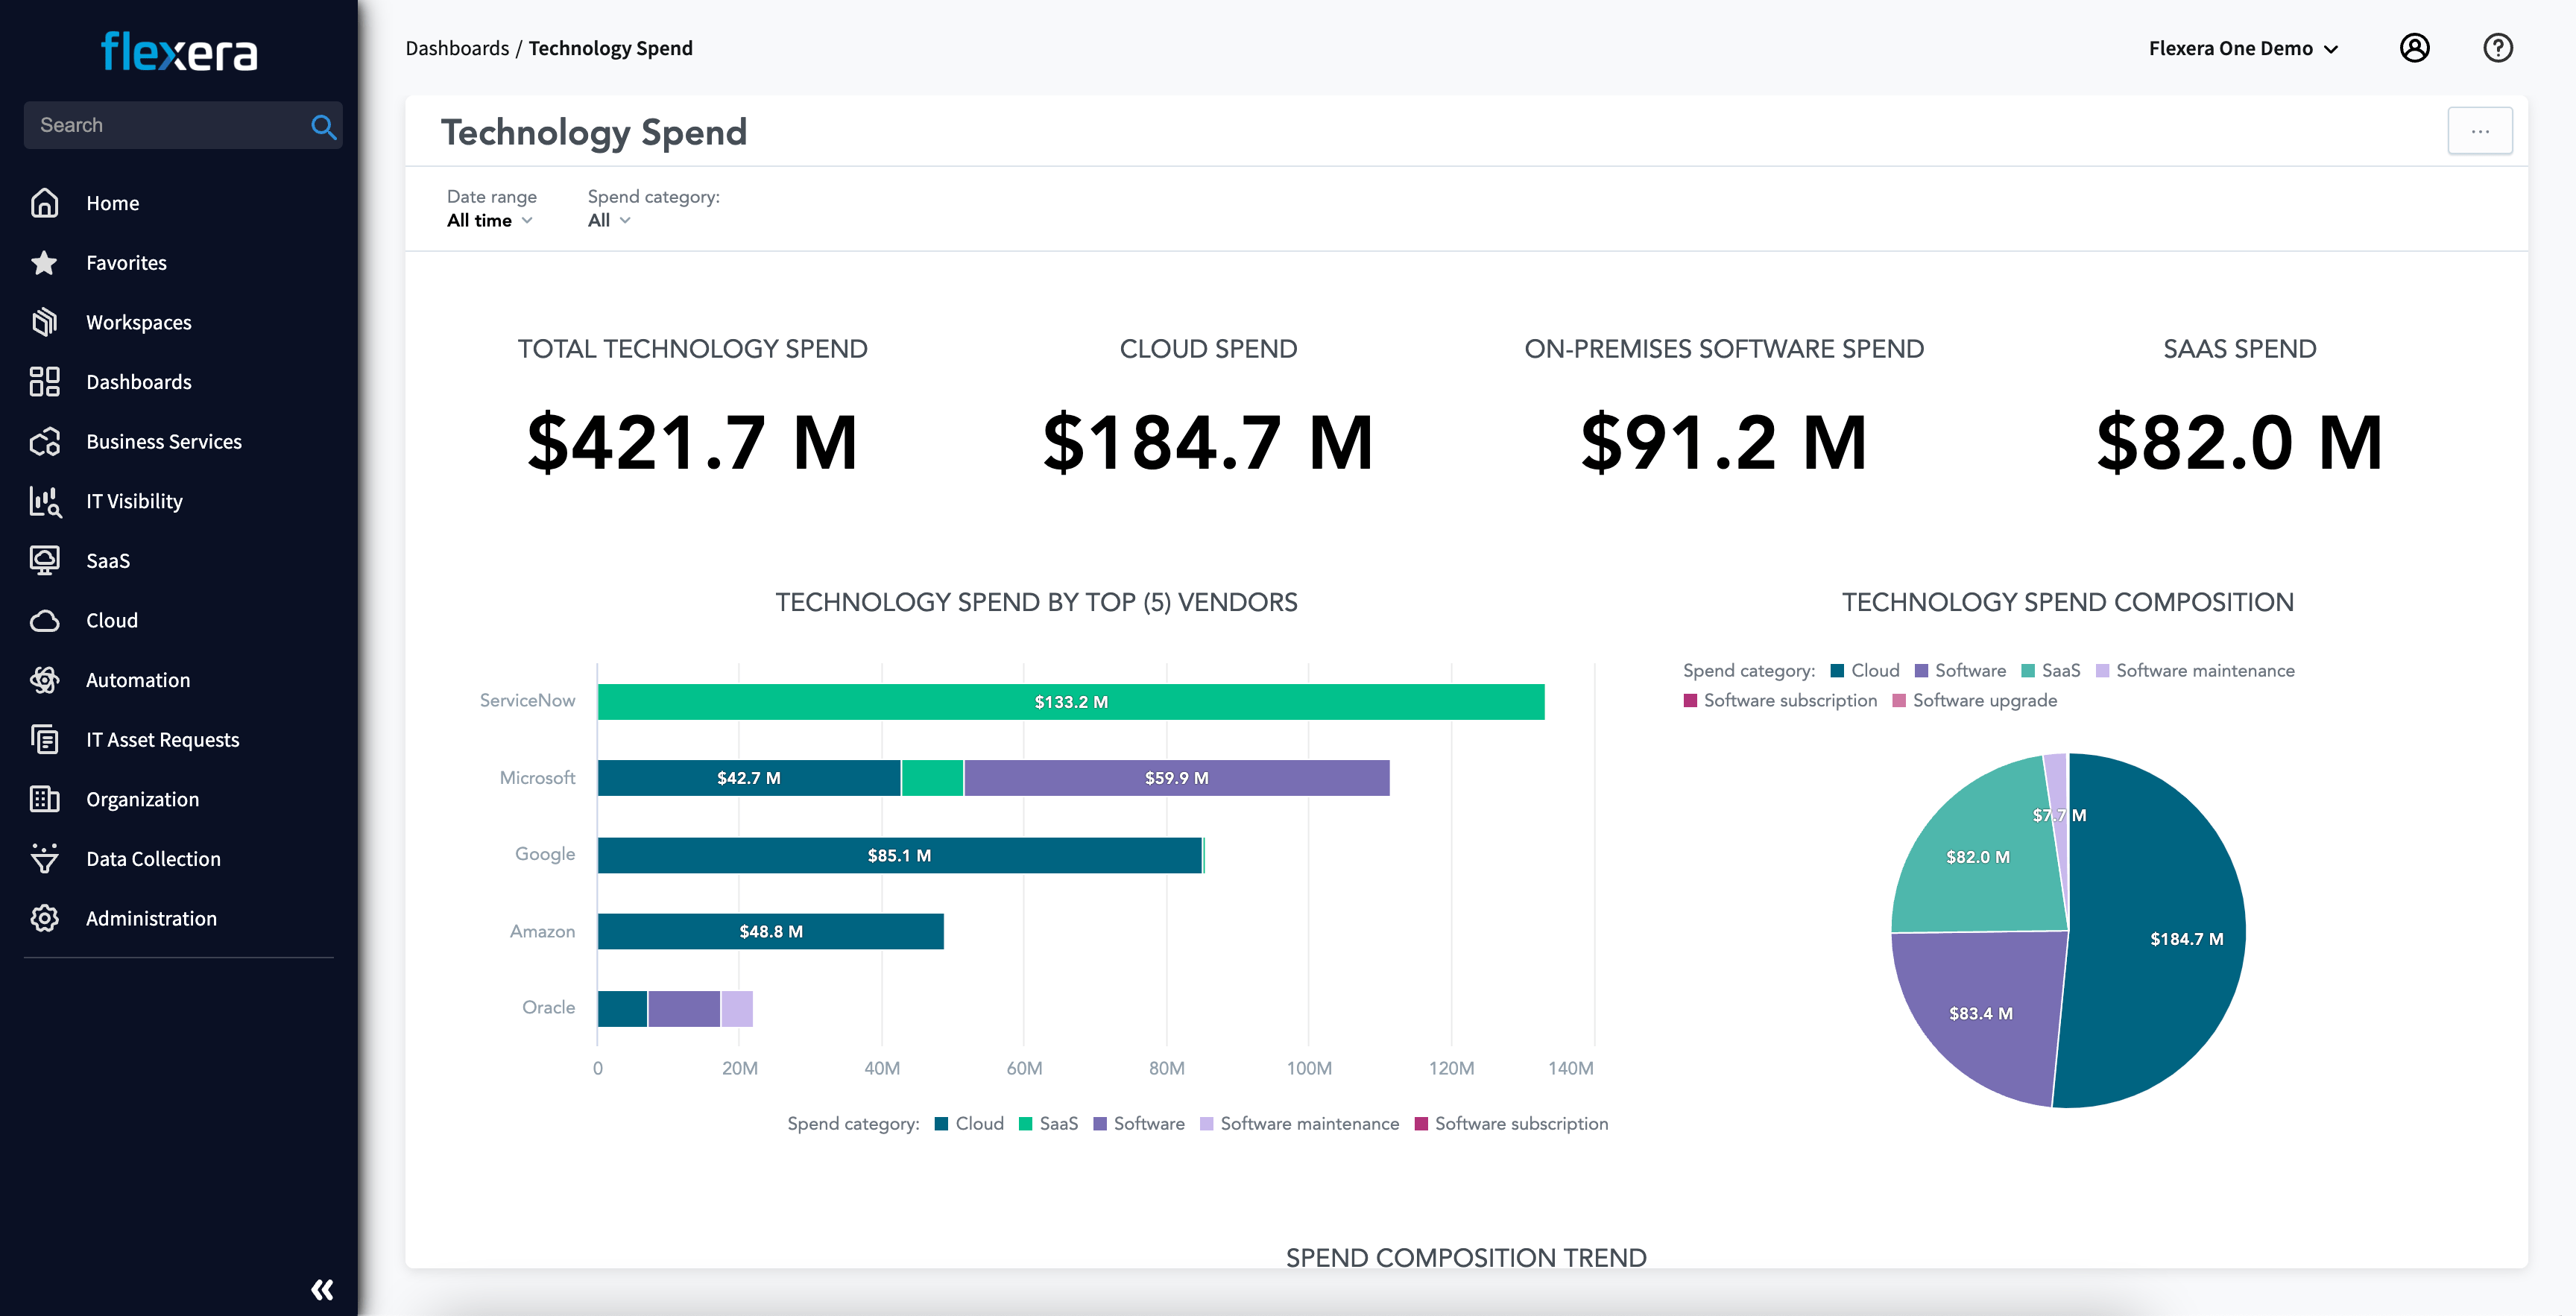
Flexera is what enterprises turn to when tagging chaos, rogue AWS spend, and hybrid complexity hit the fan. Brands like Siemens, Novartis, and Cisco trust it to tame tangled billing across multi-cloud and on-prem. It shines in showback, forecasting, and reserved instance optimization – and yes, it even wrangles cloud cost management across Kubernetes.
It’s available through AWS Marketplace, Azure Marketplace, and more. The edge? Its integrations go deep – CMDBs, ticketing, ITFM tools – and its policy engine handles spend governance like a pro.
Among cloud cost management tools, Flexera’s been in Gartner’s MQ more than once, with consistent leadership nods. It’s made for ops that scale past scrappy spreadsheets.
Cost optimization features
- Smart reserved instance and savings plan cost optimization.
- Forecasting tied to actual usage.
- Rich showback + chargeback by project or BU.
- Multi-cloud and hybrid visibility.
- Policy-driven tools cost management cloud automation.
- Deep reporting for FinOps and finance audiences.
Pricing
Flexera keeps pricing gated – classic enterprise move – but here’s what surfaced: base plans start near $1,000/month and climb past $5K depending on feature sets, support tier, and how many cloud accounts or cores you're managing. Trial? Yep – 60 days, which is generous in cloud cost land.
They price on data volume, connected cloud providers, and platform modules (think cost management, optimization, compliance).
If your management team wants full-stack visibility from asset to budget, this gives you that. You’ll just want finance looped in once costs scale with usage. Flexera’s built for orgs with six-figure cost management goals – not side projects.
Pros & Cons
✅ Identifies underutilized resources to cut costs: “Cost optimization: The platform highlights savings opportunities by identifying unused or underutilized software licenses and cloud resources.” g2.com
✅ Multi-cloud cost visibility and forecasting: “Provides visibility into multi-cloud environments (AWS, Azure, Google Cloud), making it easier to monitor spend and forecast costs.” g2.com
✅ Intuitive cost reporting dashboards: “User-friendly dashboards: Clear reports and visualizations make it easier for stakeholders to understand spend and compliance status.” g2.com
⚠️ High licensing costs for smaller orgs: “Licensing and ongoing subscription costs can be high, especially for smaller organizations.” g2.com
⚠️ Steep learning curve & complex setup: “While Flexera One is powerful, it has a steep learning curve… initial setup and integration with multiple systems can be time-consuming.” g2.com
⚠️ UI and performance issues at scale: “Some dashboards and interfaces feel less intuitive than they could be. Additionally, performance can be slower with very large datasets.” g2.com
Read also: Cloud Computing Cost Savings - 10 Proven Strategies for FinOps
Datadog cloud cost management
Capterra: 4.6/5
Trial days: 14
Best for: providing unified cost observability by correlating cost and performance data, with automated optimization recommendations and anomaly detection for cloud resources.

Datadog’s that rare cloud cost management software that speaks fluent observability and finance. Airbnb, Nasdaq, and Peloton use it to tie performance to costs – so when spend spikes, you know exactly which service or deploy did it. Engineers love that it feels like their native stack, not another foreign finance tool.
It’s on AWS Marketplace and works seamlessly with your existing monitors, logs, and infra agents. The secret weapon? Granular per-service visibility baked into real-time dashboards.
Named a leader by G2 and a fan favorite in every cloud spend management thread worth reading.
Datadog cloud cost management features
- Unified view of infra usage + cloud cost.
- Per-service, per-tag cost management.
- Alerting for anomalies and forecast spikes.
- Custom dashboards for teams and execs.
- Native cost optimization across Kubernetes, RDS, Lambda.
- Deep integration with AWS billing APIs.
Pricing
Here’s how cloud cost management Datadog breaks it down: $15 per host/month gets you the basics – infra monitoring, cost metrics, usage. If you're layering on CI Visibility, APM, or Cloud Cost Management, the bill moves fast – think $23–$70+ per host/month depending on modules.
You’ve got 14 days to explore everything – dashboards, alerts, anomaly detection, optimization insights baked in.
What makes it work? You only pay for what’s active, and billing’s crystal clear. Among the best cloud cost management software, this one actually earns its place on the list. Real-time telemetry, real-time tools.
Pros & Cons
✅ Custom metric ingestion controls costs: “Ability to fine tune custom metrics and logs ingested – this helps to control the cost.” g2.com
✅ Consolidated observability saves tool costs: “[Datadog] covers a wide range of functionality, it helps us to consolidate our observability tool suite saving cost and time.” g2.com
✅ Integrated cost alerts and anomaly detection: “Spike alerts… notify you when a service exceeds thresholds… [so you can] proactively manage and control costs.” finout.io
⚠️ Expensive as usage scales: “While Datadog is very powerful, the pricing can become expensive for small or growing teams as costs increase with the number of metrics and hosts.” g2.com
⚠️ Requires constant cost governance: “Datadog becomes expensive very quickly… Even with strict retention… the monthly bill requires constant governance.” g2.com
⚠️ Paying for unused resources: “Cost is somewhat high; we have to pay even [if] we utilize the resources or not.” g2.com
Dynatrace cloud cost management
Capterra: 4.6/5
Trial days: 15
Best for: Full-stack cloud observability with built-in cost insights.
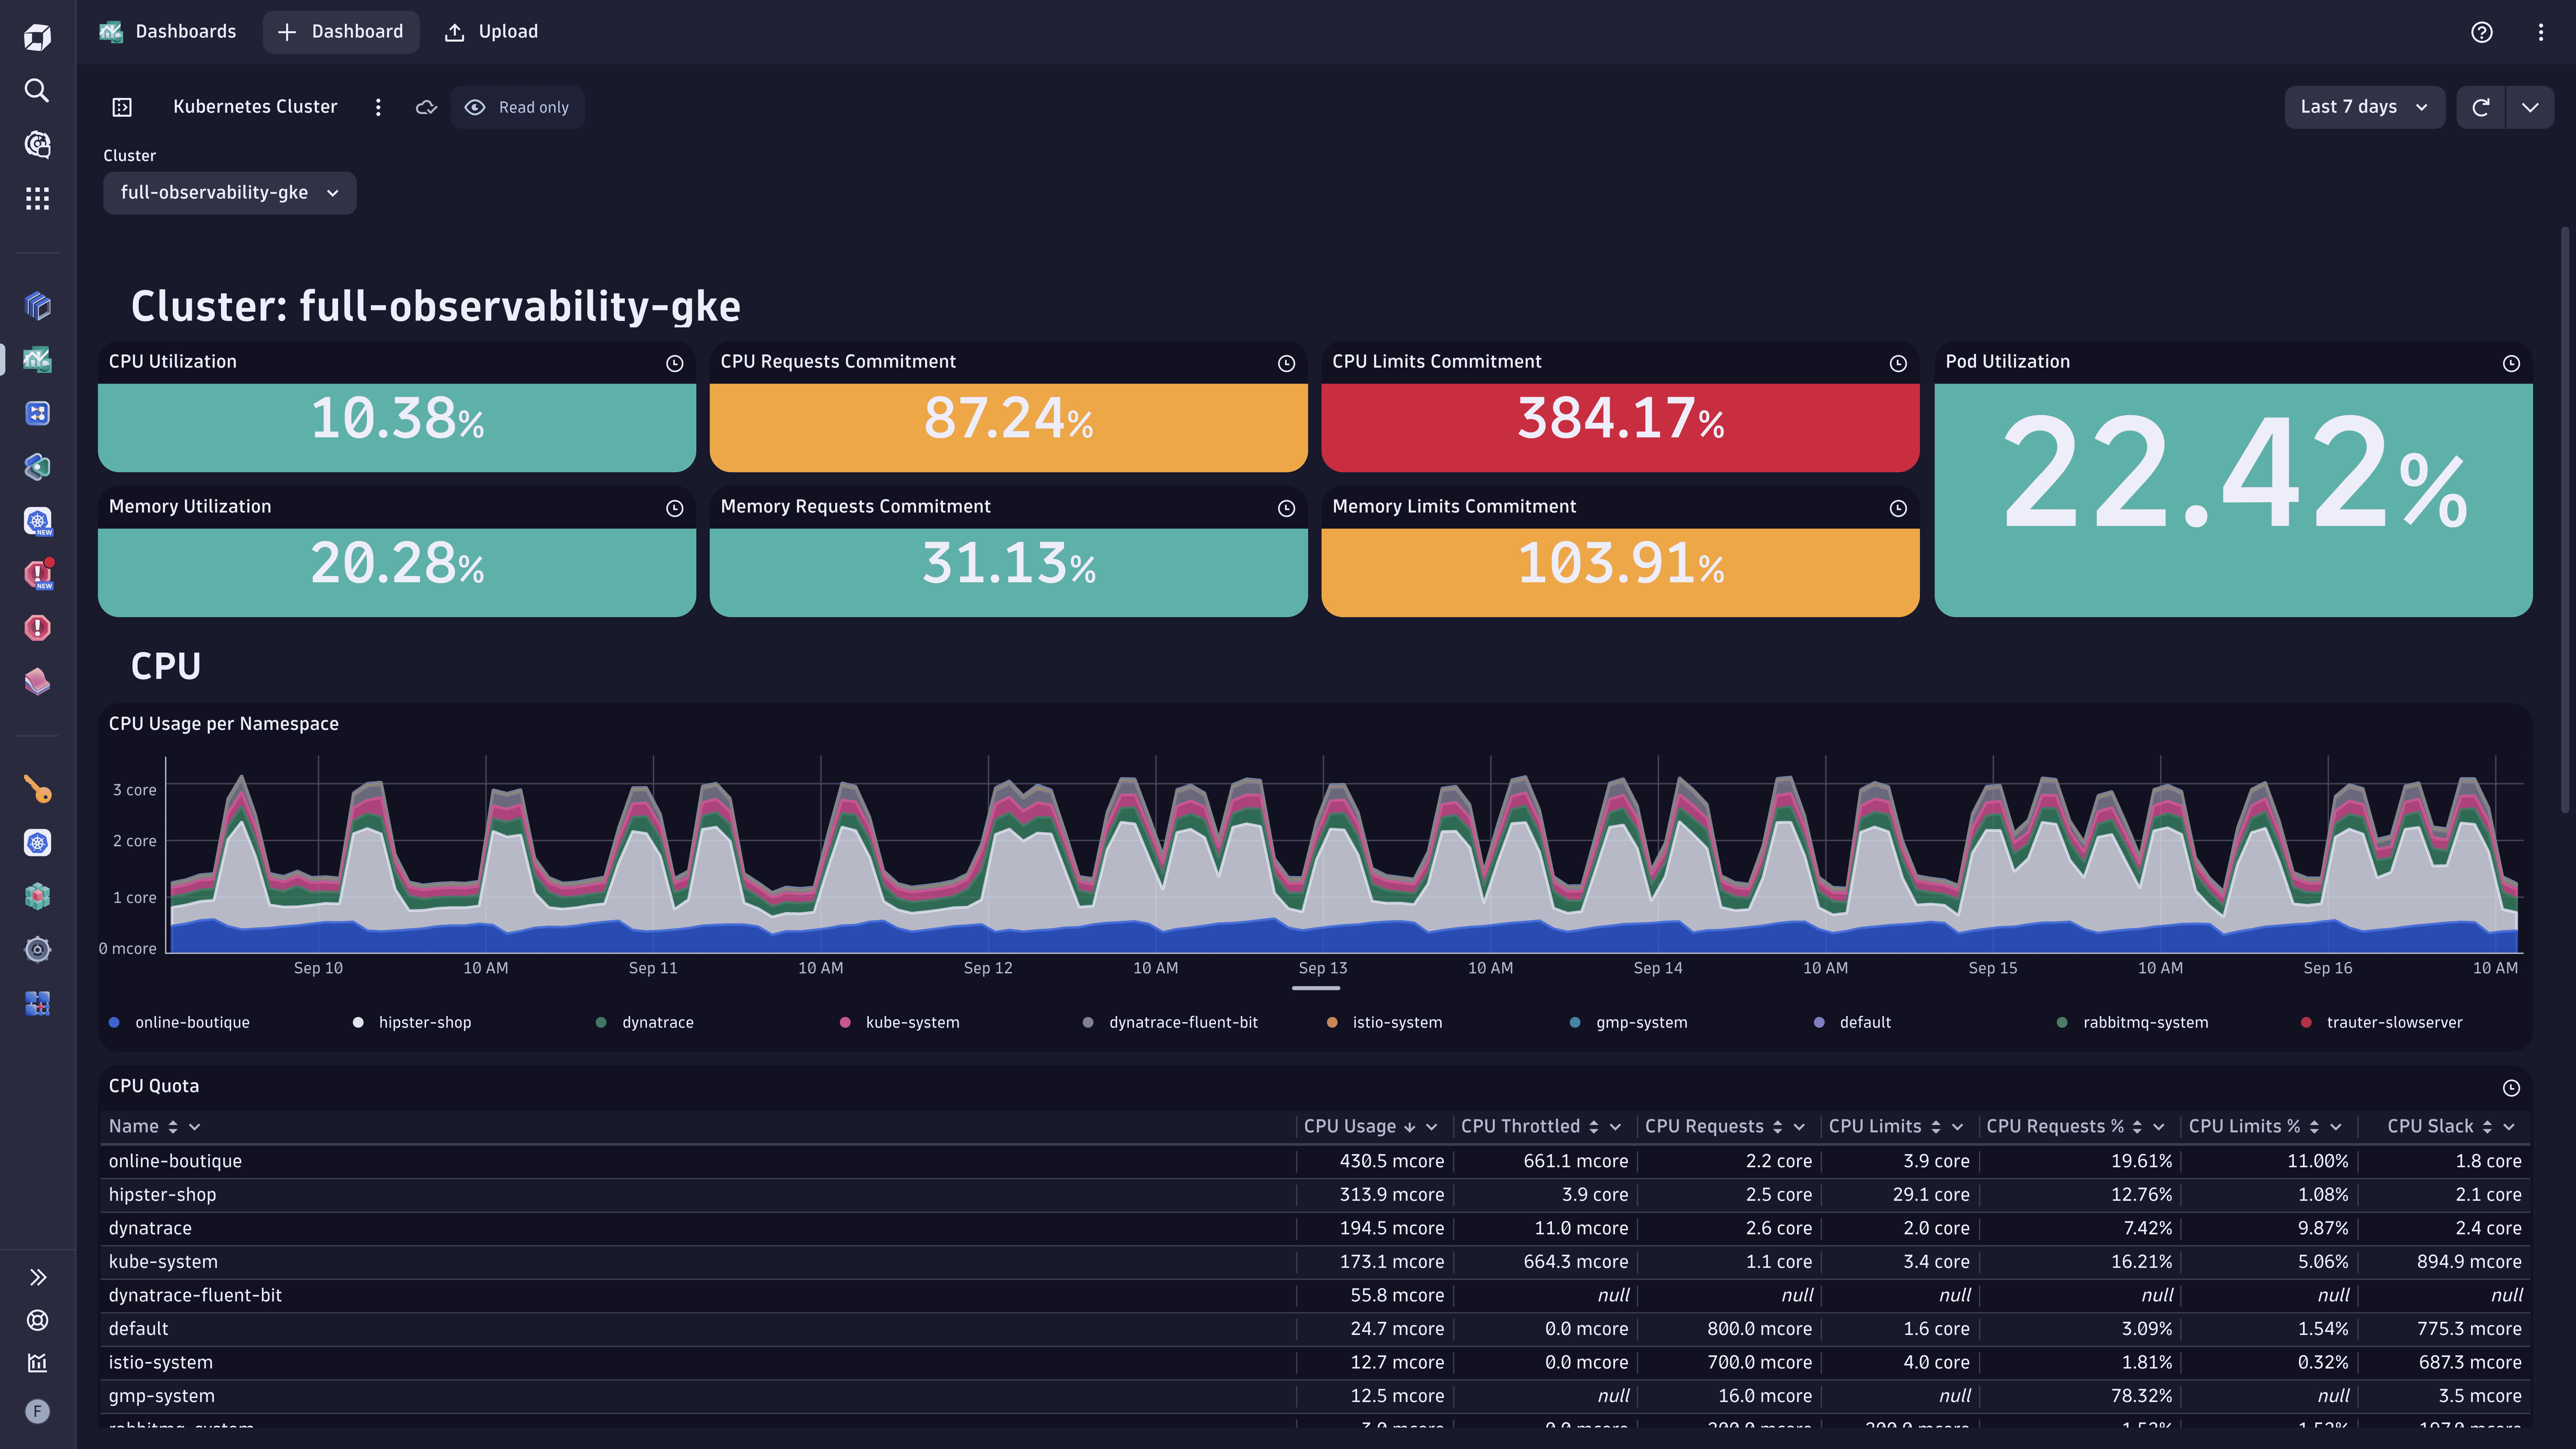
Dynatrace gets called in when teams want answers fast – and not just uptime answers. We’re talking cloud cost tied to code, to traffic, to user sessions. Dell, Kroger, and SAP use it to surface high-costs transactions, idle containers, and inefficient service-to-service chatter.
Available on AWS Marketplace, it’s deeply integrated with Kubernetes, serverless, and traditional workloads. The edge? Davis AI. It doesn’t just observe, it explains spend spikes and suggests where to tune.
Among AI-first management platforms, Dynatrace nails optimization without making engineers chase metrics.
Features
- Davis AI-powered cost management and anomaly alerts.
- Automatic detection of over-provisioned AWS resources.
- Smart tagging and entity-based attribution.
- Real-time service-to-cost correlation.
- Predictive cloud cost forecasting.
- Unified view of infra + usage + spend trends.
Pricing
Dynatrace charges by what you monitor, not who’s logging in. You’re looking at $21/month per 8 GiB host for infra monitoring – stack more services like APM or log management, and your spend climbs accordingly. Their cloud cost management module rides on top of existing usage, no separate SKU.
Trial lasts 15 days, and it’s fully featured – every dashboard, every anomaly alert, every Davis AI whisper.
This tool isn’t built for light use. It’s one of the few tools that lets you trace app performance directly into cost optimization triggers, without bouncing between platforms. That alone justifies the investment for serious FinOps teams.
Pros & Cons
✅ Strong multi-cloud support: “It offers great support for cloud native applications such as AWS, Azure and GCP cloud.”
✅ Automated configurations reduce errors: “Automated configurations… reduces the error possibilities that can come during manual setup.”
✅ Premium solution with high value: “They charge a premium but do offer one of the better solutions on the market.”
⚠️ High license cost: “Licence is high cost for this usage.”
⚠️ Unaffordable for small companies: “Highly costly that small companies may not afford to implement.”
⚠️ More expensive than simpler tools: “Dynatrace is much more expensive than [Pingdom]… but it does a better job of … monitors.”
IBM Cloudability
Capterra: 4.3/5
Trial days: 14–28
Best for: FinOps teams in large organizations (especially finance, healthcare, media)
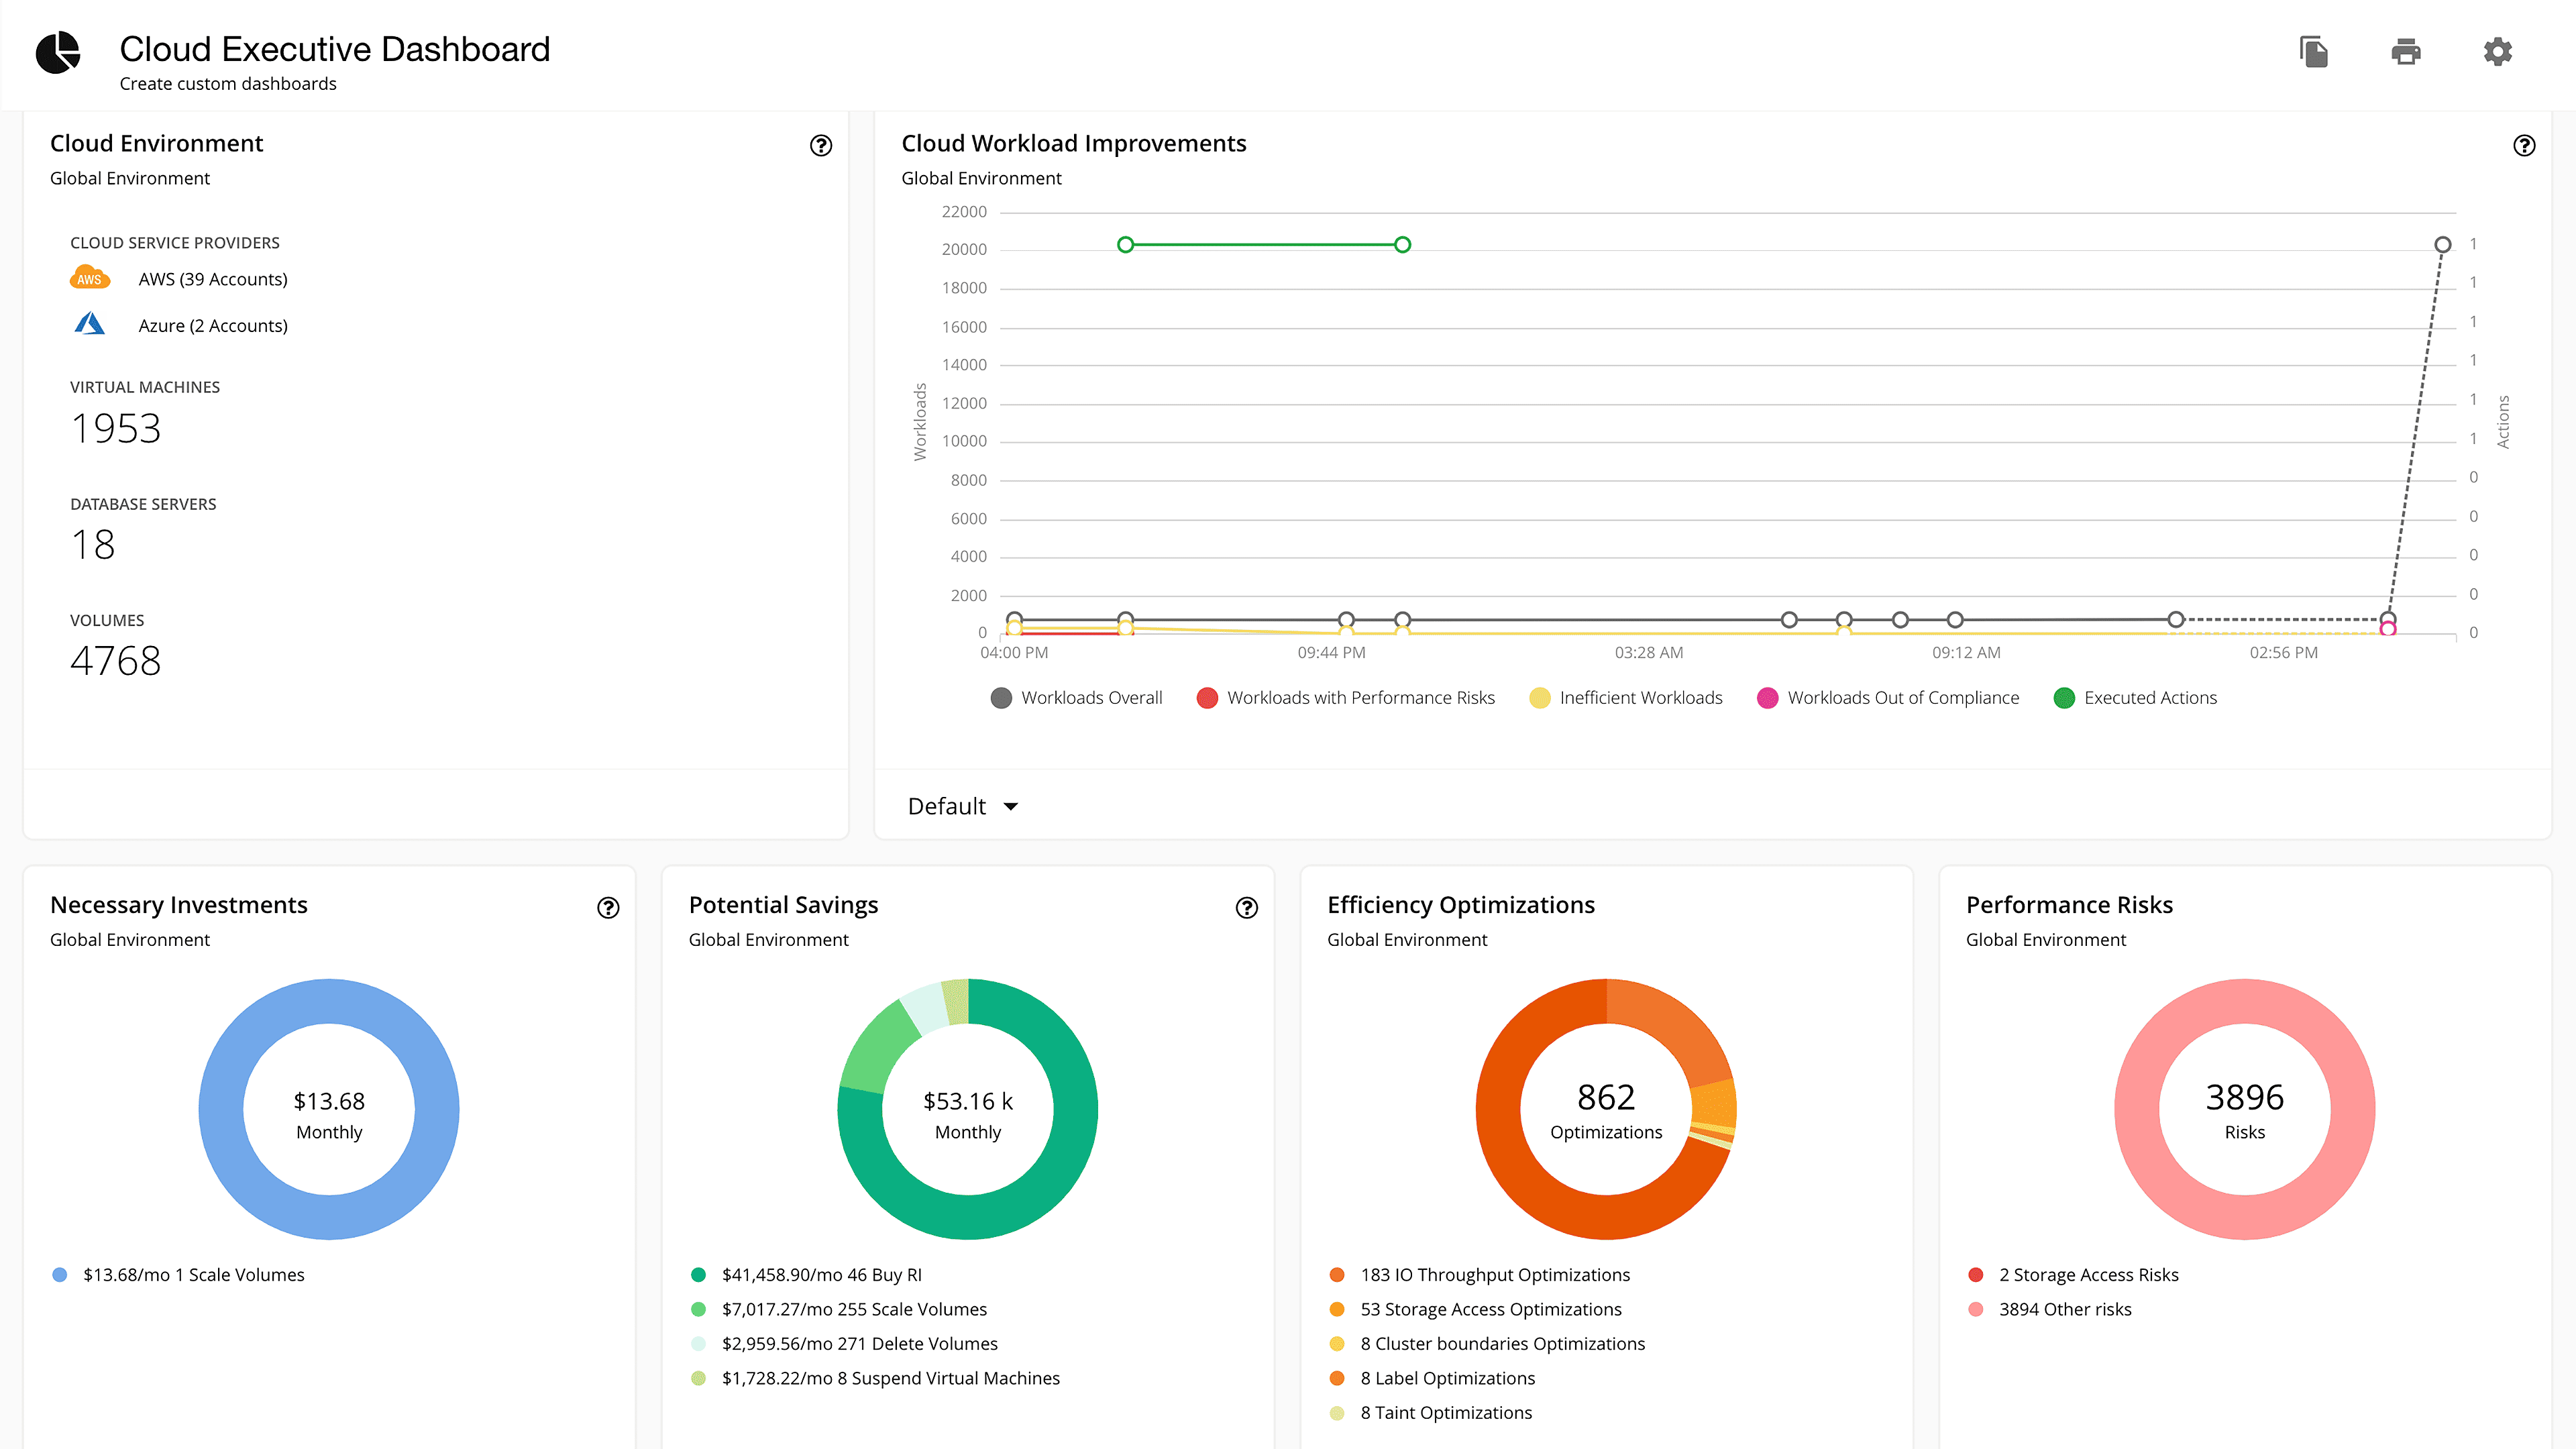
IBM’s Cloudability – yeah, the one under the Apptio umbrella – is what massive FinOps teams lean on when tagging, chargeback, and cloud cost forecasting go sideways. Think HBO, Accenture, and Pearson. They use it to allocate shared costs, model future cloud run pricing, and hold business units accountable across AWS, Azure, GCP, and hybrid stacks.
It’s listed on AWS Marketplace and integrates cleanly with enterprise ITFM tools. The standout move? Native support for Kubernetes + showback, built with finance and engineering in mind.
Gartner keeps it on the leaderboard for cloud cost management solutions that scale past $10M/month in cloud spend.
Features
- Automated tagging + allocation for shared resources.
- Accurate forecasting with dynamic cost management.
- Multi-cloud + container-aware management views.
- Custom dashboards for BU-level tracking.
- Support for RI/SP tracking and cloud cost commitments.
- Integration with procurement and IT finance systems.
Pricing
IBM’s Cloudability doesn’t do sticker pricing. You’ll need to request a quote, but ballpark starts around $3,000/month – scaling with connected accounts, cloud cost management features, and data volume. Pricing flexes based on platform modules: RI/SP coverage, showback, and deep optimization workflows.
Trial runs 14 to 28 days depending on contract stage. You get full access – dashboards, policies, anomaly detection – no gating.
Among enterprise tools, it’s built to align finance and engineering around spend accountability. The tool shines most when teams are chasing real cost optimization goals across clouds, containers, and business units. Think scale, not side project.
Pros & Cons
✅ Granular cost visibility by department: “The feature that allows viewing Azure consumption by different areas, departments, and applications is extremely valuable, aiding in operational awareness and strategic planning.” g2.com
✅ Real-time insights and cost sharing: “I greatly value the almost real-time data… ensures I can modify forecasts as necessary. … The ability to perform cost sharing is particularly beneficial, as it enables more accurate budgeting and financial planning across teams.” g2.com
✅ User-friendly with quick setup: “IBM Cloudability’s ease of use… allows for easy adoption even by non-technical personas. … Effective in managing cost and usage analysis with detailed breakdown and customization across various dimensions.” g2.com
⚠️ Limited visualization and analytics: “IBM Cloudability’s visualization capabilities [are] lacking, with insufficient charts, graphs… The low visualization quality hinders my ability to effectively interpret data.” g2.com
⚠️ Container cost optimization gaps: “The Apptio container agent… primarily serves as a cost reporting tool without offering many right-sizing recommendations.” g2.com
⚠️ Can be expensive for modest spend: “Can be expensive, especially for smaller organizations with modest cloud spend.” blog.invgate.com
Read also: 10 Cloud Cost Optimization Benefits & Why It’s a Must In 2026
CloudZero
Capterra: 4.9/5
Trial days: 14
Best for: Engineering-led SaaS/FinOps teams; it shines at mapping cloud spend to business metrics (product, feature, customer) and providing unit-cost analytics.
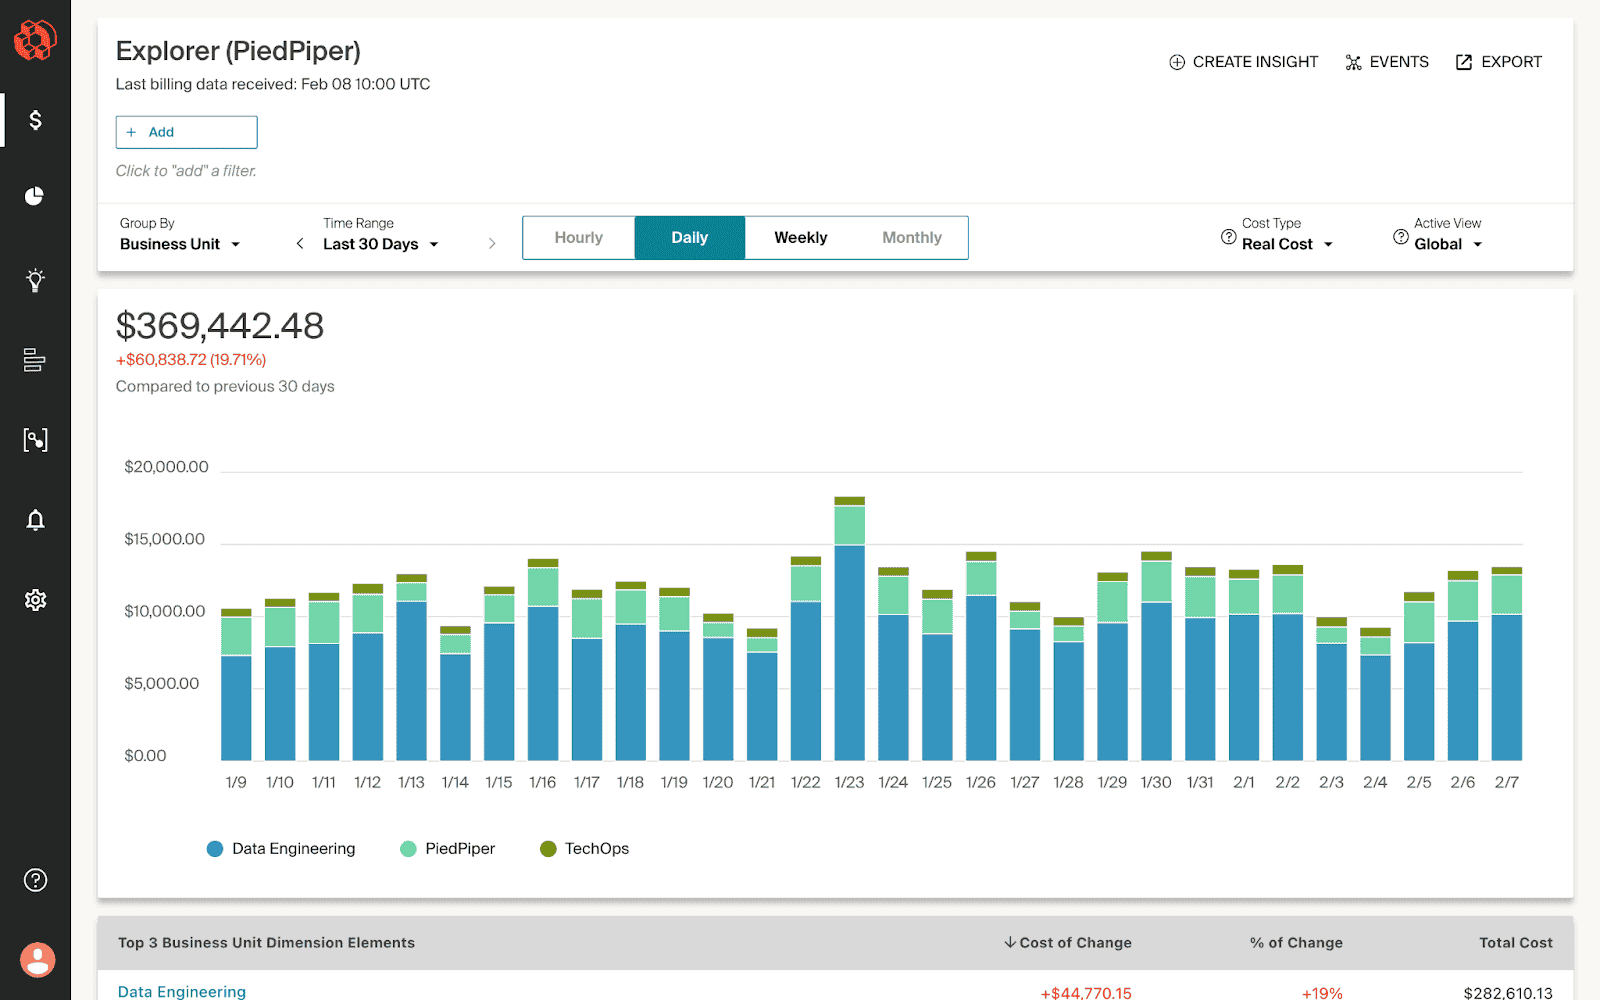
CloudZero flips the script on cloud cost management by making engineering teams the heroes of spend. Rapid7, Malwarebytes, and Drift use it to track AWS spend down to the product, feature, or customer – without needing perfect tags. This isn’t just another tracker. It’s one of the few cloud cost management tools that maps cloud usage to business outcomes.
Works via direct integrations and through AWS Marketplace. No agents. No fluff. The edge? It’s built for speed and scale – real-time alerts, per-deploy cost views, and anomaly detection that makes sense to humans.
Analysts call it one of the most focused multi cloud cost management tools on the market for teams pushing FinOps maturity fast.
Features
- Real-time per-dimension cost optimization.
- Cost per feature, customer, deploy.
- Alerts for cloud cost anomalies.
- Custom dashboards for engineers and finance.
- Native support for Kubernetes and untagged resources.
- API-first design with fast time-to-value for tools teams.
Pricing
CloudZero prices by monthly cloud costs under management, not hosts or seats. Plans start around $1,000/month for smaller environments and scale with your cloud cost footprint. That means a startup spending $50K/month pays less than a scale-up dropping $500K.
You get a 14-day trial – full features, no restrictions. Expect onboarding help baked into that window.
The model aligns with how FinOps leaders think: pricing that scales with cost management complexity, not just infrastructure size. For teams serious about linking management and margin, this one's tuned right.
Pros & Cons
✅ Clear cost visibility: “CloudZero provides clear visibility into cloud costs, enabling teams to make informed decisions and optimize spending effectively.”
✅ Budgeting efficiency: “I find CloudZero incredibly useful for cost analysis… it allows monitoring every step effectively and facilitates creation of budgets efficiently. The main benefit is the significant amount of time I save using it.”
✅ Multi-cloud spend tracking: “CloudZero helps customers view their multicloud spend in a single dashboard for tracking cloud costs… identify cost anomalies… provides meaningful insights to optimize monthly cloud costs… persona based dashboards for leadership, finance, operations.”
⚠️ Complex setup: “I found the initial setup a bit complex, which could be overwhelming for new users.”
⚠️ Limited customization: “It’s not possible to create your own dashboard – you have to work with the customer success team.”
⚠️ Price and learning curve: “CloudZero can be pricey for smaller teams, has a learning curve for advanced features, and focuses mainly on cost intelligence rather than full governance tools.”
VMware CloudHealth
Capterra: 4.9/5
Trial days: 14
Best for: Enterprise FinOps teams needing robust multi-cloud governance.
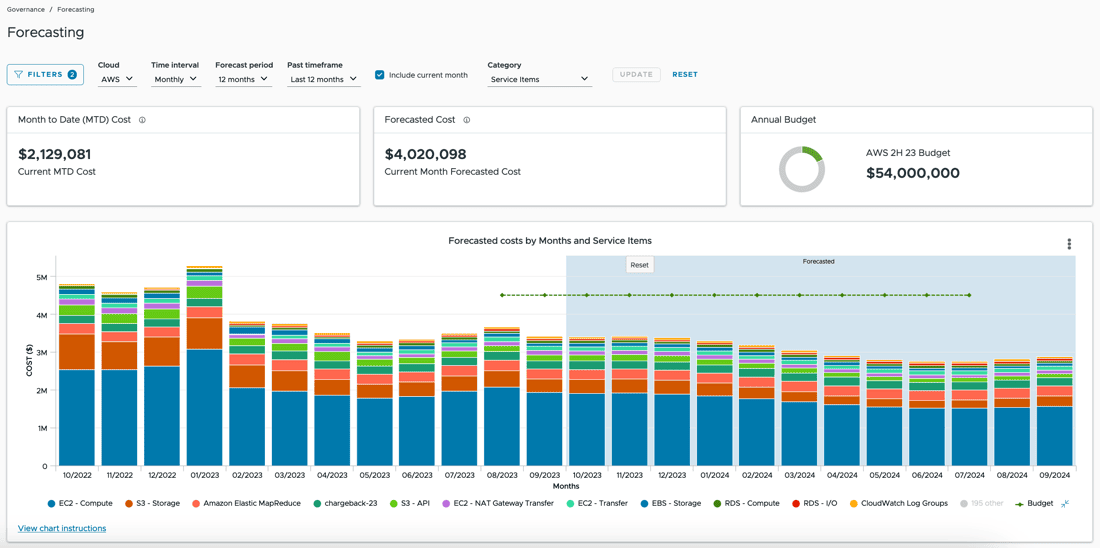
VMware’s CloudHealth is one of those cloud cost management tools that keeps popping up in enterprise FinOps playbooks – and for good reason. Pinterest, Yelp, and News Corp use it to track and allocate millions in cloud cost, slice up spend by team or BU, and lock down budgets before CFOs get cranky.
It’s available in the AWS and Azure Marketplaces and plugs into hybrid or full-multi-cloud setups. What sets it apart? Deep policy automation plus finance-grade reporting. CloudHealth helps teams operate cloud, not just monitor it.
Stack it next to any other cloud cost management software, and you’ll see how enterprise-ready cost optimization and governance feel when they’re baked into the bones.
Features
- Policy-based cost management and rightsizing.
- Forecasting and budgeting guardrails.
- Reserved Instance + Savings Plan tracking across AWS.
- Custom views for engineering vs. finance.
- Tag auditing + enforcement.
- Executive-level cloud spend management dashboards.
Pricing
CloudHealth runs a usage-based pricing model – calculated as a percent of monthly cloud spending, typically around 1–3%. So if your team’s running $100K/month in cloud, expect to pay ~$1,000–$3,000/month.
No public pricing page, no standard trial – but some partners offer custom demos and onboarding pilots.
As one of the most popular FinOps tools for cloud cost management, it scales across business units, tracks shared cost allocation, and integrates into existing financial workflows.
Among management tools, it handles cloud spend governance at real enterprise depth – forecasting, tagging compliance, and serious cost optimization at scale. If you’re tracking FinOps maturity in months, CloudHealth shortens that timeline.
Pros & Cons
✅ Cost optimization & budgeting: “CloudHealth helps my organization to optimize costs and to keep budgeting proposals and documentation organized.”
✅ Real-time cost visibility: “Easy to configure for custom use cases. Gives visibility into real time costs. This gives overall business process visibility.”
✅ Intuitive cost trend reporting: “CloudHealth generates tables which provide visual trends in cloud usage and helps identify any areas where cloud usage costs might be excessive.”
⚠️ Steep learning curve: “Sometimes I struggle to master the user interface; [CloudHealth] could use a tutorial or some other way of learning more about how to best use the services.”
⚠️ Performance/connectivity issues: “Connectivity… speed issues… sometimes the screen will lag for a few seconds and even freeze on me for a minute or two.”
⚠️ Fragmented cost guidance: “I would have liked if CloudHealth had a central view of all cost-saving recommendations; without that it’s harder to understand how to save on cloud costs.”
Finout
G2: 4.5/5
Trial days: 14
Best for: Teams needing very precise cost allocation across cloud, SaaS, and Kubernetes, even without perfect tagging.
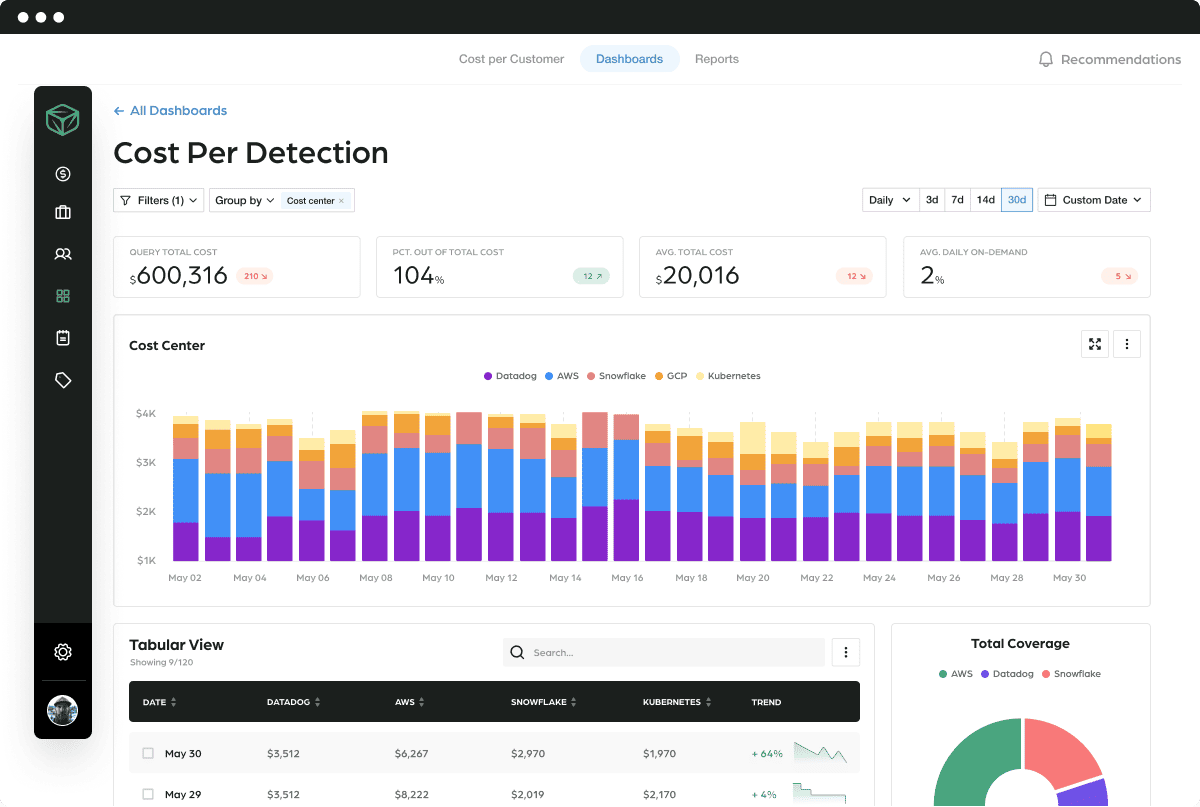
Finout is what you bring in when tagging falls apart and finance still needs clean answers. Lemonade, Wiz, and BigID use it to untangle messy cloud cost data and build accurate cost management models – even when tags are missing or inconsistent. It connects across AWS, Datadog, Snowflake, and K8s, pulling real-time spend into one readable story.
You’ll find it on AWS Marketplace. Its edge? Virtual tagging. It lets you allocate costs post-hoc, across clouds, teams, even shared services. Fast setup, clean UI, powerful engine.
Among cloud cost management solutions, this one’s built for modern infra chaos.
Finout cloud cost management features
- Virtual tagging + shared cost allocation.
- Custom unit economics views.
- Anomaly detection for sudden cloud spending.
- Granular per-service + per-namespace breakdowns.
- Support for K8s, Snowflake, and observability tools.
- Enterprise-grade multi cloud cost management tools dashboarding.
Pricing
Finout skips per-seat pricing and goes straight for what matters: cloud spend volume. Plans start at $3,000/month for teams managing up to $500K in monthly cloud spending. Above that? You’re in “call us” territory.
Trial? Nope. You book a demo, then step into onboarding with full support.
It’s positioned as cloud expense management software built for messy infra – virtual tagging, untagged splits, Snowflake joins, the works. For teams needing bulletproof cost allocation without wasting months wiring up homegrown management tools, Finout hits fast.
Among modern multi-cloud cost management tools, it’s a rare mix of dev-friendly UX and financial rigor. You get unit economics, alerts, and cost optimization triggers tied to your architecture – and every FinOps stakeholder stays looped in.
Pros & Cons
✅ Ease of use: “It’s simple to use for everyone (not only FinOps engineers), easy to create reports/dashboards and to view the costs.”
✅ Advanced tagging: “The virtual tagging feature allows cost allocation on resources that are related to the same project over different clouds.”
✅ Cross-cloud cost visibility: “Finout provides a clear and detailed view of cloud costs, making it easy to track expenses across different services and teams.”
⚠️ Complex setup: “The initial setup and integration with multiple cloud accounts can be a bit complex and time-consuming. Some advanced features require a learning curve.”
⚠️ Overwhelming data: “Finout can be quite complex at times… for new users, the learning curve can be steep due to the sheer volume of data it presents.”
⚠️ Missing basic views: “It lacks some basic views, like amount of machines per account per day… I can’t monitor EC2’s utilization like I could elsewhere.”
Read also: 9 Cloud Cost Management Strategies From FinOps pros
Opentext FinOps
G2: 4.2/5
Trial days: 90
Best for: Mid-to-large enterprises with formal FinOps governance
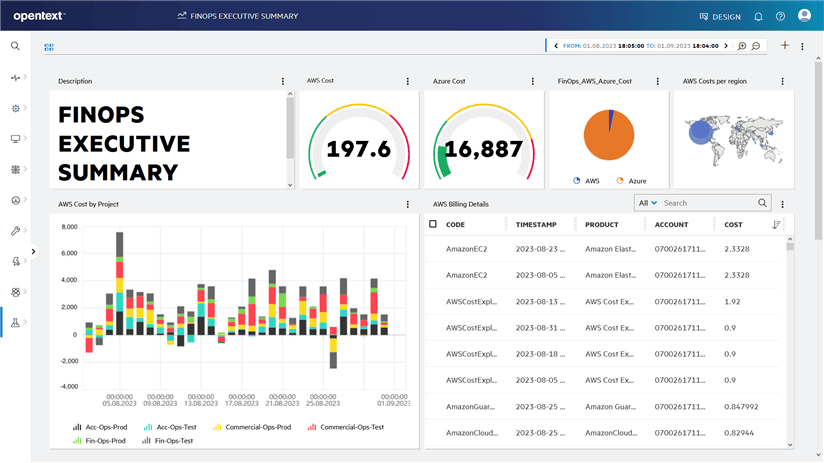
OpenText shows up when legacy meets scale – when a global org is juggling 300+ apps and cloud cost chaos is slowing everyone down. Vodafone, Hitachi, and Zurich Insurance rely on it for dynamic provisioning, costs tracking, and tight policy controls across hybrid stacks. It’s in the AWS Marketplace and plays well with ServiceNow and VMware.
This isn’t a bolt-on dashboard. OpenText wraps provisioning, budget guardrails, and chargeback into automated workflows. The power move? Everything routes through ITSM approvals – infra spins up only if the budget says go.
Among cloud cost management tools, this one was built to handle scale without losing track of detail. GigaOm lists it among the best cloud cost management software for hybrid IT.
Features
- Service-aware cost management with approval chains.
- Automated anomaly alerts tied to business services.
- Centralized cloud cost and usage reporting.
- Integrated tools for provisioning and tagging compliance.
- Multi-cloud and on-prem inventory visibility.
- Continuous optimization with policy enforcement.
Pricing
OpenText HCMX doesn’t publish pricing, but here’s what surfaced from enterprise RFPs: expect $25K–$100K+ annually depending on features, users, integrations, and volume of cloud spending under control. Trials? Yep – 90 days with onboarding support baked in.
Pricing flexes with module depth: provisioning, cost allocation, policy automation, and integrations with tools like ServiceNow or vCenter.
It’s built for orgs managing $1M+ in cloud spend, where cost optimization must align with procurement and compliance. Among management tools, OpenText threads ITIL rigor into the FinOps flow. If your financial team needs audit-grade reporting and your platform team wants automation without surprises, this structure holds up.
Pros & Cons
✅ Cost-to-value proposition: “It has better cost benefits to the features and functionalities it offers and has more customer success stories.”
✅ Operational consistency: “My favourite aspect is its operational consistency.”
✅ Cloud spend optimization: “OpenText Cloud Management delivers total visibility and operational consistency across all your clouds. Now you can optimize cloud spend based on actionable insights.”
⚠️ Complexity and learning: “One of the dislikes… is its complexity and steep learning curves for new users or organizations at large, without prior knowledge and experience.”
⚠️ Complicated financial ops: “I dislike its financial operations functionality which is a bit complicated.”
⚠️ High cost: “OpenText Cloud Management involves higher initial costs with a focus on long-term value through its comprehensive management capabilities.”
Ternary
Capterra: 4.9/5
Trial days: 60
Best for: Enterprise FinOps groups and MSPs on multi-cloud.
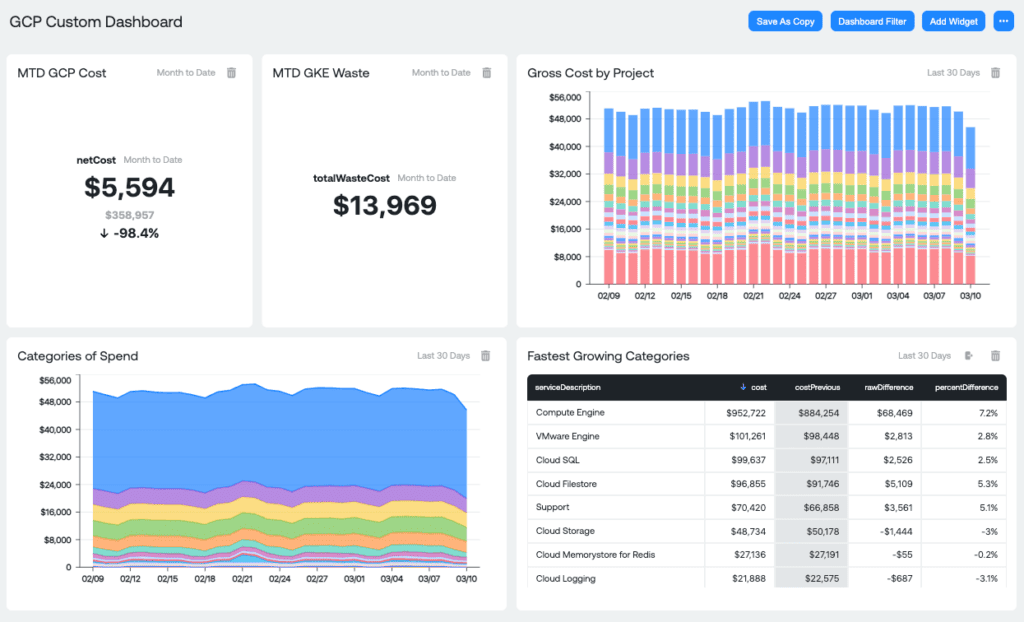
Ternary is built for teams who live and breathe Google Cloud – and need cloud cost control that’s more than pretty dashboards. Companies like Equifax and Ocient use it to drive tagging hygiene, real-time budget enforcement, and detailed costs per team, app, or feature. It's known as the experts' choice for Google Cloud cost management, and now supports AWS, Azure, and OCI too.
You’ll find it on the Google Cloud Marketplace. What sets it apart? Forecasting that actually works – built with FinOps DNA and cloud-native nuance. Budget alerts plug straight into Slack or Jira.
As far as modern cloud cost management software goes, Ternary balances engineer-friendliness with finance-grade accuracy.
Features
- ML-based forecasting + budget alerts.
- Flexible cost allocation by label, service, BU.
- Kubernetes-aware spend tracking.
- Policy-driven optimization guidance.
- Multi-cloud dashboarding for FinOps teams.
- API-first integrations with your favorite tools.
Pricing
Ternary prices by cloud spend under management – starts around $1,000/month for teams running up to $100K in monthly cloud spending, then climbs with usage and feature depth. No per-seat surprises.
You get a full 60-day trial to test automation, dashboards, and alerts across clouds. Everything’s API-first, engineer-friendly, and FinOps-ready.
Plans flex by connected providers, volume, and integrations. The model’s built for management tools that need to land cleanly inside Jira, BigQuery, or Slack without friction.
Among cloud spend management software, Ternary hits the sweet spot: detailed cost allocation, real-time alerts, and financial insight without layers of enterprise fluff.
Pros & Cons
✅ Strong cost savings: “Our cloud infrastructure costs were 17% of non-GAAP revenue. We reduced that down to 8% of non-GAAP revenue with Ternary.”
✅ Improved transparency and control: “Implementing Ternary… has greatly improved cost transparency and accountability. We can allocate and monitor cloud spending with greater efficiency and control.”
✅ Faster analysis: “Before using Ternary, it would take me hours to analyze our cloud costs. Now I have a single source of truth for all my cloud spending… Alert Tracking lets me instantly identify and investigate cost changes, saving valuable time…”
⚠️ GCP-centric design: Ternary was “built for Google Cloud on Google Cloud,” which may limit its out-of-the-box focus on other cloud platforms.
⚠️ Lack of user reviews: G2 shows “This product hasn’t been reviewed yet!”, indicating limited independent user feedback to identify potential disadvantages.
⚠️ New market entrant: As a recently funded startup (e.g. raising $12M, some users may consider its relative newness and evolving feature set a risk.
Cloud cost management tools comparison
| Tool | Allocation | Showback / chargeback | Forecasting | Anomaly detection | Commitment management |
|---|---|---|---|---|---|
| Cloudaware | Yes | Yes | Yes | Yes | Partial: planning and utilization visibility |
| IBM Cloudability | Yes | Yes | Yes | Yes | Yes: broader IBM portfolio may apply |
| Flexera One FinOps | Yes | Yes | Yes | Yes | Yes: ProsperOps portfolio capability |
| CloudHealth (Broadcom) | Yes | Yes | Yes | Yes | Partial: verify automation scope |
| ServiceNow Cloud Cost Management | Partial | Yes | Yes | Not verified | Not verified |
| Harness AI and Cloud Costs | Yes | Yes | Yes | Yes | Yes |
| CloudZero | Yes | Partial | Yes | Yes | Not verified |
| Finout | Yes | Yes | Yes | Yes | Not verified |
| Vantage | Yes | Partial | Yes | Yes | Yes: AWS automation documented |
| Datadog Cloud Cost Management | Yes | Partial | Yes | Yes | Partial: coverage and utilization visibility |
| IBM Kubecost | Yes | Yes | Yes | Yes | Not verified |
| Ternary | Yes | Partial | Not verified | Not verified | Not verified |
Treat each cell as a conversation starter. “Yes” can still hide a weak provider connector, slow data, or an allocation model your finance team cannot audit.
What was left outside the main 12
Dynatrace remains relevant when observability and application performance lead the buying decision. OpenText can fit broader hybrid cloud management. Neither had enough current public evidence across this article’s five core capabilities to displace a stronger specialist.
Native tools also matter. AWS Cost Explorer, Microsoft Cost Management, and Google Cloud cost tools are often the fastest baseline for one provider. Their limits tend to appear when teams need cross-cloud normalization, shared-cost rules, business dimensions, or one operating workflow.
How to choose without buying another reporting project
A polished demo can make every platform look allocated. Real billing data is less cooperative.
- Start with one month that contains the mess: shared Kubernetes, marketplace charges, support fees, credits, commitments, and a service that changed owners. Ask each vendor to model the same month.
- Reconcile before you optimize. The platform should explain any difference from provider billing. Credits, taxes, refunds, and amortized commitments need an explicit treatment. Use a sample acceptance threshold your finance team approves. One team may require a variance below 1%. Another may accept more if exclusions are documented.
- Measure allocation coverage. Count how much spend reaches a valid owner, product, or business unit. Then inspect the remainder. A 97% allocated total can still hide the shared platform bill everyone argues about. Review the largest unallocated and rule-allocated items separately.
- Make every shared-cost rule explainable. Ask the vendor to show the numerator, denominator, source data, effective date, and owner for one allocation rule. If a finance analyst cannot reproduce the logic, showback will become a trust exercise.
- Backtest the forecast. Historical trend lines are not enough. Give the tool a past cutoff date, hide the following period, and compare its forecast with actual spend. Track forecast error by service or business unit. A single company-wide number can conceal the products that consistently miss.
- Investigate one real anomaly. Measure the time from alert to a plausible owner and cause. Fifteen alerts with no accountable team are only colorful noise. Check whether the system explains a deployment, usage change, pricing change, commitment event, or allocation-rule change. A threshold breach alone is not root cause.
- Inspect commitment permissions. Reporting coverage is low risk. Automatic purchasing is not. Document who can recommend, approve, buy, exchange, renew, and reverse a commitment. Ask how the platform handles changing workloads and unused coverage.
- Price the operating model. License cost is one line. Add implementation, data engineering, rule maintenance, premium support, and every adjacent module. The cheapest dashboard can become expensive when two analysts spend each month reconciling it.
A proof-of-concept scorecard your team can actually use
Set targets before the vendor touches the data. The values below are starting points, not industry standards.
| Test | Metric | Example acceptance rule | Evidence to retain |
|---|---|---|---|
| Billing reconciliation | Variance from provider statement | At or below the finance-approved threshold | Reconciliation workbook and exclusions |
| Allocation | Percent of spend with an accountable owner | Target agreed before testing | Unallocated-cost report and rule log |
| Shared cost | Reproducibility of one major rule | Analyst can recreate the result | Formula, inputs, dates, and owner |
| Forecast | Error on a hidden historical period | Better than the current process | Backtest and variance by service |
| Anomaly | Time to owner and plausible cause | Faster than the current investigation | Alert trail and change context |
| Commitment | Coverage, utilization, and approval control | No action outside documented authority | Recommendation and approval history |
| Workflow | Time from insight to assigned work | Owner and due date created in the normal system | Ticket, message, or API record |
Score the evidence, not the presenter. A missing export or unexplained number is a failed test, even when the dashboard looks excellent.