


Cloud cost optimization has become a real headache for most teams. Cloud spend grows faster than anyone can explain, and as companies stack AWS, Azure, and Google Cloud on top of Kubernetes, serverless, and data platforms, visibility tanks while bills keep rising.
FinOps sits right in the crossfire: leadership wants predictability, engineering wants performance, and nobody has time to chase every untagged resource, idle instance, or surprise spike.
This guide keeps things simple. It gives teams a practical, no-fluff playbook for taking back control in multi-cloud environments. The goal isn’t one-off savings — it’s a sustainable way to reduce spend without slowing delivery or risking production.
In this guide, you’ll find:
- What cloud cost optimization actually means today
- How it differs from cost management and FinOps
- How the optimization lifecycle really works
- Core tactics for compute, storage, and Kubernetes
- Provider-specific strategies for AWS, Azure, and GCP
- Where AI and automation are worth using
- Lessons from a real multi-cloud optimization case
What is cloud cost optimization?
Cloud cost optimization is the discipline of making cloud spend predictable, efficient, and tied to real business value — not guesswork.
At its core, it means understanding what your workloads consume, why the bill looks the way it does, and which levers you can pull without hurting performance. As cloud infrastructures grow across multiple providers and platforms, optimization becomes the only way to keep cloud spending from drifting out of control.
Definition and core principles
Cloud cost optimization is the continuous process of improving how an organization uses the cloud so every dollar spent has a clear purpose.
When people ask about the cloud cost optimization definition, the answer is more practical than theoretical: see your cloud resources clearly, understand who owns them, and remove the parts that add cost but not value.
Core principles
- Visibility first. You can’t optimize what you can’t see
- Clear ownership. Unowned resources never get fixed
- Iterate often. Cloud usage shifts constantly
- Balance matters. Good optimization protects performance
In practice, this means right-sizing workloads, cleaning up unused resources, improving cost visibility, and using pricing models that match how workloads behave.
Read also:
Why cloud cost optimization is harder in multi-cloud & Kubernetes era
Optimization used to be simpler when teams lived in a single provider with predictable workloads.
Multi-cloud changed the equation: every provider has different pricing, discount models, storage tiers, and egress rules. Kubernetes adds another layer of abstraction — pods scale, shift nodes, and move across zones without showing that behavior clearly on the bill.
Why it complicates cloud spending
- Different pricing models across clouds
- Autoscaling creates unpredictable spikes
- Kubernetes hides actual compute usage behind abstractions
- Shared services blur allocation boundaries
- Tagging breaks as environments grow
How cloud cost optimization fits into cloud financial management
Cloud cost optimization is the “action layer” of cloud financial management. Cost management tells you what you’re spending. And optimization is where teams actually make changes that lower costs without slowing engineering.
Think of it as the bridge between visibility and outcomes: once you know where money goes, optimization turns that insight into engineering work, better configuration choices, and repeatable efficiencies.
In the FinOps Framework, this alignment shows up in the three stages teams move through over and over again: Inform → Optimize → Operate. The Inform layer gives you the facts, Optimize turns those facts into engineering changes, and Operate keeps everything steady through reviews, guardrails, and shared accountability.
The table below shows how those layers map to real cloud financial management inputs.
| Layer | What it Provides | What Optimization Does with It |
|---|---|---|
| Visibility (Inform) | Billing data, allocation, tagging, unit costs | Identifies waste, over-provisioning, unused resources |
| Controls & guardrails (Operate) | Budgets, alerts, governance, KPIs | Converts rules into engineering actions & automation |
| FinOps practices | Ownership, shared accountability, cross-team workflows | Trades off cost vs performance with engineering & product |
| Engineering inputs | Usage patterns, performance baselines, deployment cadence | Applies rightsizing, scheduling, scaling, and pricing strategies |
Read also: 10 Cloud Cost Optimization Benefits or Why It’s a Must In 2026
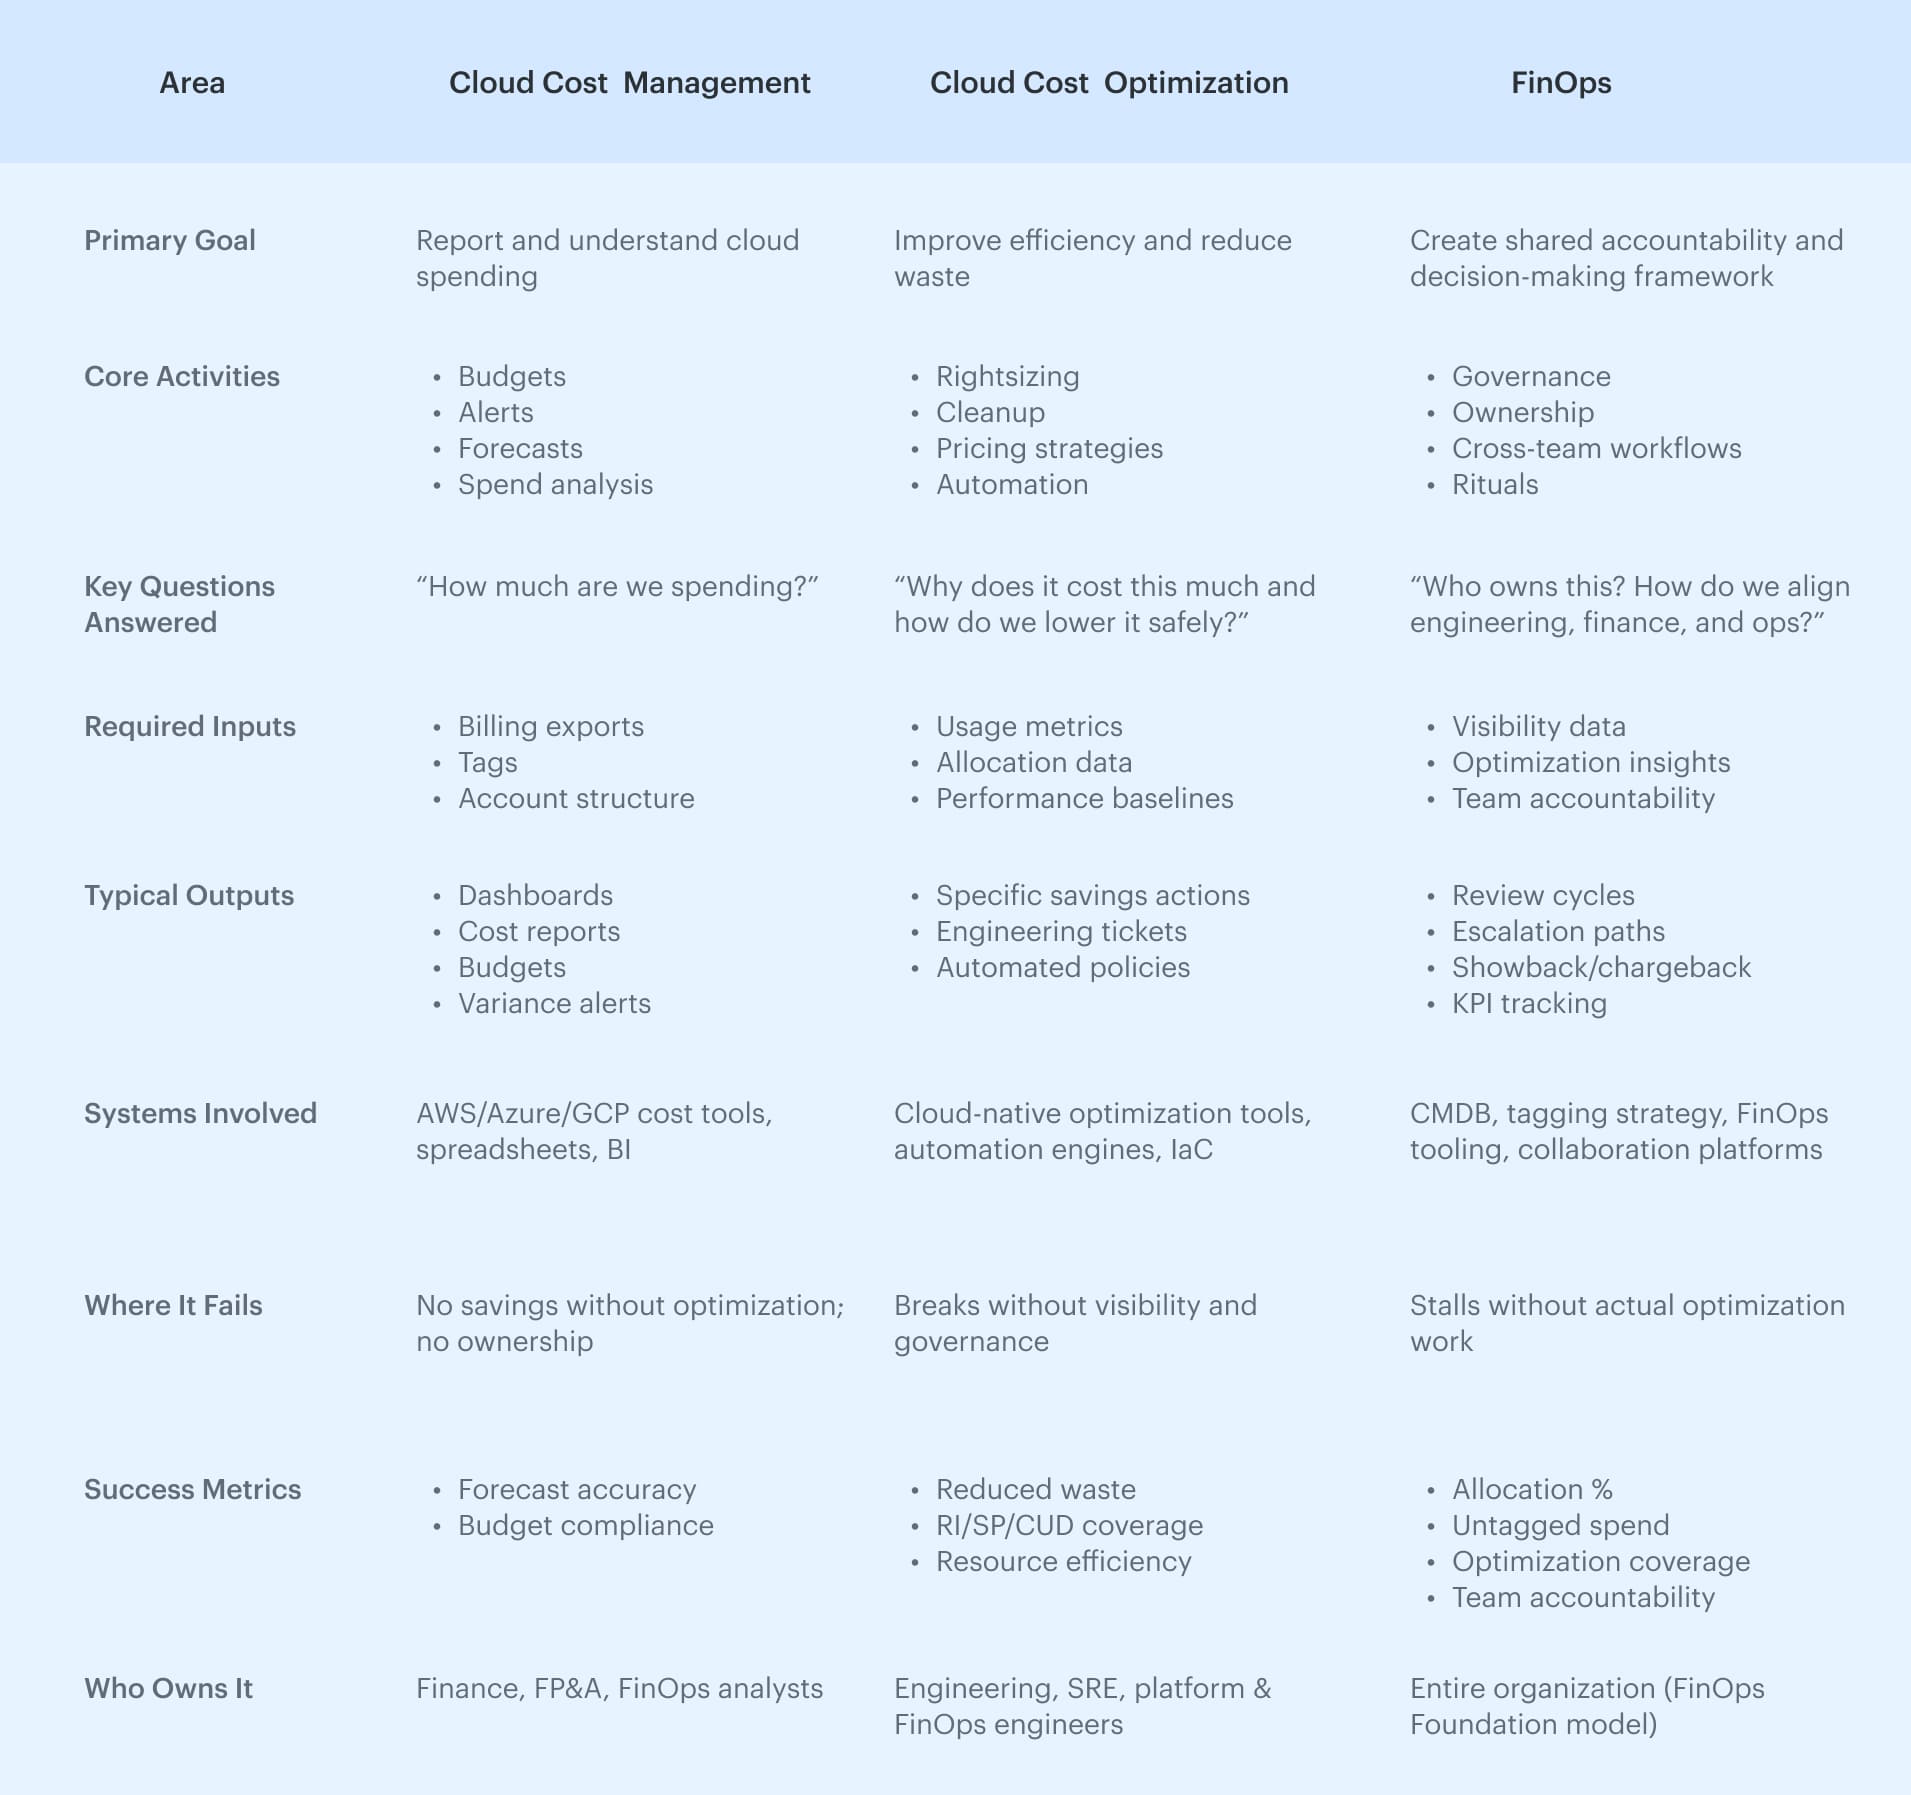
Cloud cost optimization vs Cloud cost management vs FinOps
People often group these three, but they solve very different problems. Most confusion around cloud cost management vs FinOps comes from trying to treat them as one discipline.
A simpler way to think about it:
- Cost management tells you what’s happening
- Optimization fixes what’s happening
- FinOps makes sure the right people stay involved
When those pieces work together, teams stop reacting to bills and start controlling them.
Cloud cost management: budgets, reports & alerts
Cloud cost management is the bookkeeping layer of the cloud. It gives you reports, dashboards, budgets, alerts, and forecasts.
Useful — but limited. Cost management surfaces problems; it doesn’t solve them. It won’t resize a cluster, clean up old snapshots, or tell engineers why their service suddenly doubled in cost. Without ownership or follow-through, cost management becomes a nice set of charts that nobody takes action on.
Cloud cost optimization: rightsizing, eliminating waste & automation
Cloud cost optimization is where change actually happens. This is the hands-on work: rightsizing instances, cleaning up unused resources, tuning autoscaling, shrinking oversized databases, adjusting storage tiers, or moving workloads to better pricing models.
It’s tactical, engineering-heavy, and very practical. Good optimization lowers spend without slowing teams down. When people talk about cloud cost management and optimization, this is the “optimization” part — the layer that turns insights into results rather than noise.
FinOps: operating model, maturity benchmarks & roles
FinOps is the operating model that makes both management and optimization sustainable. It creates shared ownership across engineering, finance, and product so cloud decisions aren’t made in isolation.
A healthy FinOps cost management practice usually includes:
- Clear ownership for services and environments
- Reliable allocation and tagging
- Regular reviews with engineering (not once a quarter)
- Measurable benchmarks
- KPIs that track whether teams are actually improving
FinOps doesn’t replace optimization. It makes sure optimization keeps happening — and that cost decisions match how the business works, not just how the bill looks.
Cost Management vs Cloud Cost Optimization vs FinOps:
How to optimize cloud costs in 2026
Teams that manage multi-cloud costs consistently tend to follow the same rhythm. First, you figure out what’s actually running. Then you attach ownership. After that, you hunt down waste, fix what needs fixing, and keep looping.
This approach works everywhere — AWS, Azure, GCP, Kubernetes, serverless, even old VM clusters that nobody wants to touch.
Step 1. Discover & normalize cloud spend across providers
Everything starts with clean numbers. Multi-cloud billing is all over the place: different SKUs, different units, different naming, different ways of counting discounts. Before any real cost optimization in cloud environments happens, the spend has to be pulled into one format that people can understand at a glance.
You're usually normalizing:
- Currencies
- Discount attribution
- Commitment usage
- SKU mappings
- Regional price differences
What you end up with:
- Aligned billing datasets
- Clean view of resources by account/project
- Shared categories for compute, storage, and network
Read also: CMDB CI Explained - Know Your Configuration Items or Risk It All
Step 2. Allocate spend to apps, teams, and environments (tags, CMDB, accounts)
Once the numbers make sense, the next hurdle is ownership. Everything instantly falls apart when nobody knows who owns what. Allocation fixes that by linking spend to real services and real teams.
Teams use a mix of:
- Tags and labels
- Account or project structure
- CMDB relationships
This is what turns “this EC2 instance is expensive” into “the payments service scaled out — let’s see why.”
Ownership gives you:
- People who can actually take action
- Accurate showback/chargeback
- Realistic commitment planning
Read also: 7 Cloud Cost Allocation Strategies from FinOps Experts
Step 3. Identify cloud waste and optimization opportunities
Now comes the detective work. Once ownership and visibility are in place, patterns start appearing. Waste usually hides in plain sight.
Things people typically discover:
- Idle instances or storage nobody remembers
- Oversized clusters or databases
- Workloads on the wrong pricing model
- Weird data transfer flows
- Forgotten resources from old deployments
This step reveals why the bill looks the way it does. You’ll also find repeat offenders — the same problem showing up every month because nobody owned it before.
Read also: How Does Asset Management Work Across Hybrid IT?
Step 4. Implement changes: engineering work, automation, commitments
This is where the hands-on work begins. It’s the part of the cycle where you adjust infrastructure so it costs less without hurting performance. It’s not finance work — it’s engineering, SRE, and platform engineering territory.
Typical changes include:
- Resizing compute or storage
- Deleting unused load balancers, volumes, or IPs
- Tuning autoscaling rules
- Adding lifecycle policies
- Shifting workloads to Spot or committing to RIs/Plans/CUDs
Read also: What Is Rightsizing in Cloud Cost Optimization? Pro Insights
Step 5. Operate & iterate: KPIs, reviews, governance
Optimization sticks only if it becomes routine. Mature teams keep the loop alive by reviewing key metrics and watching for drift.
Practical KPIs teams actually watch:
- How much is still unallocated or “unknown”
- RI / Savings Plan / CUD usage and how often they’re hitting the limits
- Cost changes per service or per workload over time
- How far actuals drift from the forecast
The goal isn’t heavy governance — it’s preventing surprises and keeping cloud operations predictable.
Read also: 27 FinOps KPIs to Get the Most from Your Cloud Spend
Cloud spending and performance optimization: Finding the balance
Teams eventually learn that cost and performance can’t be pulled apart. If you trim too much, latency jumps and SLOs start slipping. If everything runs oversized “just to be safe,” the bill grows for no reason.
The real job is finding the point where a service stays fast without paying for capacity it never uses.
Cost vs Performance: What engineers and FinOps actually look at
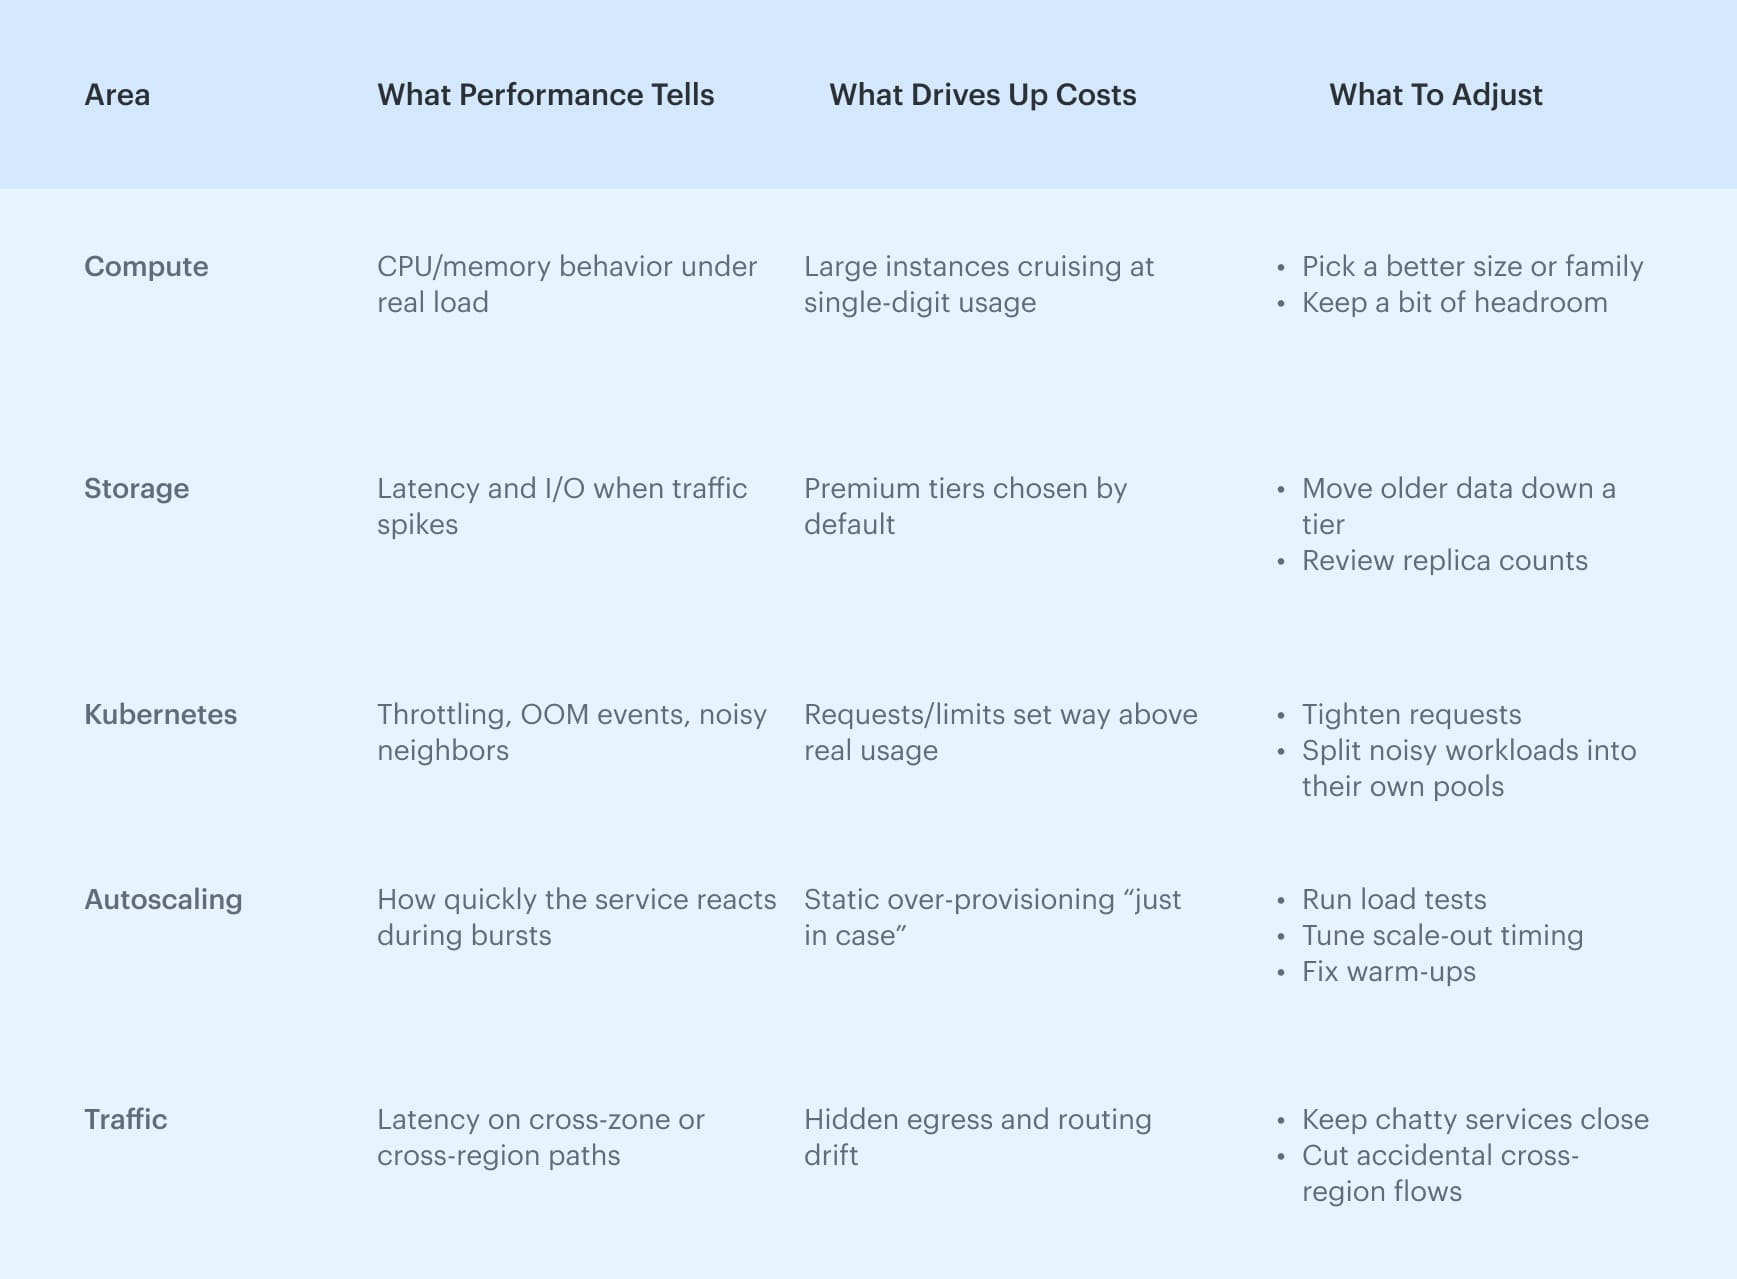
Why it matters?
Most wasted spend has nothing to do with finance — it comes from sizing choices made long ago, forgotten storage, or routing patterns nobody revisits.
When performance signals sit next to cost data, the picture finally makes sense: you see what’s safe to shrink, what must stay as is, and where architecture pushes the bill up for no good reason.
Read also: 13 Cloud Cost Optimization Best Practices to Use in 2026
Core cost visibility strategies (Compute, storage, data transfer)
Most cloud costs come from compute, storage, and data transfer. These are also the places where cost optimization brings the fastest and most predictable gains.
Below are the strategies FinOps and engineering teams rely on day-to-day to keep bills predictable and under control.
| Area | Strategy | When Works Best | Signals You Need It |
|---|---|---|---|
| Compute | Rightsizing, commitments, Spot | Steady workloads, predictable usage | CPU p95 < 40%, memory < 50% |
| Storage | Tiering, lifecycle, cleanup | Logs, snapshots, infrequent access | Rapid growth with no traffic increase |
| Backups | Retention tuning, pruning | Environments with long retention histories | Backups > 30 days, cross-region copies |
| Kubernetes | Requests/limits tuning, node pools, autoscaling | Workloads with uneven or bursty usage | Requests 2–5× higher than usage |
| Serverless | Memory tuning, concurrency | Bursty workloads | High cost per 100ms or GB-second |
Compute: Rightsizing & infrastructure optimization
Most cost wins still come from compute. Teams revisit instance families, resize based on p95 usage, move predictable workloads to RIs/SPs/CUDs, and push batch/ML/CI to Spot.
This strategy works because compute waste shows up fast and scales with fleet size.
Read also: 10 Cloud Cost Optimization Strategies From FinOps Experts
Cloud cost storage optimization
Storage grows slowly and silently, so the best strategies are lifecycle rules, tiering, removing stale snapshots, and reviewing replicas. Most teams save 15–30% of storage cost by simply applying consistent rules.
Read also: 6 Ways to (not) Fail AWS Cloud Cost Optimization in 2026
Backup optimization
Backup cost spikes come from forgotten retention and cross-region copies. A simple weekly hygiene routine (delete stale snapshots, trim non-prod retention) handles 80% of the waste.
Read also: 12 Multi Cloud Management Platforms: Software Features & Pricing Review
Cloud orchestration cost optimization
Kubernetes waste comes from inflated requests/limits; serverless waste comes from mismatched memory/concurrency.
Quick wins: tune requests, isolate noisy workloads, scale non-prod to zero, and refine autoscaling with load tests.
Read also: 9 Cloud Cost Management Strategies for 2026
Multi-cloud and public cloud cost optimization
Multi-cloud often sounds strategic, but day-to-day, it creates one big problem: three different versions of reality.
Public cloud cost optimization gets even harder in this setup because pricing logic, network rules, and egress behavior change by provider. A design that’s cost-efficient in AWS can be expensive in Azure, and vice versa.
This section breaks down how to make multi-cloud and public cloud environments predictable instead of chaotic — and how to keep cloud spend from drifting into cloud sprawl.
Challenges of multi-cloud visibility, pricing & duplication
| Challenge | Why It Drives Up Cost | What It Looks Like in Real Life |
|---|---|---|
| Different billing formats | No unified view, bad decisions | AWS CUR vs Azure exports vs GCP Billing mismatch |
| Pricing mismatch | Same workload, 3 cost profiles | CPU-hour vs vCPU-second vs per-request pricing |
| Duplicate services | Infra repeated per cloud | 2-3 NATs / LBs doing the same job |
| Cross-cloud egress | Hidden until invoice | Traffic bouncing regions/providers |
| Inconsistent tagging | Ownership gaps | 10-30% “unknown” spend |
| Shared services w/o owners | Costs disappear into “other” | NAT/LB/logging bill unassigned |
Read also: 7 Cloud Cost Management Challenges and How to Fix Them
How to normalize cost data across AWS, Azure, and GCP
To do multi-cloud cost optimization, teams first make all three clouds speak the same language:
- Map AWS/Azure/GCP services into shared categories;
- Unify units (GB-month, vCPU-hour, request-based pricing);
- Normalize discounts (RIs/SPs/CUDs);
- Merge tags + labels with CMDB ownership;
- Align regions and currency.
With normalized data, patterns finally make sense instead of contradicting each other.
Read also: 10 Battle-Tested FinOps Best Practices from the Pros
Real FinOps example of shared services allocation
A common issue: AWS NAT moves traffic for multiple teams, Azure uses its own NAT for similar workloads, and GCP analytics pulls data from both. The NAT bill skyrockets, no one claims it, and the “unknown” category grows.
FinOps fix: Allocate NAT/LB/logging by usage (GB, requests), attach owners via CMDB, and review cross-cloud flows monthly. Once someone owns the cost, the waste stops.
Read also: FinOps Automation That Works: Tips & Tools from Pros
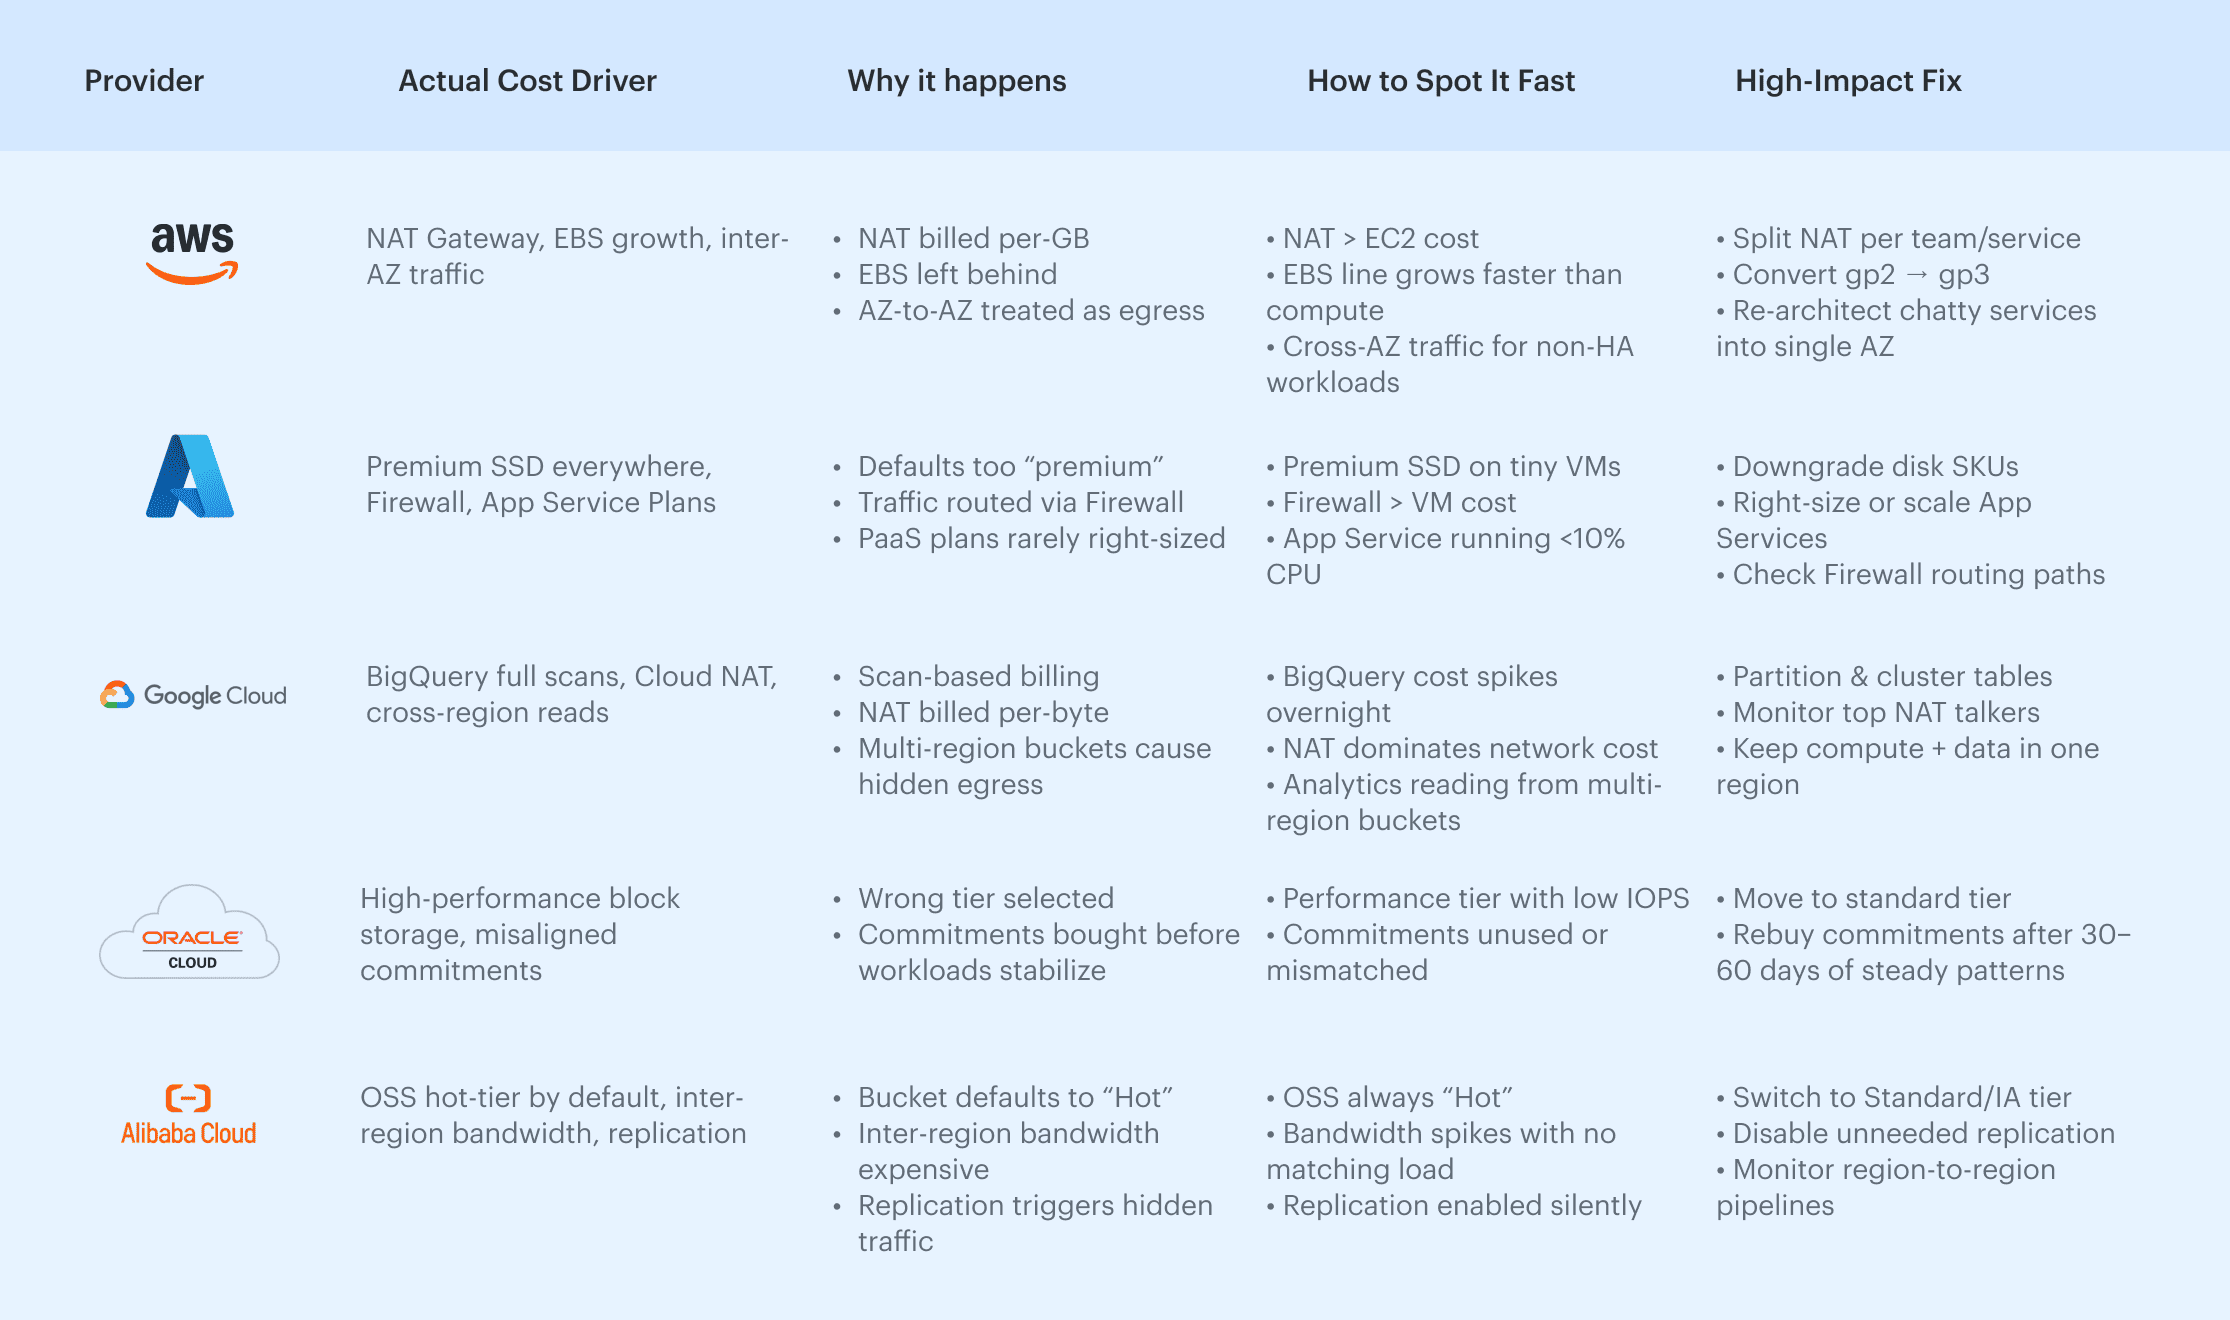
Provider-specific cloud cost optimization (AWS, Azure, GCP, Oracle, Alibaba)
Provider-specific tuning is where public cloud cost optimization turns into real savings. Each cloud prices the same resources and workloads differently, so the first step is understanding where money typically leaks.
Below — the type of information FinOps engineers usually search for but rarely find in one place.
Where each cloud provider usually loses money (And why)
All insights are based on official AWS, Azure, GCP, Oracle, and Alibaba documentation, combined with common FinOps community findings and real-world cost patterns reported in provider pricing pages, architecture guides, and cost management best-practice materials.
One high-impact fix per cloud (Fast wins for any environment)
If you only have time for one action per provider, these give the biggest impact with the least effort.
AWS
A lot of unexpected AWS spend comes from traffic hopping between Availability Zones. One misplaced route or a load balancer pointing the wrong way is all it takes.
Quick win: find workloads that don’t need multi-AZ and keep their traffic inside a single zone. The drop in cost is usually immediate. Learn more about AWS cloud cost management in this guide.
Azure
In Azure, the biggest waste often comes from disk choices no one revisits. Premium SSDs show up everywhere, even on small workloads that don’t benefit from them at all.
Quick win: review disk SKUs and downshift anything that isn’t pushing real IOPS. It’s one of the fastest fixes in the platform. Learn more about Azure cloud cost optimization in the article.
Google Cloud
BigQuery can blow up a budget overnight if tables aren’t structured properly. Full-table scans are the usual culprit, and they’re easy to miss.
Quick win: add partitioning and clustering to large tables. It reduces scanned data immediately and stabilizes bills for analytics teams.
Oracle Cloud
Overspending in OCI often comes from block volumes sitting in performance tiers they don’t need. Teams size them “just in case” and never look back.
Quick win: move any low-IOPS workloads to a lower tier. The savings add up fast without touching the application.
Alibaba Cloud
OSS defaults to the Hot tier, even when the data is rarely accessed. Replication can also create silent inter-region traffic that nobody notices.
Quick win: switch unused or rarely accessed buckets to Standard/IA and disable replication where it isn’t needed. It stops the silent egress problem cold.
AI for cloud cost optimization
AI is changing how teams approach cloud cost management and optimization, but not in the “press a button → save 40%” way.
The real value of AI in cloud waste optimization is in pattern detection, drift analysis, anomaly detection, and automating work that humans are too slow (or too busy) to do consistently.
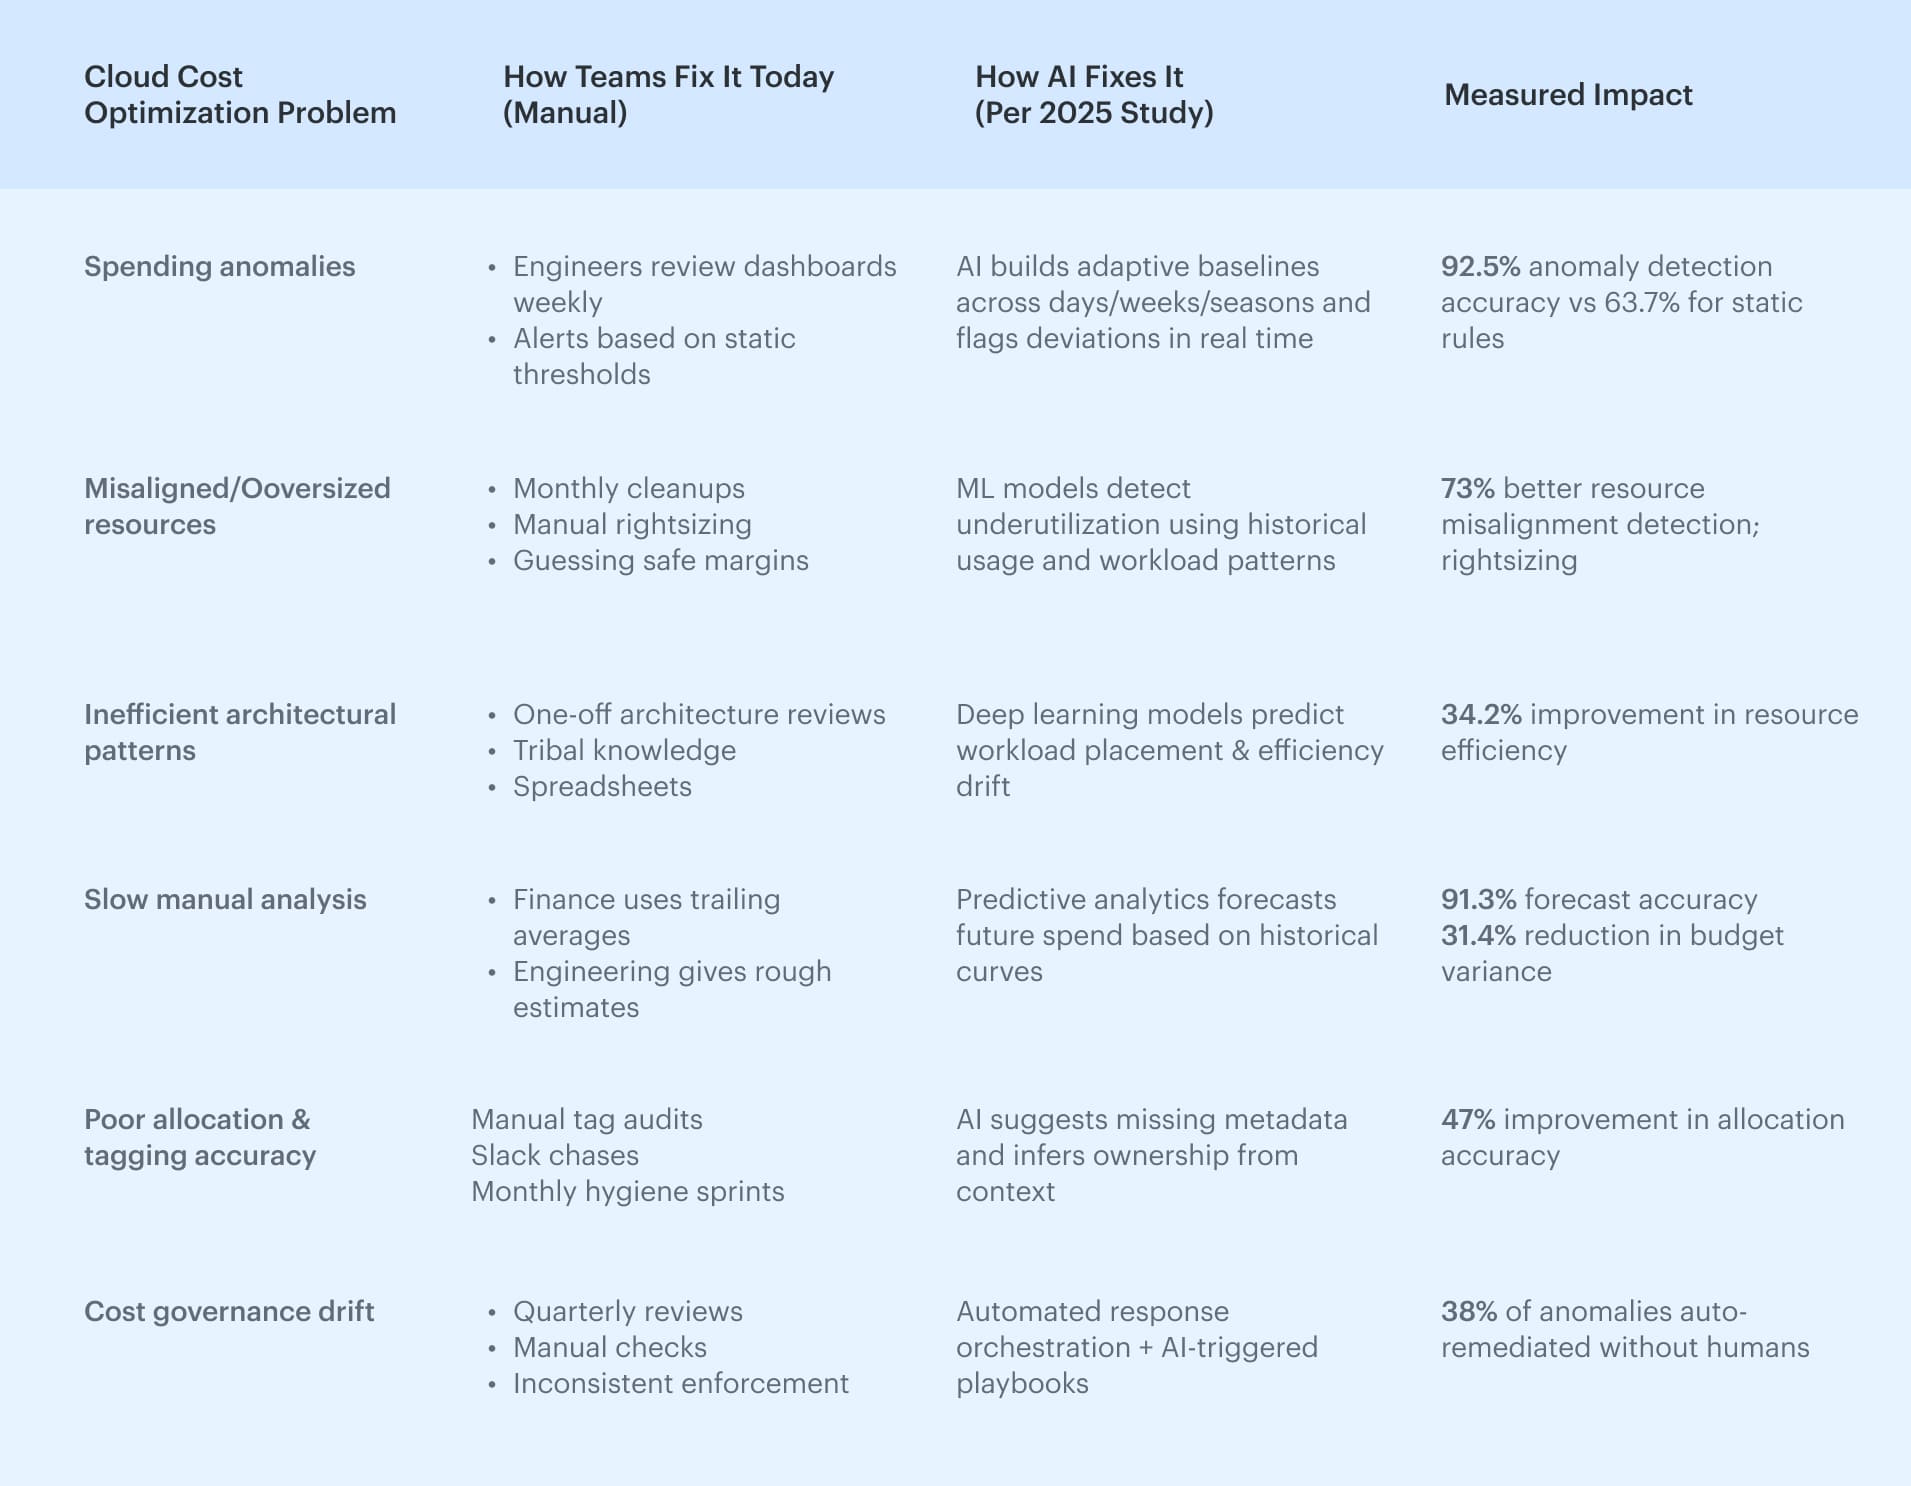
How problems are fixed today vs How AI fixes them
In 2025, the AI-Enabled FinOps study analyzed how AI changes day-to-day cloud governance across 250+ enterprises and compared manual workflows with AI-driven ones.
The findings were surprisingly practical: AI doesn’t replace FinOps, but it dramatically improves detection accuracy, reduces analysis time, and increases the adoption rate of optimization recommendations.
To make the results easier to apply, we broke down the study’s insights into a simple table:
AI tools for cloud cost optimization
Most teams exploring AI cloud cost optimization start with what cloud providers already offer out of the box. AWS, Azure, and GCP now include built-in AI and ML features that assist with rightsizing, anomaly detection, storage tiering, and usage pattern analysis.
Below is a practical overview of the AI-powered cost optimization features available in each major cloud — and the types of problems they’re designed to help with.
AWS AI/ML tools for cloud cost optimization
- AWS Compute Optimizer: Reads several weeks of CPU, memory, and network behavior and suggests smaller instance families or different shapes. Good at spotting machines that were sized once and never revisited.
- AWS Cost Anomaly Detection: Keeps track of how your spend usually behaves and flags anything that drifts: NAT climbing slowly, cross-AZ traffic shifting, snapshots piling up, small idle fleets that add up.
- AWS S3 Intelligent-Tiering: Moves objects between S3 tiers automatically, purely based on access. Works quietly in the background and trims storage cost without touching the application.
Where AWS’s AI helps most? Rightsizing, storage lifecycle, catching cross-AZ inefficiencies, slow-moving drift.
Azure AI-assisted cost optimization tools
- Azure Advisor: Points out oversized VMs, unused IPs, idle disks, and odd network setups. Not always perfect, but it catches the obvious waste regularly.
- Azure Cost Management + Anomaly Detection: Spots unusual jumps in spend on a subscription or resource-group level. Helpful when one misconfigured service suddenly burns money.
- Predictive Autoscaling: Learns from how workloads behave and adjusts scaling more carefully, so you don’t pay for inflated headroom.
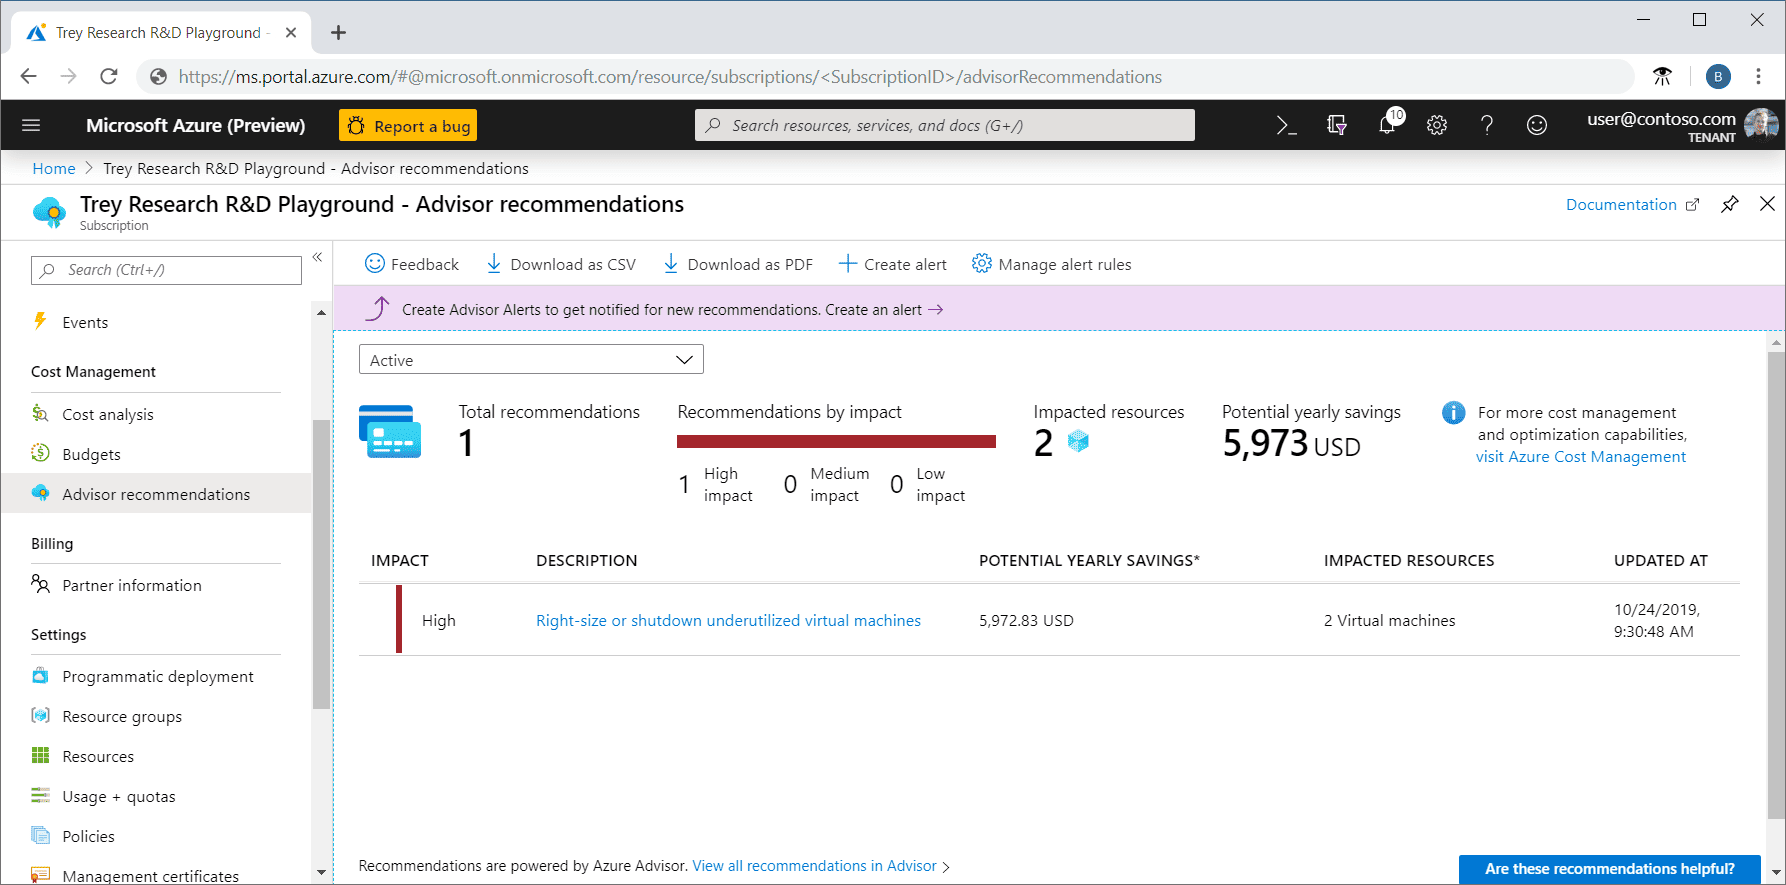
Where Azure’s AI helps most? Disk oversizing, network drift, oversized PaaS plans.
Google Cloud AI tools for cloud cost optimization
- Recommender Engine: Flags VMs that could be smaller, unused disks/IPs/snapshots, and other forgotten items. It’s one of the more accurate native tools across cloud providers.
- BigQuery scan/slot suggestions: Looks at query patterns and calls out full-table scans or slot usage that doesn’t match the job. Saves a lot of money in data teams.
- Anomaly detection (Cloud Monitoring): Catches odd usage patterns, traffic spikes, and cost jumps across services.
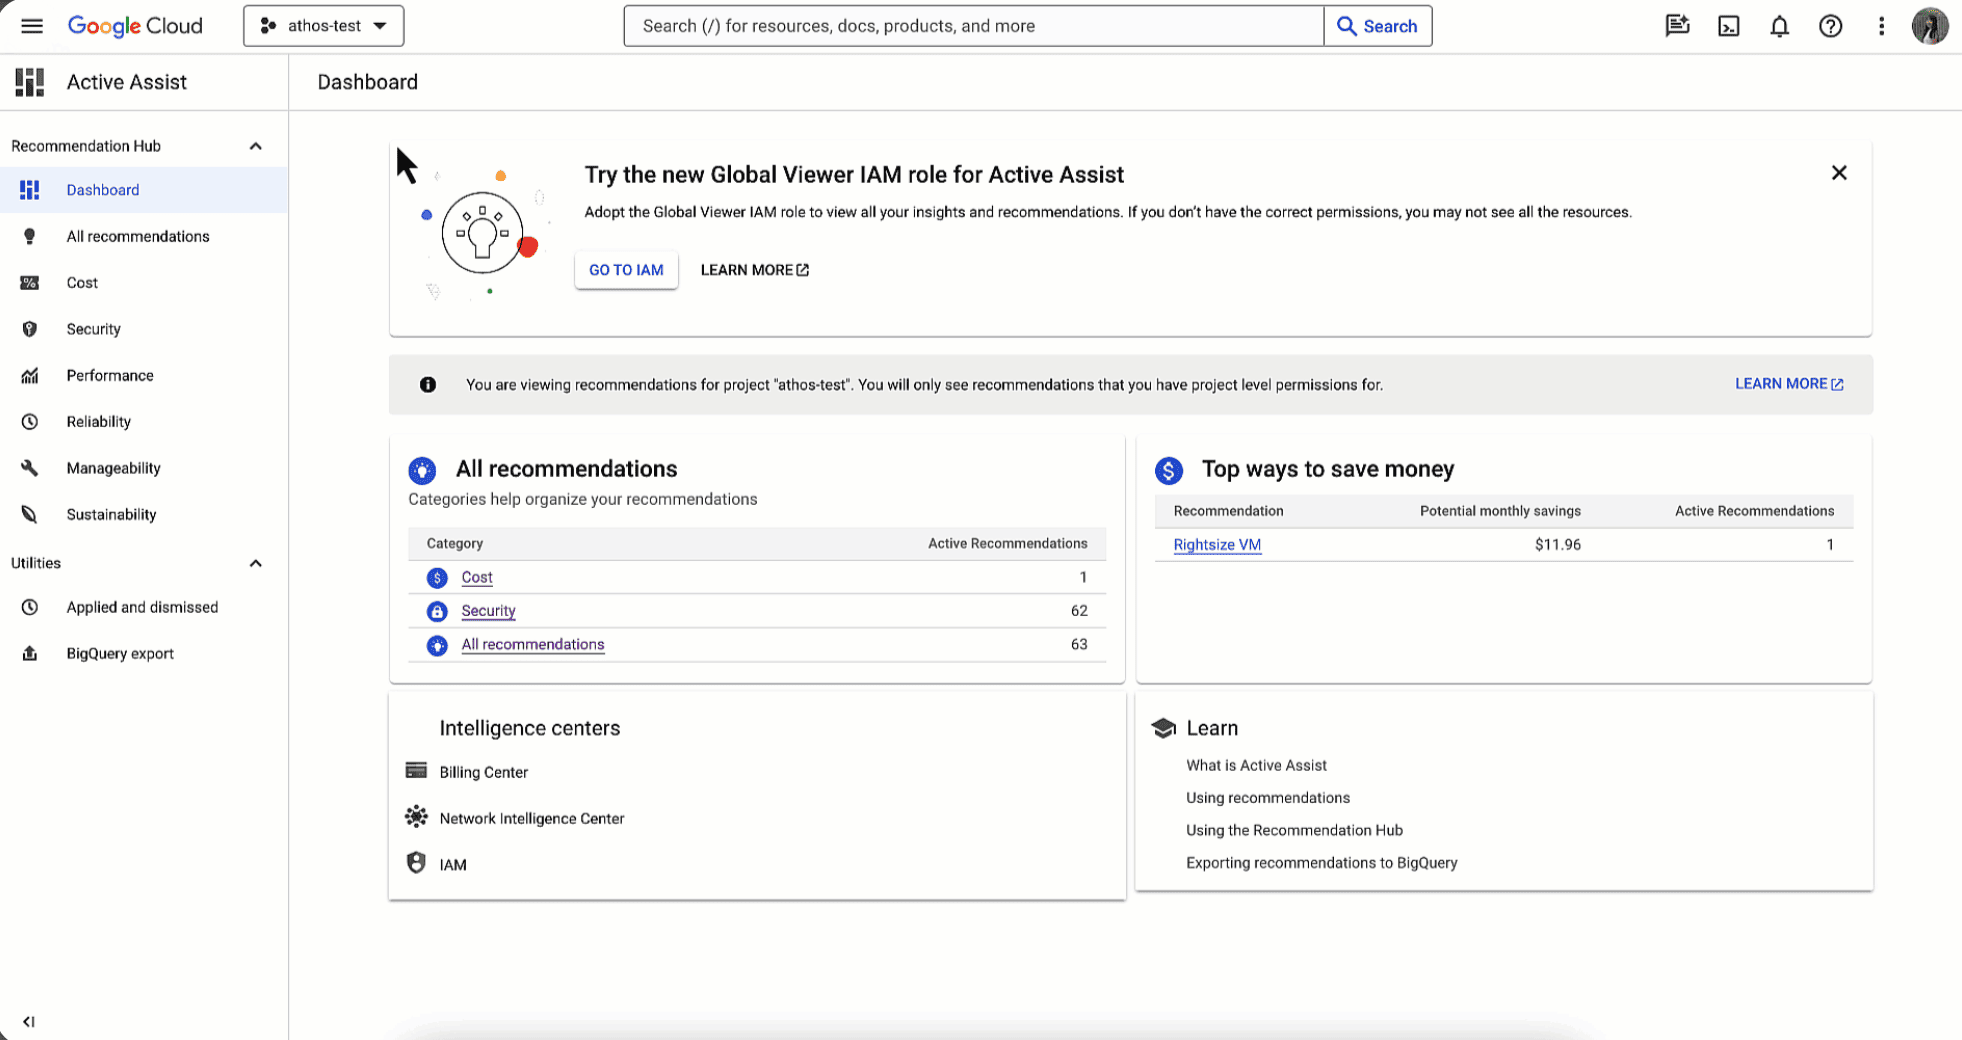
Where GCP’s AI helps most? BigQuery (by far the most common money sink), Cloud NAT drift, uneven analytics/batch workloads.
Read also: 12 Cloud Cost Management Tools: Software Features & Price
Cloud cost optimization case study
Boeing operates a large multi-cloud estate across AWS, Azure, and GCP, and a significant share of its cloud spend recently shifted into AI services — Azure OpenAI, AWS Bedrock, and SageMaker.
The FinOps team saw the top-line bill, but they couldn’t tell which models, token types, or accounts were driving spikes. Storage waste was hard to track, and RI/SP coverage sat in separate consoles, making cross-cloud decisions slow and reactive.
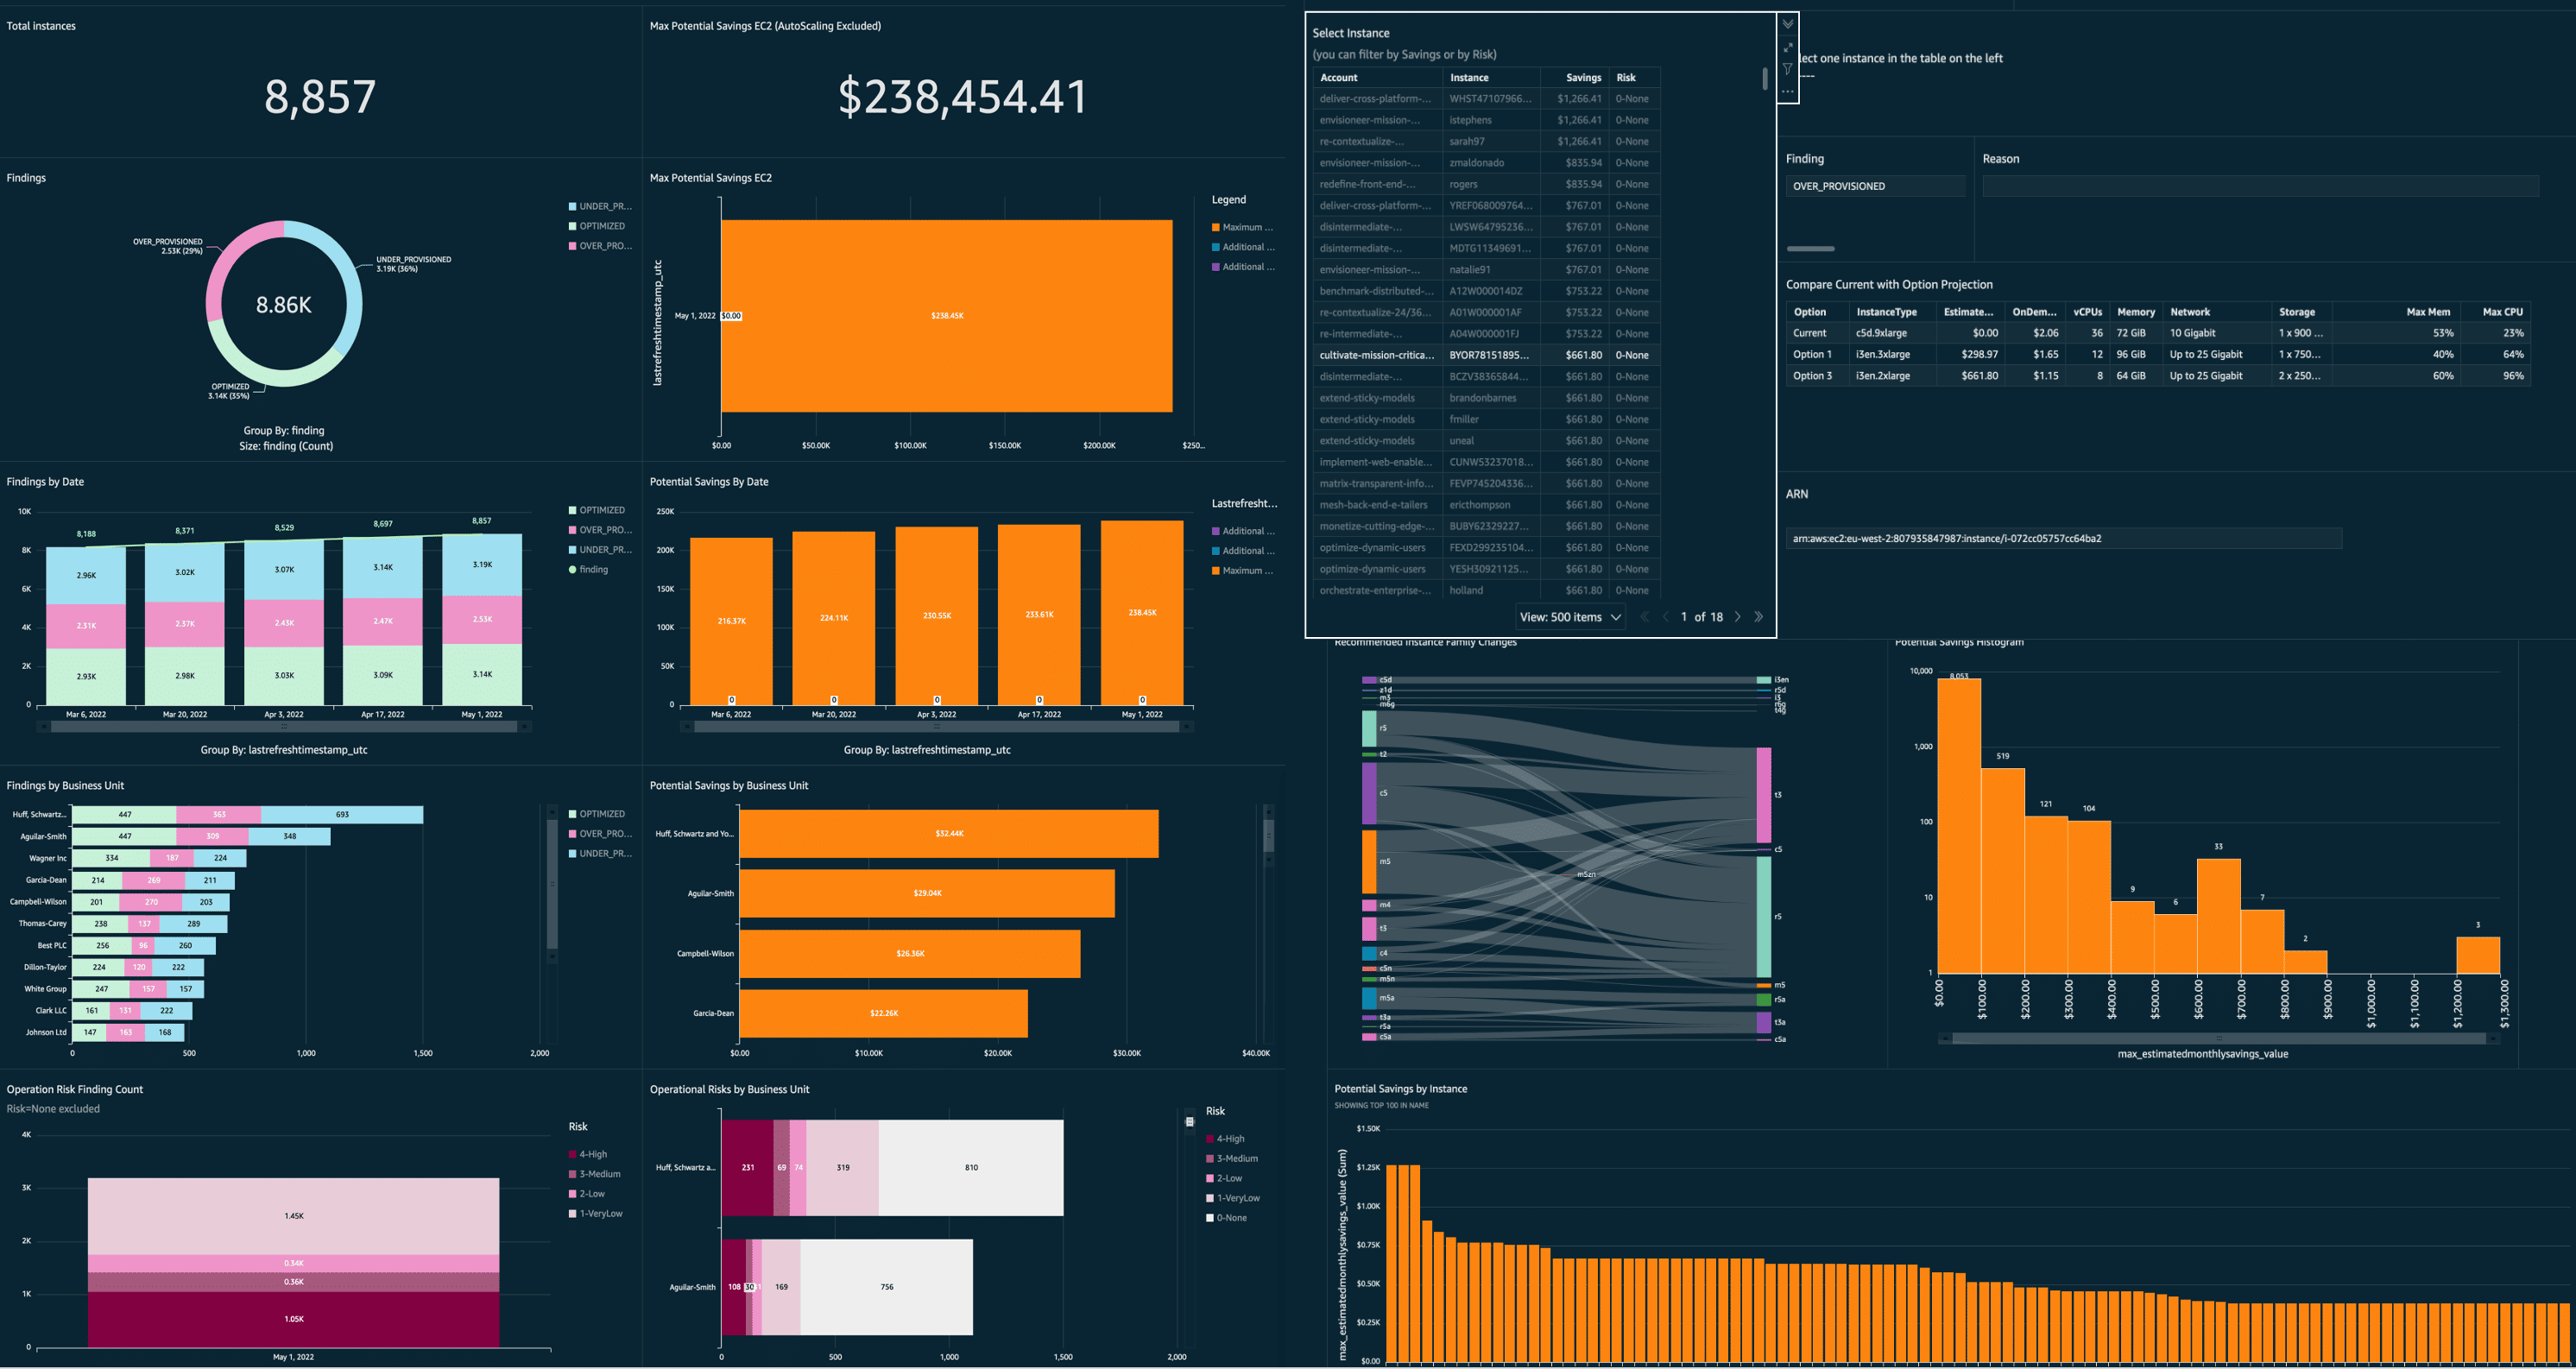
What Cloudaware surfaced:
Once Cloudaware joined the billing and usage data with CMDB resource relationships, Boeing finally had one place where everything lined up. The platform revealed:
- Azure OpenAI cost by model and token type,
- Bedrock and SageMaker usage patterns,
- idle and orphaned storage buckets,
- RI/Savings Plan gaps where commitments didn’t match real workloads.
Individually, each insight was small. Together, they created the visibility Boeing needed to start real cloud cost optimization.
Outcome:
By cleaning up unused storage, right-sizing compute, improving commitment alignment, and controlling fast-growing AI workloads, Boeing achieved $958,250 in annual cost savings in about 90 days.
Additionally, they gained 100% visibility into AWS Bedrock, AWS SageMaker, and Azure OpenAI token usage and cost, with clear input/output breakdowns.
This case study shows how unified visibility and ownership context turn scattered data into measurable cost savings, especially when AI-driven cloud spend is accelerating.