


If you're a FinOps manager, DevOps lead, or cloud architect staring down spiraling AWS, Azure, or GCP bills — this is for you. If you own budgets, RI/SP strategy, or the roadmap, a cloud cost optimization assessment is your first lever.
84% of organizations still struggle to manage cloud spend — so the gap is real.
This guide walks you through how to assess cloud cost management inside Cloudaware — no third-party consultants, no fluff. Just your data, your estate, your team.
The playbook here? It's built from the trenches — Cloudaware ITAM leads with 10+ years in the game, real companies using our platform, and wisdom from webinars of folks like Joe Daly (FinOps Foundation), and the 2025 FinOps Framework.
You’ll walk away knowing:
- When to run a cost assessment (and what triggers to watch).
- What data to pull (billing exports, tags, CUR, labels).
- How to link cost to apps, teams, environments using CMDB logic.
- How to benchmark things like idle rates, tag coverage, RI/SP utilization.
- What a good commitment strategy looks like with coverage vs utilization.
- Where shared costs (egress, NAT, control plane) should land.
But first — let’s make sure we’re aligned on what this is and what it isn’t. Here’s what a cloud cost optimization assessment actually means 👇
What is a cloud cost optimization assessment?
A cloud cost optimization assessment is a structured review of how efficiently your cloud spend supports your workloads — and how much you could save without breaking anything. It's the moment you step back from chasing anomalies and rightsizing EC2s ad hoc to look at your entire architecture, billing data, and tagging standards through one lens: business value per dollar spent.
In practice, this isn’t a re-architecture exercise. You won’t be redesigning apps or migrating databases this week. You're surfacing inefficiencies — unused resources, overprovisioned clusters, outdated commitments — and lining up actions your team can actually take this sprint or next.
Think “quick wins + prioritized backlog,” not “18-month transformation roadmap.”
What’s actually in scope
You’ll zoom in on your most impactful layers: linked AWS accounts, Azure subscriptions, GCP projects, and any production-grade Kubernetes clusters. That’s the actionable tier where 80% of your cloud cost hides. You’ll skip deep architectural audits this round — no app refactoring or multiyear modernization plans.
This cloud cost assessment is about what your team can control in the next sprint, not in the next board meeting.
That means surfacing:
- Cross-cloud redundancies (e.g. dual backups in S3 + Azure Blob).
- Orphaned resources (think idle EBS volumes, zombie load balancers).
- Commitment gaps (RIs expiring with no renewal plan).
- Tagging anomalies (like “env:prod” applied to a dev sandbox).
And that’s just the opening scene.
What “done” looks like
You’re not doing all this just to feel better about your cloud bill. You're doing it to walk into your next MBR or engineering sync and say: here's where we’re bleeding spend, here’s who’s fixing it, and here’s how we’ll track progress.
So what does “done” actually mean?
- You’ve got a prioritized list of savings opportunities. Each one has a € or $ amount, tied to a specific cloud service, region, and usage pattern.
- Every opportunity has a named owner — real humans, not “Team XYZ” — with a committed SLA.
- You’ve captured edge cases: business-critical workloads running hot by design, or shared resources that look idle but aren’t.
- All of that rolls into a remediation checklist with statuses, blockers, and timestamps. Think: something you can review weekly, update in sprint demos, or escalate in QBRs.
And governance? This isn’t a one-off slide deck. Done right, your cloud cost insights should automatically loop into:
- Tagging policies (“missing
env__cblocks allocation”). - Anomaly alerts (“K8s CPU spend jumped 18% overnight”).
- CI/CD pre-deploy gates (“blocked: provisioning untagged storage in
prod”). - Commitment strategy (“SP purchase delayed due to missing utilization proof”).
That’s how a strong cloud cost optimization assessment turns from a spreadsheet into an operating rhythm. Into signals that power real decisions — budget rollups, roadmap tradeoffs, policy enforcement.
That’s the big picture. But timing matters too 👇
When to run a cloud cost assessment?
When cloud spend jumps, tagging drops, or Finance asks, “Why is storage suddenly our #3 line item?” — it’s time.
But if you're only reacting, you're always behind.
To assess cloud cost management proactively, high-performing FinOps teams run structured assessments on a set cadence — with tactical reviews triggered by specific events. That’s how you stay ahead of waste, align spend with actual usage, and tie savings directly to budget cycles.
5 Triggers you can’t afford to ignore
You don’t need to look far for signals. They’re already in your dashboards and Slack threads:
- A sudden cloud spend spike >15% MoM that wasn’t tied to a release.
- A new Kubernetes cluster dropped into staging with zero autoscaling rules.
- Tag coverage drops below 85% across a key business unit.
- A new business unit joins the org and spins up 6 new Azure subs.
- You’re approaching pre-budget season and Finance is asking for “one number per app”.
These are your cues. And they’re more common than you think — especially in orgs where platform and engineering teams are shipping fast and cost visibility is reactive.
Cadence that fits the business
Here’s what works across our clients running 10+ accounts per cloud: a quarterly light review and an annual deep dive.
- Quarterlies give you momentum. They're perfect for surfacing low-effort cleanups — idle resources, expired dev environments, underutilized savings plans. Just enough to keep your cloud cost posture aligned with growth.
- Then once a year — ideally 1–2 months before budget season — you go deep. That means full tag audits, commitment portfolio reviews, usage vs allocation breakdowns, and cost forecasting by app, team, and environment.
This annual cycle lets you align to fiscal goals, rebalance cost optimization priorities, and lock in savings before renewals hit.
And because this feeds platform roadmaps, it's the perfect bridge between engineering plans and FinOps management.
How to assess your cloud cost management
Ready to dive into your own cloud cost optimization assessment — no consultants, no extra headcount? This section shows you how to run the entire assessment yourself using Cloudaware.
We’ve built this step-by-step guide with help from Kristina, Senior ITAM Expert at Cloudaware, and Mikhail Malamud, a 10-year FinOps and ITAM veteran. Together, they’ve helped enterprise teams cut cloud spend across thousands of workloads, from underutilized instances to misaligned services — across AWS, Azure, and GCP.
You’ll learn how to collect the right data, connect it to your CMDB, and surface the biggest costs hiding in plain sight.
Let’s break it down.
Data to gather
Before you can act on anything, you need the data that shows what’s really happening — across providers, environments, and teams.
The good news? If you're using Cloudaware, you already have most of it. No CSV wrangling. No BigQuery stitching.
Here’s the core dataset that powers any cloud cost optimization assessment:
- Billing exports — pulled automatically from AWS (CUR), Azure (Cost Management), and GCP (BigQuery). Hourly-level granularity, blended/unblended rates, and daily updates let you trace spend patterns over time.
- Kubernetes metadata — labels, namespaces, usage metrics. Especially useful when multiple teams share clusters and cost attribution gets blurry.
- Tagging structure — required keys, blocked values, and actual tag coverage. You’ll want a baseline before surfacing gaps.
- Org and account structure — accounts, subscriptions, folders, OUs. Helps line up financial boundaries with actual team structure.
- Ownership and responsibility mapping — to avoid “no one owns that bucket” conversations when idle resources show up.
Cloudaware collects and connects these sources automatically — but knowing what’s in play helps you trust what you’re seeing.
And when all this is in place? You’re ready for the real magic 👇
Read also 👉 Cloud Cost Optimization Framework - 11 Steps to reduce spend
Normalize with CMDB
Now that the raw data’s in — billing exports, tags, labels, org structure — the next step is to make it usable. That means normalizing it. And for that, CMDB isn’t just helpful. It’s essential.
In a real-world cloud cost assessment, you don’t want a list of EC2 IDs or SKU charges — you want to know which application, team, and environment each line belongs to. Because that’s what drives accountability. That’s what lets you align spend to business priorities. And that’s what enables actual cost optimization, not just analysis.
Here’s how it works in practice with Cloudaware:
- Each incoming cost line — whether from CUR, Azure exports, or BigQuery — is automatically mapped to configuration items in the CMDB.
- Those CIs carry structured metadata: app name, business unit, environment (dev/stage/prod), owner email, project tag, cost center, compliance scope — you name it.
- That mapping lets you build normalized views like “Top 10 apps by unallocated spend” or “idle resources in non-production environments over $500/month.”
- It also helps isolate shared services (like NAT gateways, monitoring stacks, CI/CD pipelines) so you can plan how to allocate them later.
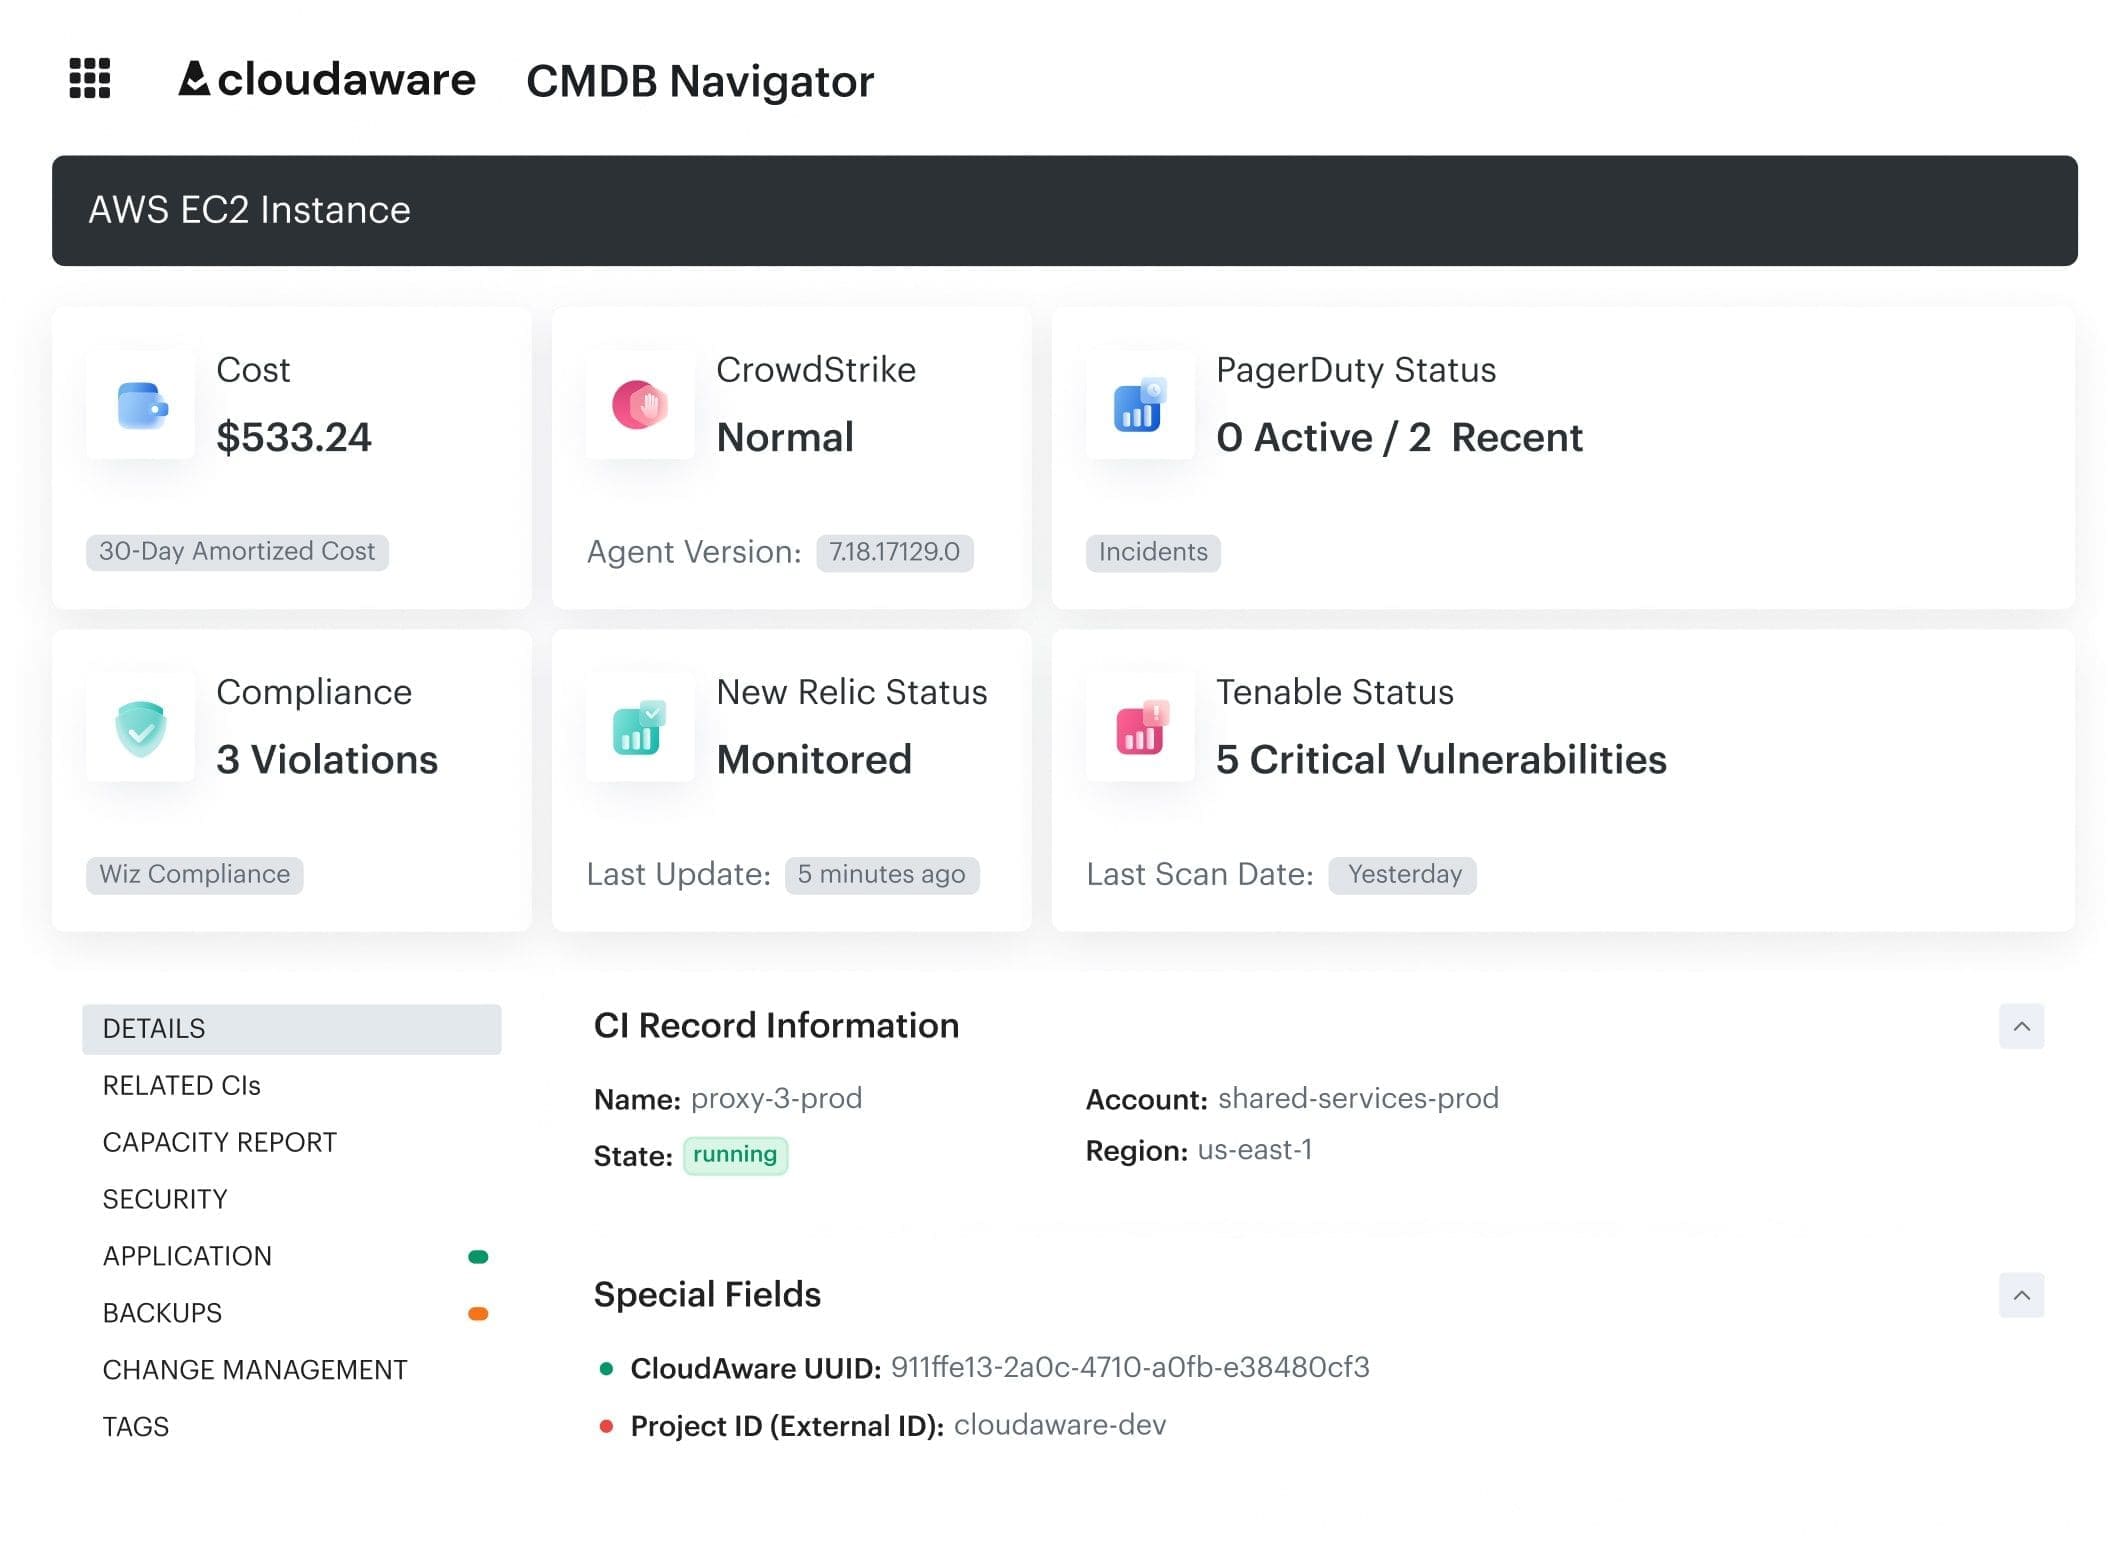
Cloudaware FinOps dashboard. Schedule a demo to see lit live.
Without this layer, you’re left doing detective work in spreadsheets. With it, you shift into real FinOps management — where each cloud service has a purpose, an owner, and a cost that fits its value.
This normalization is what makes optimization loops — like showback, anomaly routing, and commitment planning — actually work. It’s also where many teams hit bottlenecks if they don’t have a solid metadata model in place.
Now let’s build that metadata model from the ground up.
Read also 👉13 Cloud Cost Optimization Best Practices from Field Experts
Tagging baseline to enforce
Before you dive into spend patterns, idle resources, or commitment coverage, pause and ask: Can we even trust what we’re looking at? Because without consistent tagging, your cloud cost data is just a collection of line items with zero context.
That’s why setting a tagging baseline isn’t a “nice to have” — it’s step zero in any serious cloud cost optimization effort.
The goal here isn’t perfection. It’s enforceable consistency across keys that matter:
application__cenvironment__cowner_email__ccost_centerproject_name
In Cloudaware, you can set up tagging policies that check these automatically.
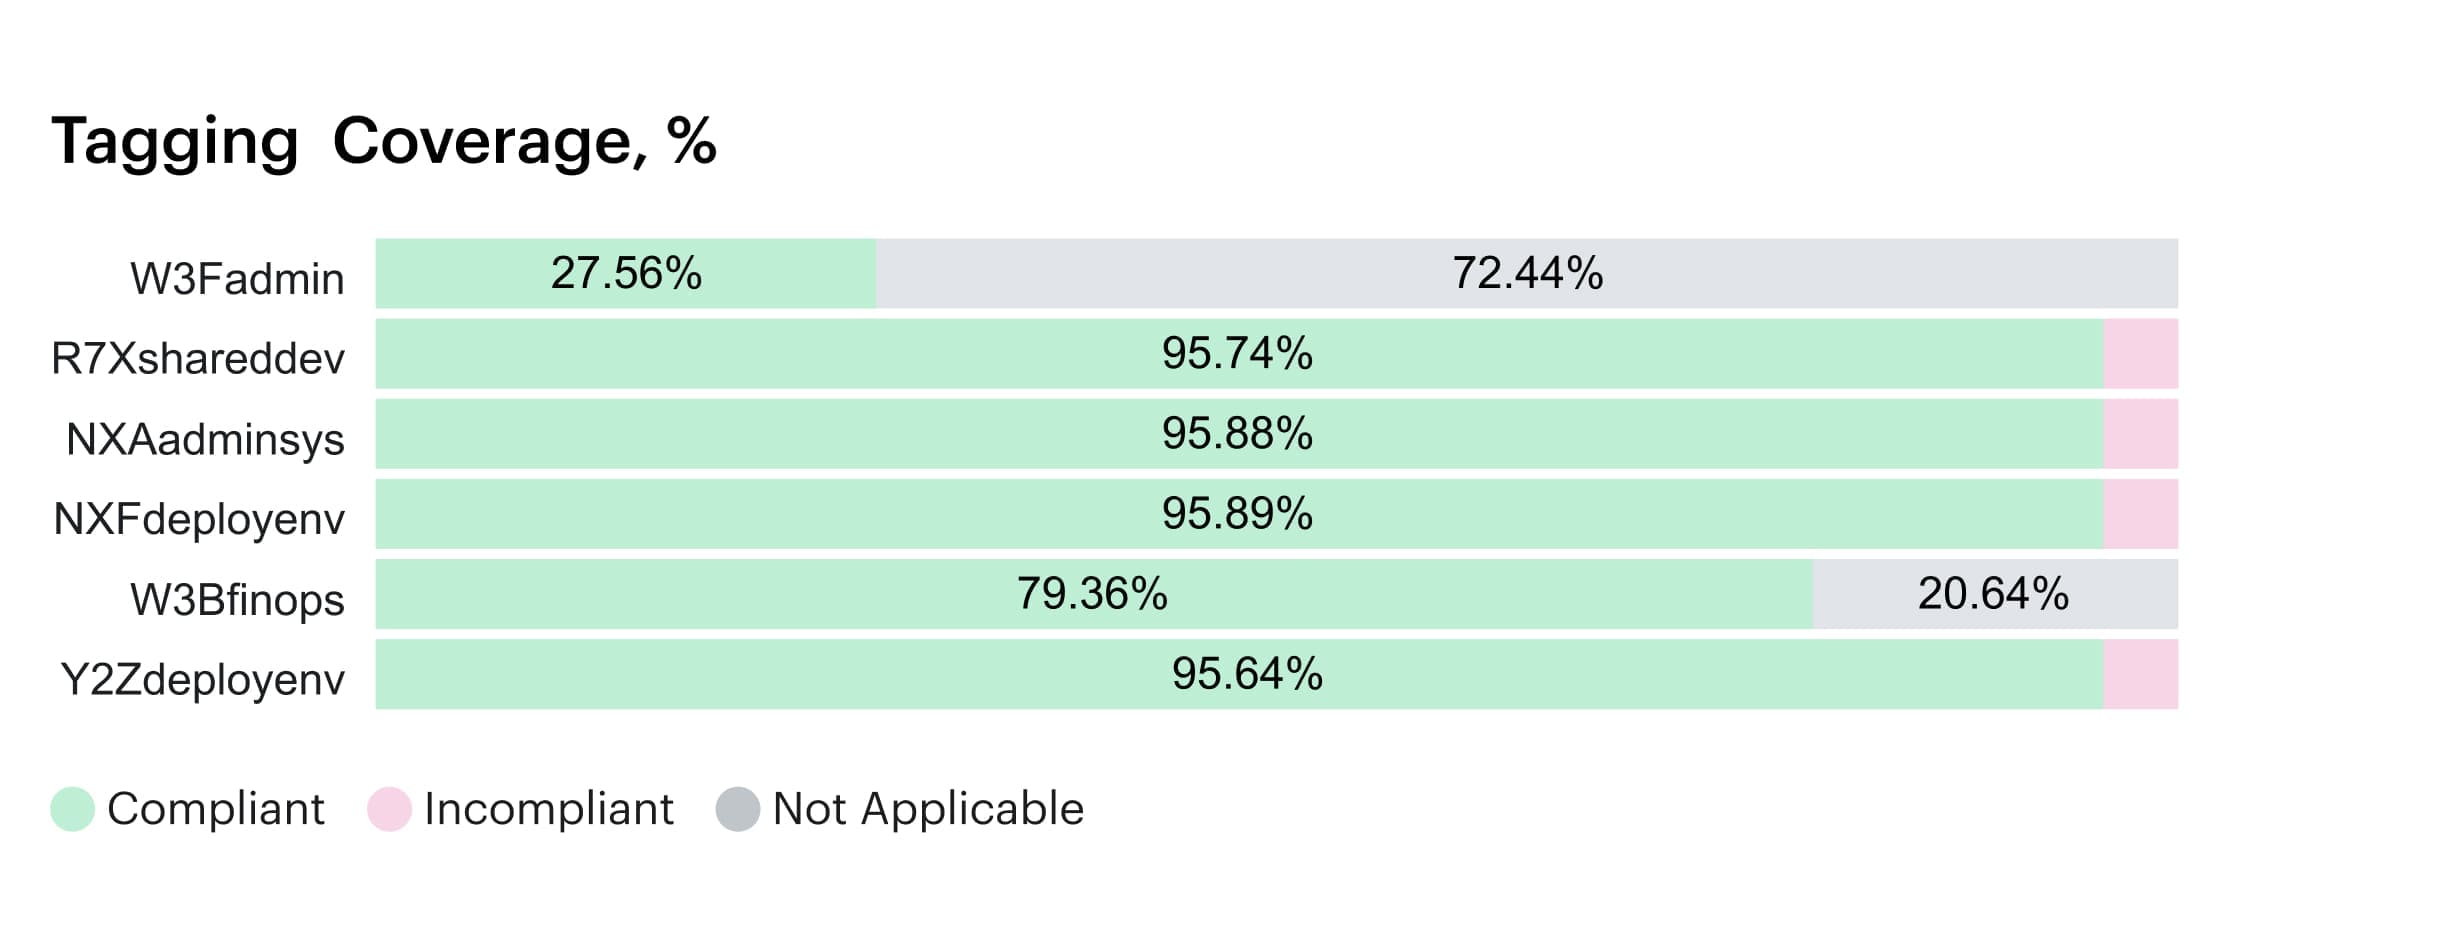
Tagging dashboard within Cloudaware. Any questions on how it works? Book a call.
They show where coverage falls short — by account, provider, or team — and track drift over time. More importantly, they surface the impact: how much spend is currently unallocatable because those tags are missing or misapplied.
Once you’ve got that view, you can prioritize:
- Which keys must be 100% enforced in prod?
- Which ones are critical for business alignment or chargeback?
- Where are you tolerating gaps that block actionable insights?
You’ll also want to scan for blocked or inconsistent tags — things like env:prod, Env=Production, and ENVIRONMENT=prd. That noise derails management visibility and screws up filters downstream.
Tag remediation isn’t just about getting pretty pie charts. It’s about enabling the rest of the assessment. Because every recommendation — whether it's to resize, reallocate, or re-architect — relies on tags being there to connect cost to purpose.
Once you’ve got your tagging baseline locked in?
Now we can get to the good part.
Step 1. Inventory and spend breakdown
Before you make cuts, you need clarity. Every effective assessment starts with a full inventory — of what you’re running, where it’s running, and what it’s costing you. No assumptions, no rollups. This is the part where you stare your cloud spend in the face.
Here’s how to break it down:
Start by slicing your data across five core dimensions:
- Cloud — AWS, Azure, Oracle, Alibaba, GCP.
- Account / subscription — map to ownership, budgets, chargeback.
- Service — EC2, S3, NAT Gateways, EKS, Cosmos DB, BigQuery, etc.
- Team — who owns the infra?
- Environment — prod, stage, dev, sandbox.
Within Cloudaware, these dimensions are already joined — billing data enriched with CMDB, tag, and org metadata. That lets you go beyond total costs and see patterns like:
- One team’s staging instances are consuming 3x more than prod.
- A single Azure subscription is driving 18% of monthly cloud spend.
- NAT Gateway traffic in just two VPCs is eating $12K/month.
- Data transfer services show up in multiple places, but no one’s owning the egress.
- Top 20 cost drivers — tagged, scoped, and ranked — account for over 50% of your bill.
This is where things stop being theoretical. It’s not just “costs are high” — it’s this workload, in this region, under this team, is costing more than expected.
And now you have receipts.
From here, you can flag optimization opportunities, prep for deeper analysis, and share findings with the right stakeholders before you touch anything.
Step 2. Rightsize compute (instances, containers, functions)
Once you’ve mapped where spend is concentrated, it’s time to go after the heavy hitters — compute. This is where most teams see their first big savings, especially when usage patterns don’t match provisioning.
And if your p95 CPU is floating under 20% while you’re paying for 2 vCPUs? That’s not resilience — that’s waste.
This step is about aligning what you run to what you actually need.
Start with your core metrics:
- p95 CPU and memory usage — pulled from Cloudaware’s monitoring integrations or linked telemetry.
- Requested vs. allocated limits — especially in Kubernetes clusters where over-provisioning is default behavior.
- Idle hours — how often are those instances doing nothing? Nights, weekends, dev cycles — track it.
- Burst vs. steady workloads — identify which services spike (like batch jobs) and which run flat (like APIs or queues).
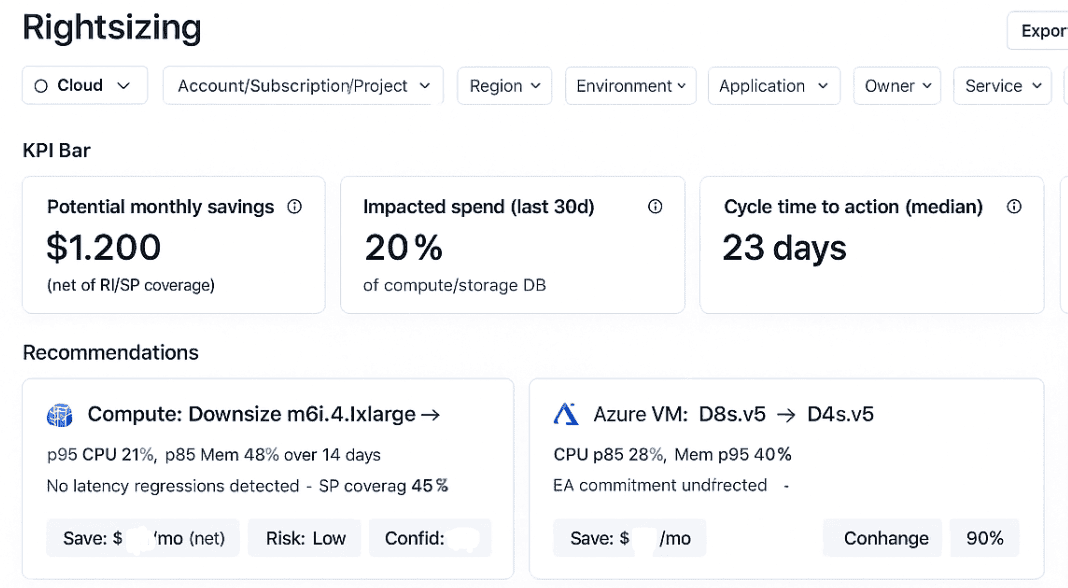
Element of the rightsizing report in Cloudaware. Schedule a demo to see it live.
Let’s say your containerized data pipeline requests 2 vCPUs and 4GiB RAM per pod, but p95 actuals show 0.6 vCPU and 1.2GiB. That’s 3x over. Multiply that by 20 pods across 3 clusters and you’ve got a serious cost efficiency gap — plus increased node pressure and potential scheduling delays.
The same logic applies to serverless functions. Cold starts aside, you’re still paying for execution time and memory. Review usage across regions and runtimes to catch over-allocated Lambda, Azure Functions, or Cloud Run deployments.
Cloudaware cloud cost optimization surfaces these patterns by mapping utilization data to CMDB-linked resources, which means you can see rightsizing potential at the app or team level — not just per node.
Loop in DevOps early here. Optimization can’t just live in FinOps. Rightsizing decisions have to align with SLOs, latency thresholds, and platform team SLAs.
Once compute fits the workload, you’ve cleared the biggest blocker to efficient cloud cost management.
Next: let’s clear out the clutter.
Read also: Cloud Cost Optimization Metrics: 18 KPIs FinOps Track
Step 3. Remove idle resources
After rightsizing active workloads, your next move is to sweep out everything idle, orphaned, or forgotten. Think of it as the junk drawer of your cloud estate: powered-off VMs still racking up storage fees, unattached EBS volumes, leftover Elastic IPs, orphaned snapshots, zombie test environments. These aren’t hypothetical. They’re on your bill — right now.
This part of the assessment isn’t just about spotting waste. It’s about automating what happens next.
Start with a few high-impact targets:
- Powered-off instances — even when shut down, they might still be attached to premium storage or Elastic IPs.
- Unattached volumes and disks — AWS, Azure, and GCP all continue charging for these unless explicitly deleted.
- Snapshots — useful for rollback, but often ungoverned. No TTL? They just sit there, silently inflating costs.
- Elastic IPs / public IPs — AWS charges for idle IPs (and they add up fast in test-heavy VPCs).
- Zombie services — like AWS RDS instances marked "deprecated" but still online, or Azure test containers left over from CI runs.
In Cloudaware, this data gets pulled automatically — from compute, storage, and network services — then correlated with tagging and CMDB ownership.
Element of the Idle resources report in Cloudaware:
So instead of "orphaned resource," you get "Team Delta owns 11 unattached disks in staging-eu-west-1 totaling $3,200/mo."
Once identified, your move is simple:
- Delete immediately (if it’s clearly unused).
- Tag for review (if ownership is unclear).
- Schedule parking for dev/test instances using off-hours automation (think: shut down nightly at 8 PM, restart at 7 AM).
You’ll want to set this as an ongoing policy — not just a one-time sweep. Idle resource cleanup should be part of your weekly FinOps ops cadence or built into infra-as-code pipelines.
Once the clutter’s cleared?
Time to tackle long-term savings strategy.
Read also 👉 Top 13 Cloud Monitoring Tools Review: Pros/Cons, Features & Price
Step 4. Commitment strategy (RI, Savings Plans, CUD, EA)
This part of the cloud cost assessment is all about balance: how much to commit, how long, and across which services. Get it wrong, and you’re stuck with unused reservations bleeding budget.
Get it right, and you’re talking 30–70% off on compute and storage over the long term.
So where do you start?
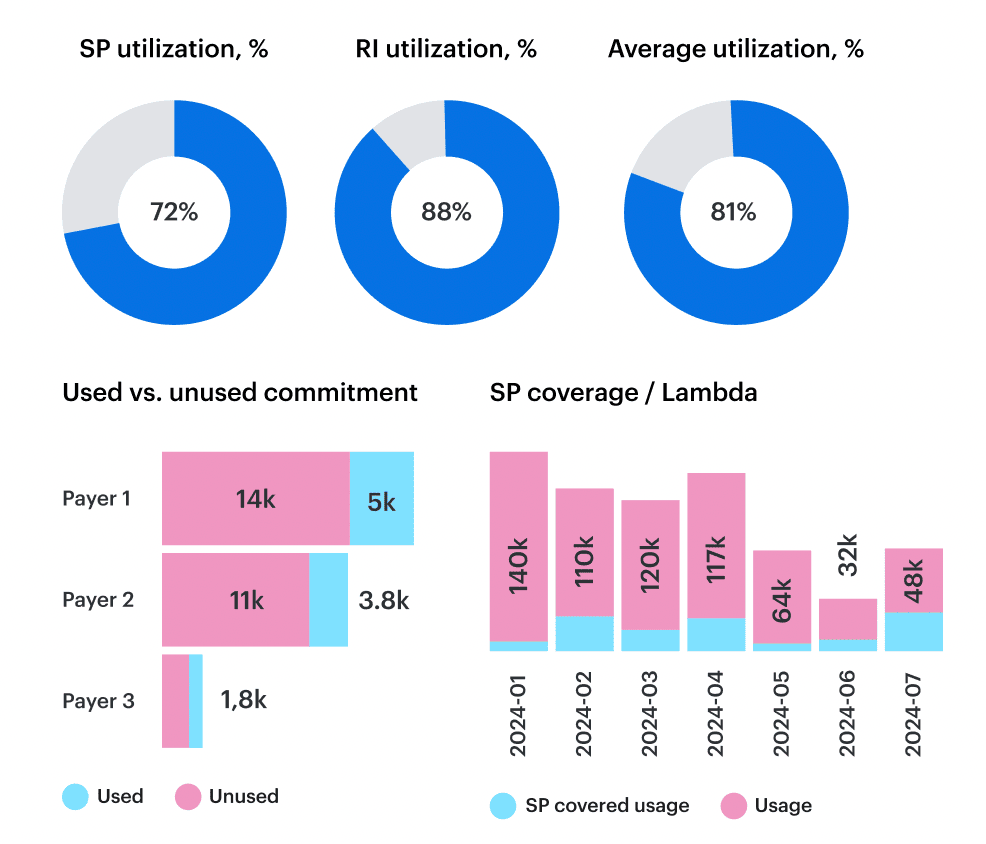
1. Measure coverage vs. utilization
Coverage shows how much of your eligible cloud spend is covered by commitments (typically EC2, Fargate, Lambda, SQL DBs, etc.). Utilization shows how much of those commitments you’re actually using.
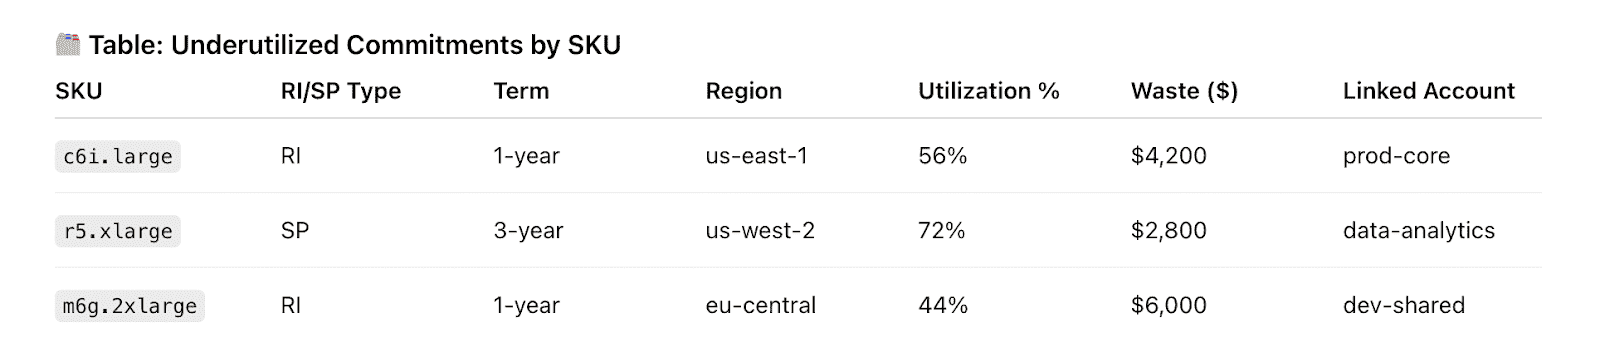
A part of the Cloudaware report. Schedule a demo to see it live
We recommend 60–85% coverage and >90% utilization for steady-state workloads.
In Cloudaware, this is visualized per cloud, per family (e.g., m6a, r5, gp3), and per region, tied back to the CIs in your CMDB. So you’re not just seeing “underutilized SPs” — you’re seeing which team committed to which instance family and how it’s tracking.
2. Analyze term mix: 1-year vs. 3-year
Not every team needs the same commitment horizon. For core production services with stable usage, 3-year terms bring better discounts. For variable dev workloads or newer apps, 1-year or convertible RIs offer more agility.
🎯 AWS Savings Plan pricing shows up to 72% discount on 3-year All Upfront plans — but that’s only worth it if you’re sure you’ll use the hours.
3. Run breakeven and payback analysis
Every commitment should come with a plan: when will it break even? What’s the payback period? At what usage % does it become a liability?
Example: If a 1-year RI costs $4,800 upfront and your on-demand CIs would run $600/month, you’ll hit breakeven in 8 months. That’s great — if you’re not about to move that workload to K8s next quarter.
4. Build into sprint planning and platform roadmaps
Commitments need ownership. If you’re not tying purchases to actual teams, usage forecasts, and environment targets, they’ll get orphaned. The best FinOps teams loop in product and platform teams before signing deals — so discounts align with capacity needs and feature plans.
Now that commitments are locked and mapped, let’s get smart about elasticity 👇
Step 5. Autoscaling and scheduling
If a dev cluster is burning CPU credits at 3 a.m., you need signals first. Cloudaware provides those signals; your platform tools do the scaling and the stop/start.
What Cloudaware surfaces:
- Workloads tagged environment:dev/stage with off-hours activity and estimated savings.
- Candidates for “parking” (low/no usage after hours, weekends, or >X idle hours).
- Utilization patterns (p95 CPU/memory, requested vs. allocated) at CI/app/team level to inform scaling policy reviews.
- Before/after spend and utilization deltas so you can verify impact once changes ship.
- Owner mapping and routable findings (reports/exports/tickets) so actions don’t stall.
What your team enforces (outside Cloudaware):
- Apply autoscaling via K8s HPA/KEDA, EC2 Auto Scaling target tracking, or Azure VMSS.
- Implement start/stop schedules with your schedulers/runbooks/Terraform.
- Add TTLs/off-hours rules for non-prod and ephemeral resources.
Scale-to-zero in dev/test
Use Cloudaware to identify services that run outside business hours (e.g., no API/login activity after X hours) and quantify savings. Then implement stop/start or scale-to-zero in your own toolchain. Cloudaware will confirm the drop in off-hours spend on subsequent billing snapshots.
Event-driven autoscaling
Cloudaware highlights under/over-provisioned services (p95 CPU/mem vs. requests/limits) with business context (app/team/env). Your platform team adjusts HPA/KEDA/ASG/VMSS policies; Cloudaware shows the cost/perf effect with pre/post views.
Weekend & overnight parking
Cloudaware flags patterns like:
- env:dev active on weekends,
- env:qa with <10% utilization after hours,
- jobs with fixed schedules but no autoscaling.
Route the findings to owners, enforce schedules in your environment, and use Cloudaware to monitor adherence and spend deltas.
How to tell it’s working
- Off-hours spend ↓ for dev/stage subscriptions/projects.
- Compliance rate ↑ for scheduled resources (by team/app).
- p95 vs. requested/limits gap narrows on key workloads.
- Fewer anomalies tied to “always-on” non-prod.
Read also 👉 IT Asset Disposition - How to Close the Loop on Retired Assets
Step 6. Storage optimization
If compute is the headline act in cost savings, storage is the quiet drain no one budgets for — until the bill lands. And by then, you’re already spending 15–25% of your cloud bill on disks, snapshots, and object storage that rarely gets touched.
This step in the cost optimization workflow is about surfacing the long-tail of waste: persistent disks no longer attached to live workloads, snapshots piling up with no TTL, and general-purpose tiers holding cold data.
Start here:
1. Identify what’s idle
Cloudaware automatically detects:
- Unattached EBS volumes sitting for 10+ days
- Unused snapshots that exceed retention policies
- Public cloud disks with zero read/write in 30+ days
An element of the Cloudaware FinOps dashboard. Schedule demo to see it live.
All of these can be flagged with dollar-value impact using customizable policies in the Compliance Engine. You can tweak thresholds, track policy drift over time, and trigger follow-up tasks with owner mapping via CMDB.
Tier and class audits
While Cloudaware doesn’t enforce S3 class transitions or Azure blob tiering directly, it gives you the metadata:
- Region
- Storage class (Standard, Infrequent Access, Archive)
- Age
- Access pattern (based on usage data, where available)
Use this to shortlist objects or buckets that could benefit from archival policies. AWS Storage Lens and GCP’s Object Lifecycle Management are great tools to pair with this data.
Set up snapshot governance
Snapshots are cheap — until they’re not. Define what “clean” looks like per environment:
- Retain 3–5 latest for dev/test
- Monthly snapshots for prod
- Auto-delete after 30/60/90 days
Flag anything outside that range using Cloudaware’s policy engine and tag filters.
Orphaned volumes and snapshots can make up 20–30% of unused infrastructure spend in large orgs.
The win here isn’t just cheaper disks — it’s predictability. And fewer Slack threads chasing who owns volume-08d1... that's been idle since 2022.
Step 7. Network and data transfer tuning
If you’ve ever seen a clean-looking infra report get torpedoed by a $12K NAT Gateway line item, you’re not alone. Network traffic is one of the most invisible — but increasingly expensive — parts of cloud cost optimization.
It’s not just egress. It’s how much you move, where, and through what service. This step of the cost optimization process is about surfacing those hidden paths and giving platform teams the visibility they need to act.
Egress and NAT Gateway traffic
Start with the usual suspects:
- NAT Gateway data processing charges in AWS — $0.045/GB adds up fast.
- Inter-AZ or inter-region transfer in GCP and Azure — especially for distributed resources.
- Unoptimized peering between VPCs — often misrouted, often expensive.
Cloudaware helps you spot these through detailed billing ingestion, parsed by service line and enriched with tags like business_unit, project, application. That means you’re not just seeing “Data Transfer Out” — you’re seeing “Team X’s staging cluster is pushing 2TB/week to us-east-2 over NAT.”
Want to benchmark it? According to AWS pricing, NAT Gateway egress at scale can exceed $1,000 per month per high-throughput app.
Inter-cloud or inter-region traffic
Many orgs with multi-cloud setups (think: GKE to S3, Azure Functions hitting Snowflake in AWS) underestimate transfer costs until the invoice hits. Cloudaware doesn’t inspect traffic routes but gives you cross-cloud cost views to isolate where these fees appear.
Use this to flag:
- CDN traffic vs origin fetches.
- APIs that serve from the wrong region.
- Microservices split across cloud providers.
Then work with platform engineers to consolidate regions, adopt caching, or apply compression where needed.
Action from visibility
Cloudaware won’t re-architect your CDN policy. But it will give you the numbers — and the owners — so the right people can. Use cost trends and anomalies to open conversations about:
- Moving to CloudFront or Cloudflare for edge caching.
- Reviewing ALB vs NLB vs Gateway traffic flow costs.
- Realigning data processing apps to live closer to data stores.
This is about catching what’s silently inflating your spend. When every gigabyte costs, routing matters.
Read also 👉 10 Cloud Cost Optimization Tools That Actually Reduce the Bill
Step 8. Cost allocation for shared services
There’s always a line item no one wants to own. NAT Gateway. Prometheus. CI runners. Logging pipelines that span every Kubernetes cluster in the org. These shared layers aren’t tied to a single deployment or sprint — but they burn real dollars.
And without proper cost allocation, they slip through reviews, inflate platform spend, and erode team accountability.
This is the part of your optimization assessment that brings order to the chaos: defining who should carry what — and how much.
Pinpoint what’s shared and why it matters
In Cloudaware, you’ve already got your billing data normalized and mapped to CIs. That means your NAT Gateway isn’t just “$12K/month” anymore — it’s “80% traffic from two staging VPCs owned by DataOps and API Gateway teams.”
Here’s how teams use that to assign cost:
- Tag-based attribution —
application__c,owner_email, andenvironment__ctags help group spend across ephemeral services. - Weighting keys — for infra like Prometheus, you can allocate based on volume of metrics ingested per app; for logging, per GB of indexed data.
- Custom logic — assign flat percentages when usage data is sparse, or split by team size, traffic, or even number of pods generating logs.
And because it’s all enriched via CMDB, the output is a scoped report by team, app, or cloud environment that fits right into your chargeback or showback process.
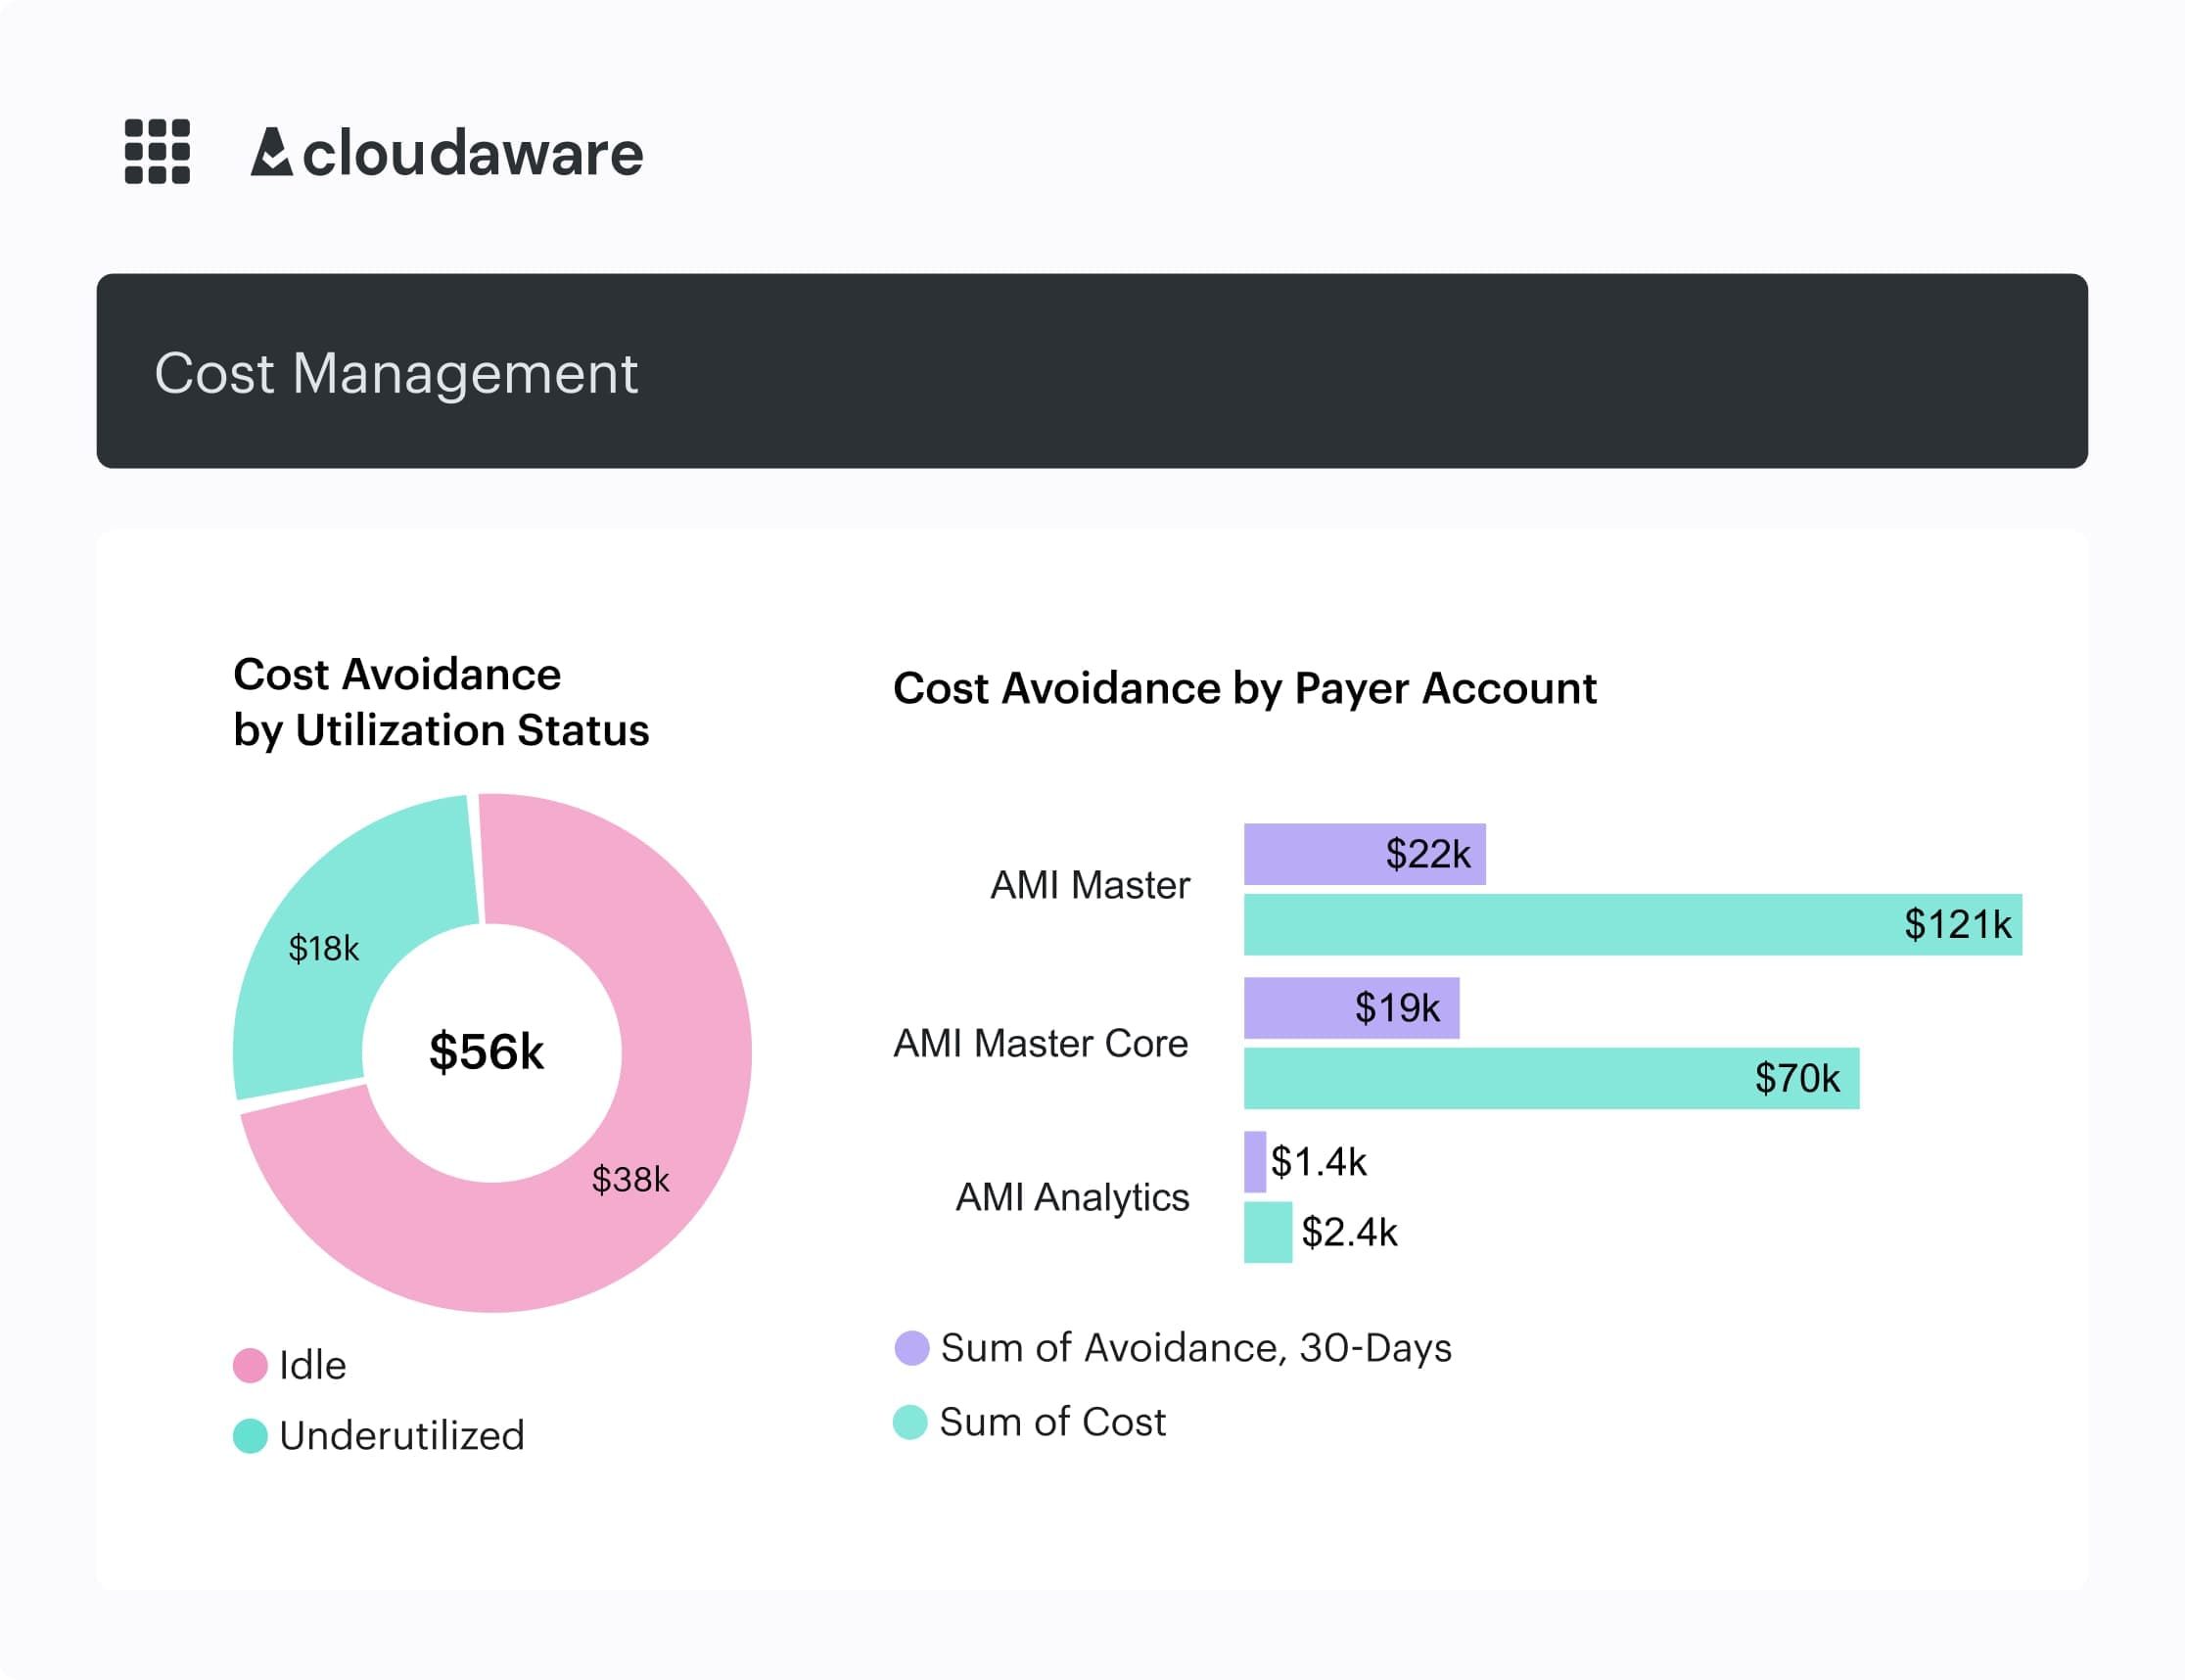
Element of the cost allocation in Cloudaware. Schedule demo to see it live.
Tie it into FinOps rhythms
Allocating shared services doesn’t happen in isolation. It feeds into multiple FinOps loops:
And yes, Cloudaware dashboards support all of this — filtered views by Product, Service, Environment, and even custom fields. So you can slice spend by “Top 5 apps hitting NAT”, or “Unallocated log storage by region.”
Read also 👉 7 Best Cost Allocation Software for FinOps Teams in 2025
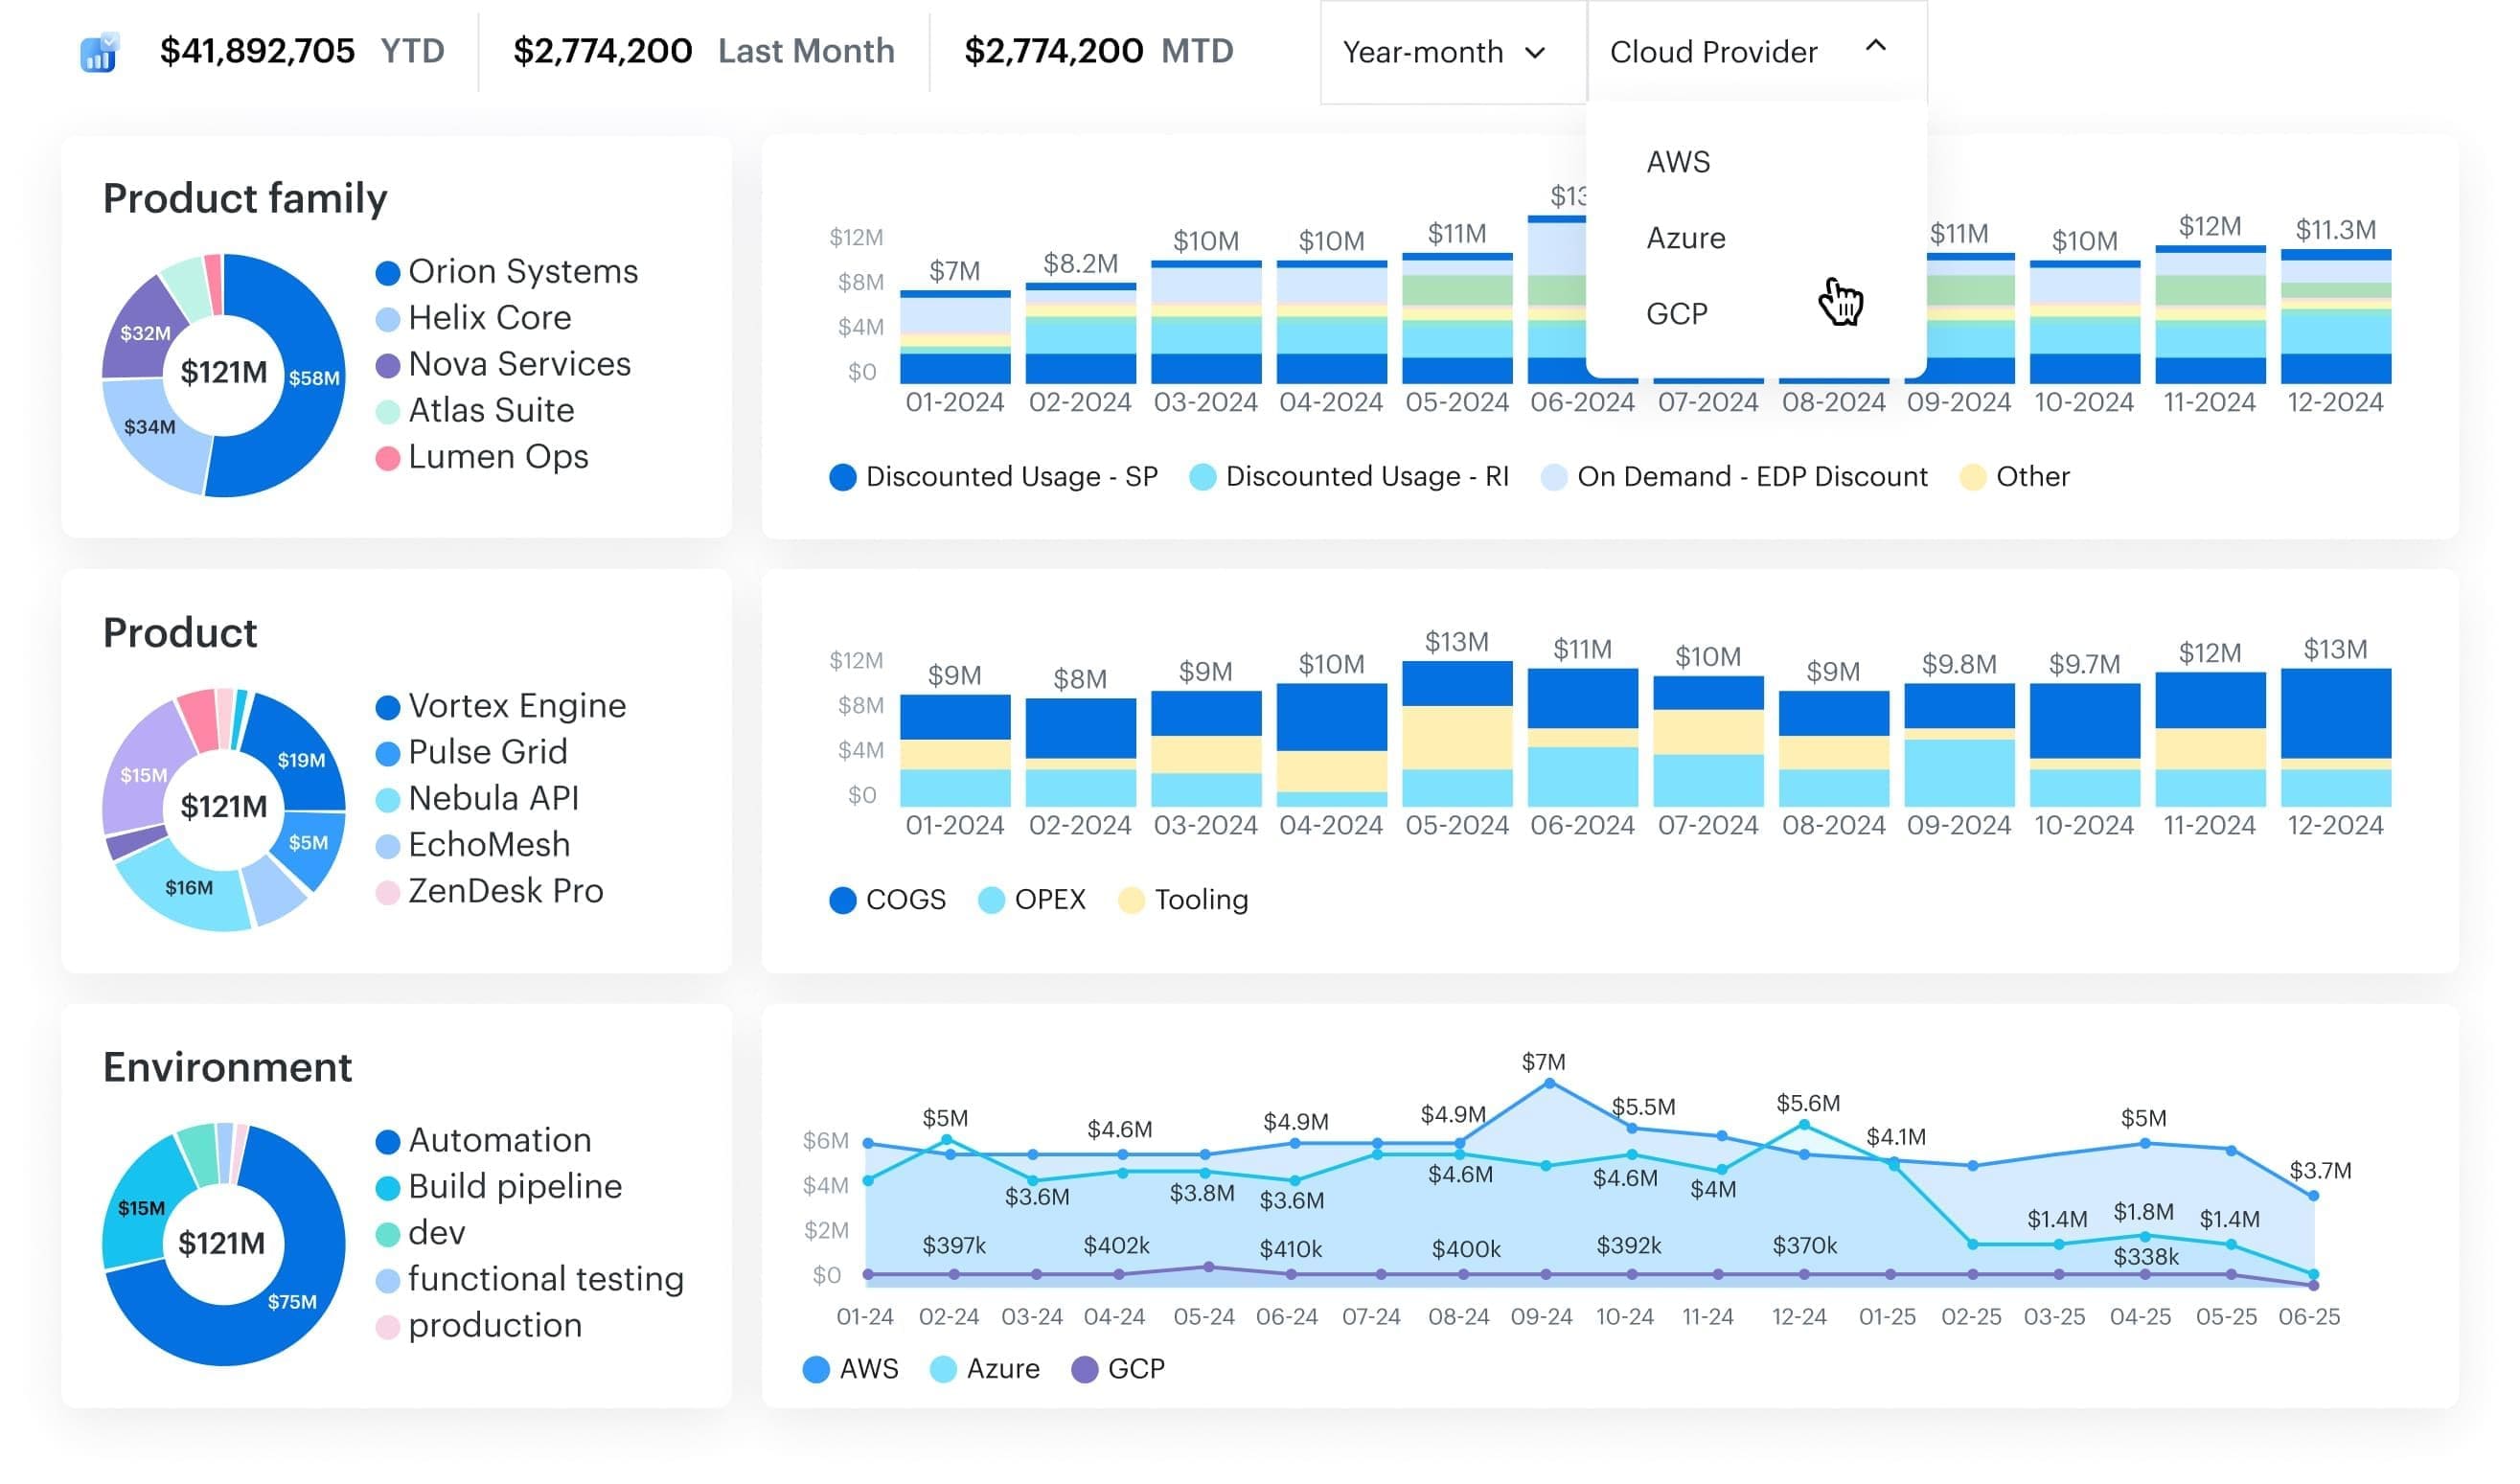
Cloudaware tools for cloud cost optimization
If you’re ready to assess cloud cost management without drowning in CSVs, toggling between 6 tabs, or guessing which team owns what — Cloudaware gives you the complete picture. In one place. With zero fluff.
This is a cloud cost optimization platform built for scale. It integrates directly with AWS, Azure, and GCP billing APIs, ingests your data daily, and enriches every cost line with CMDB context: who owns it, what it’s running, where it fits in your architecture.
That means you don’t just see cloud costs by instance or service — you see them by application, environment, team, region, and business unit. Because FinOps doesn’t start with spreadsheets. It starts with visibility.
Whether you’re optimizing a central cloud platform or supporting dozens of distributed teams, Cloudaware’s cost tools slot into your daily workflows:
- Daily multi-cloud billing ingestion (AWS CUR, Azure Cost Mgmt, GCP BigQuery).
- Unified CMDB with app/env/team mappings.
- Tag coverage analysis with remediation backlog.
- Rightsizing insights (p95 CPU/mem vs requested).
- Idle/orphaned resource detection.
- Commitment coverage vs utilization reports.
- Cost dashboards by service, account, app, region, team.
- Shared cost allocation (e.g. NAT, DNS, CI/CD).
- Anomaly detection and routing.
- Chargeback/showback reporting.
- Pre-built and custom FinOps KPIs.
- Slack/email/Jira integration for actioning spend events.