


You landed here because choosing a cloud cost management tool feels like trying to pick a movie on Netflix – with 10 tabs open and zero clarity. Been there. One tab’s showing pricing tiers with no real context. Another promises "AI-driven insights" but won’t tell you what that means. Meanwhile, your cloud bill is creeping up like it’s got a vendetta.
Thing is, I get it. Sorting through cloud monitoring tools takes forever. It took me 5 days just to really test 24 of them – and I shortlisted the 13 that actually do what they claim. I pulled in everything: client stories, teammate insights, recent user reviews, even Reddit threads that got a little too honest.
Because here’s what we really want to know:
- Which cloud service monitoring platform actually saves time, not just logs it?
- Who’s good at multi-cloud setups – and who’s faking it?
- Where’s the hidden cost (because there always is)?
- What tool gives you clear, actionable alerts… not just noise?
- How steep is the learning curve – honestly?
- Who’s best for lean teams vs enterprise-scale?
- Do trial periods really let you see the full picture – or are they bait?
Let’s get into the real talk. No fluff. Just what works, what breaks, and what costs more than it should.
Key points of cloud monitoring tools from our research
Here’s our curated cloud monitoring tools list – the platforms that stood out in real-world tests, team interviews, and user reviews. Whether you're chasing uptime, cutting costs, or just tired of flying blind, this is your go-to lineup:
- Cloudaware best for regulated enterprises needing multi-cloud visibility with built-in compliance and cost tracking.
- IBM Instana best for teams that want real time, zero-config service discovery across complex cloud-native apps.
- Datadog best for scaling teams looking for a unified view of logs, metrics, and traces in one clean dashboard.
- Dynatrace best for enterprises needing AI-powered root cause detection and full-stack observability.
- SolarWinds best for hybrid IT teams needing strong network monitoring and on-prem/cloud visibility.
- Device42 best for IT teams managing physical and virtual infrastructure needing automated discovery and dependency mapping.
- ServiceNow best for DevOps/SRE teams monitoring microservices with real-time distributed tracing.
- Ivanti best for IT departments looking to combine asset visibility and endpoint automation in one interface.
- Axonius best for security-conscious orgs needing to reconcile and monitor every asset across cloud and on-prem.
- New Relic best for cloud-native teams wanting full observability with generous free-tier access.
- Splunk Observability best for large orgs needing scalable, real-time insights and anomaly detection across data streams.
- Flexera One best for enterprises focused on license optimization and hybrid cloud cost governance.
- OpenText (OpsBridge) best for IT Ops teams that need AI-assisted event correlation in massive hybrid environments.
We didn’t just throw together a list. This cloud monitoring tools list was shaped by 5 days of hands-on testing, 24 products reviewed, and deep dives into user feedback – Reddit threads, Quora rants, and real customer stories from our network. Everything here earned its spot with real performance, not just big claims.
Methodology: How we tested these platforms
Alright – here’s exactly how we did it. No fluff, just the nerdy details.
We started with 24 platforms. That’s everything from the obvious names like Datadog and Splunk to lesser-known players like Cloudaware and Axonius.
First pass? We signed up for each trial. If a tool offered a hands-on, we took it. If it didn’t, we booked demo calls and asked the hard questions. No pitch decks – just real product walkthroughs.
Then we rolled up our sleeves and tested the thing that matters most: how the tool actually works. We looked at real-time alerting, automated discovery, log depth, correlation accuracy, and what it feels like to monitor an app mid-incident. You know – that “something just broke in prod” kind of pressure.
While we were digging into the UIs, dashboards, and agent installs, we also studied what users were saying. G2, Capterra, TrustRadius?
Absolutely.
But we didn’t stop there. We went into Reddit threads where engineers get brutally honest. We scanned Quora answers where IT leads break down dealbreakers.
We also cross-checked tools listed in Gartner, Forrester, and peer-reviewed spaces. Not because we needed a magic quadrant to tell us what’s good – but because if a tool shows up and the community loves it, that says something.
We paid attention to cloud monitoring software that made setup intuitive. We flagged cloud service monitoring platforms that actually integrated with the messy, hybrid, multi-tool world most teams live in.
The goal? Build a shortlist you could actually use. One that reflects how these tools perform when your boss wants uptime, your team wants fewer false alerts, and your budget wants receipts.
Cloudaware
G2: 4/5
Trial days: 30 days free
Best for: Regulated enterprises and fast-scaling SaaS in hybrid/multi-cloud needing a CMDB-backed platform for configuration, compliance, and FinOps in one place.
When Chevron needed to rein in sprawling assets across AWS and Azure, they chose Cloudaware. Same with Coca-Cola. Same with NASA.
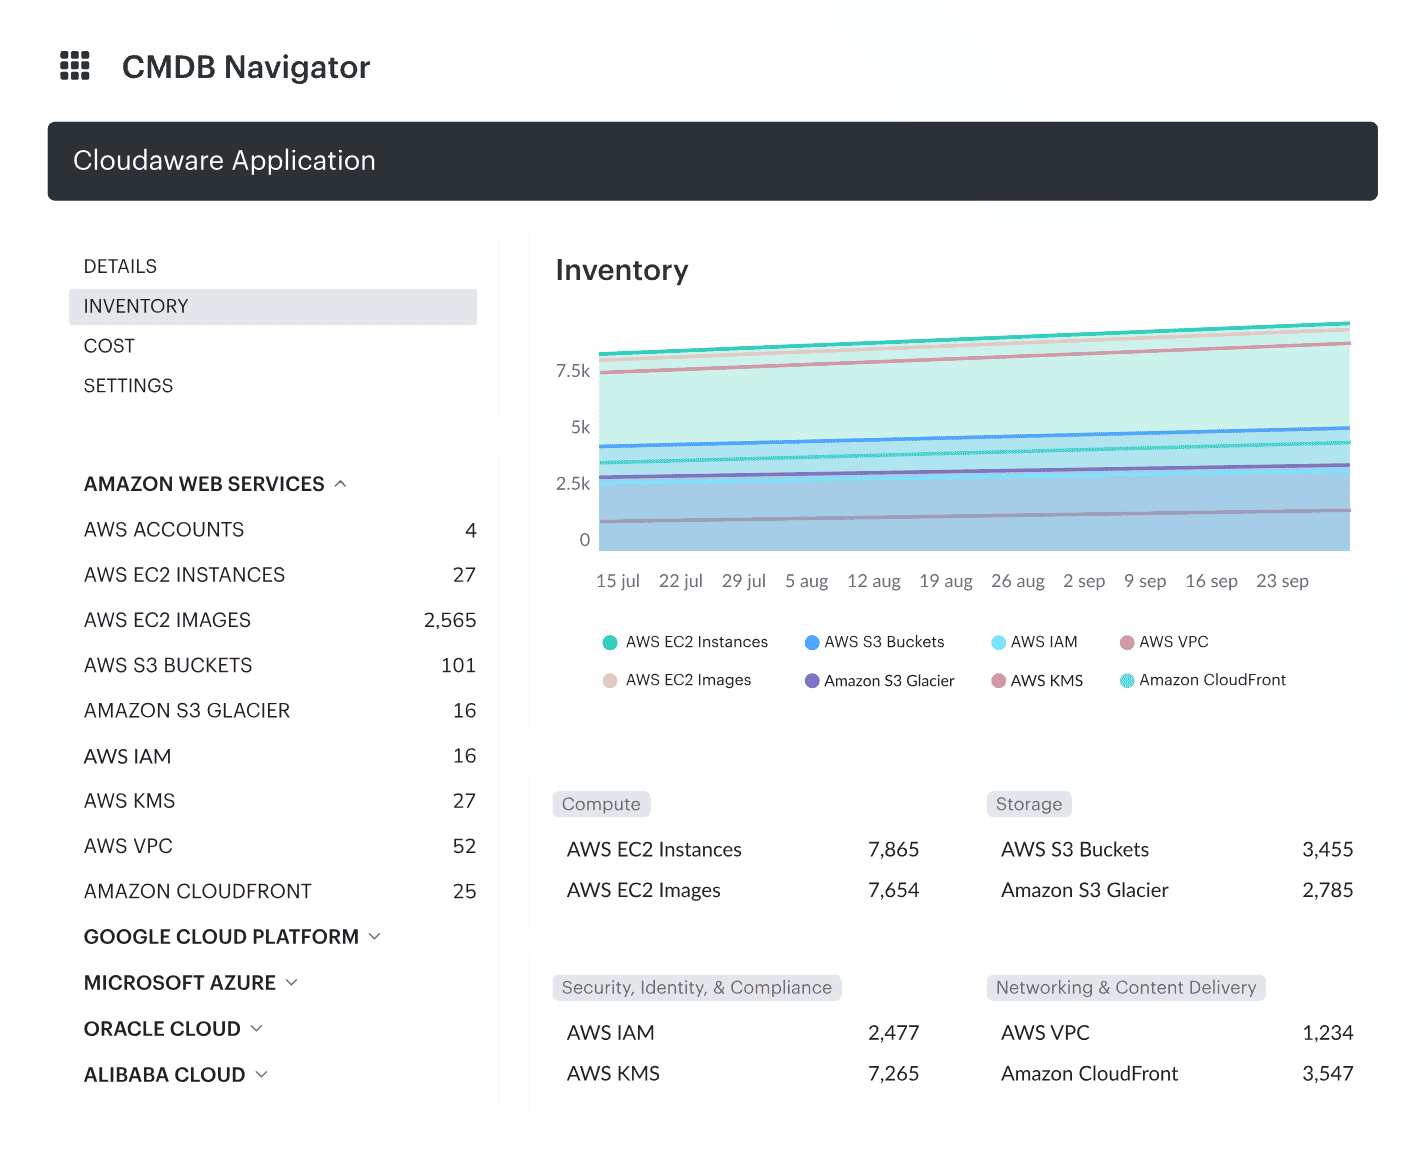
Why? Because when you manage thousands of resources across hybrid cloud environments, you don’t need noise – you need a map. And that’s what Cloudaware delivers: real time visibility with deep CMDB intelligence behind it.
Where most cloud infrastructure monitoring tools give you logs, Cloudaware gives you connections – who owns what, what’s misconfigured, and how it’s all tied together.
Features
- Cloud CMDB. Auto-discovers assets and builds a continuously updated configuration map – across accounts, providers, and regions.
- Security Monitoring & Compliance. Out-of-the-box CIS, HIPAA, PCI – any policy or control you need. Drill into noncompliant resources with custom dashboards instantly.
- Cost & Usage Analytics. Slice cloud spend by team, project, or resource group. Built-in budgeting and alerting.
- Multi Cloud Monitoring Tools Integration. Supports Oracle, Alibaba, AWS, Azure, GCP, Kubernetes – fully mapped in one UI.
- Infrastructure Monitoring. Monitors compute, storage, and service uptime. Correlates with changes and drift.
- Visibility. Every resource. Every policy. Zero blind spots.
Pricing
Here’s how I’d tighten it up for an expert reader – clear, decision-ready, still conversational, and keeping cloud monitoring services:
Cloudaware pricing is workload-first, not “seat-first.” Think: server count drives the base, then you layer on modules and extra user access. Minimum buy-in is typically 50 servers + 1 user. For 2025 examples, you’ll see entry pricing around ~$230/month, and ~$400/month for ~100 servers.
Trial is 30 days, which is enough to validate discovery, CMDB enrichment, and alerting in production-like conditions.
Now your scenario: 3 clouds + 100 servers + 5 users lands at ~$400/month base, then add extra user licensing and any compliance/FinOps add-ons you enable. That’s the real lever.
Pros and Cons
✅ Unified multi-cloud visibility: "It provides a unified view of all cloud resources… The platform offers a range of features, including automated tasks, inventory management, cost optimization, compliance management, and security" g2.com.
✅ Real-time health monitoring: "CloudAware… give us a real-time visibility into the health and performance of your cloud resources" g2.com.
✅ Seamless multi-provider integration: "One of the standout features of Cloudaware is its ability to handle multiple cloud providers… enabling unified management across different environments" g2.com.
⚠️ Overwhelming UI and slowness: "Cloudaware can be slow at times, and the user interface can be overwhelming and difficult to navigate. Additionally, the pricing can be high for small businesses or startups" g2.com.
⚠️ High cost for small teams: "It is not free and price may not be okay for smaller organization and limited budgets" g2.com.
⚠️ Steep learning curve: "While Cloudaware is designed to be user-friendly, some users may still find the initial learning curve to be steep… users may need time to become fully comfortable and proficient with all the features" g2.com.
IBM Instana Observability
G2: 4.4/5
Trial days: 14
Best for: Teams seeking zero-configuration full-stack monitoring – Instana auto-discovers services for quick, end-to-end visibility in modern cloud-native stacks.
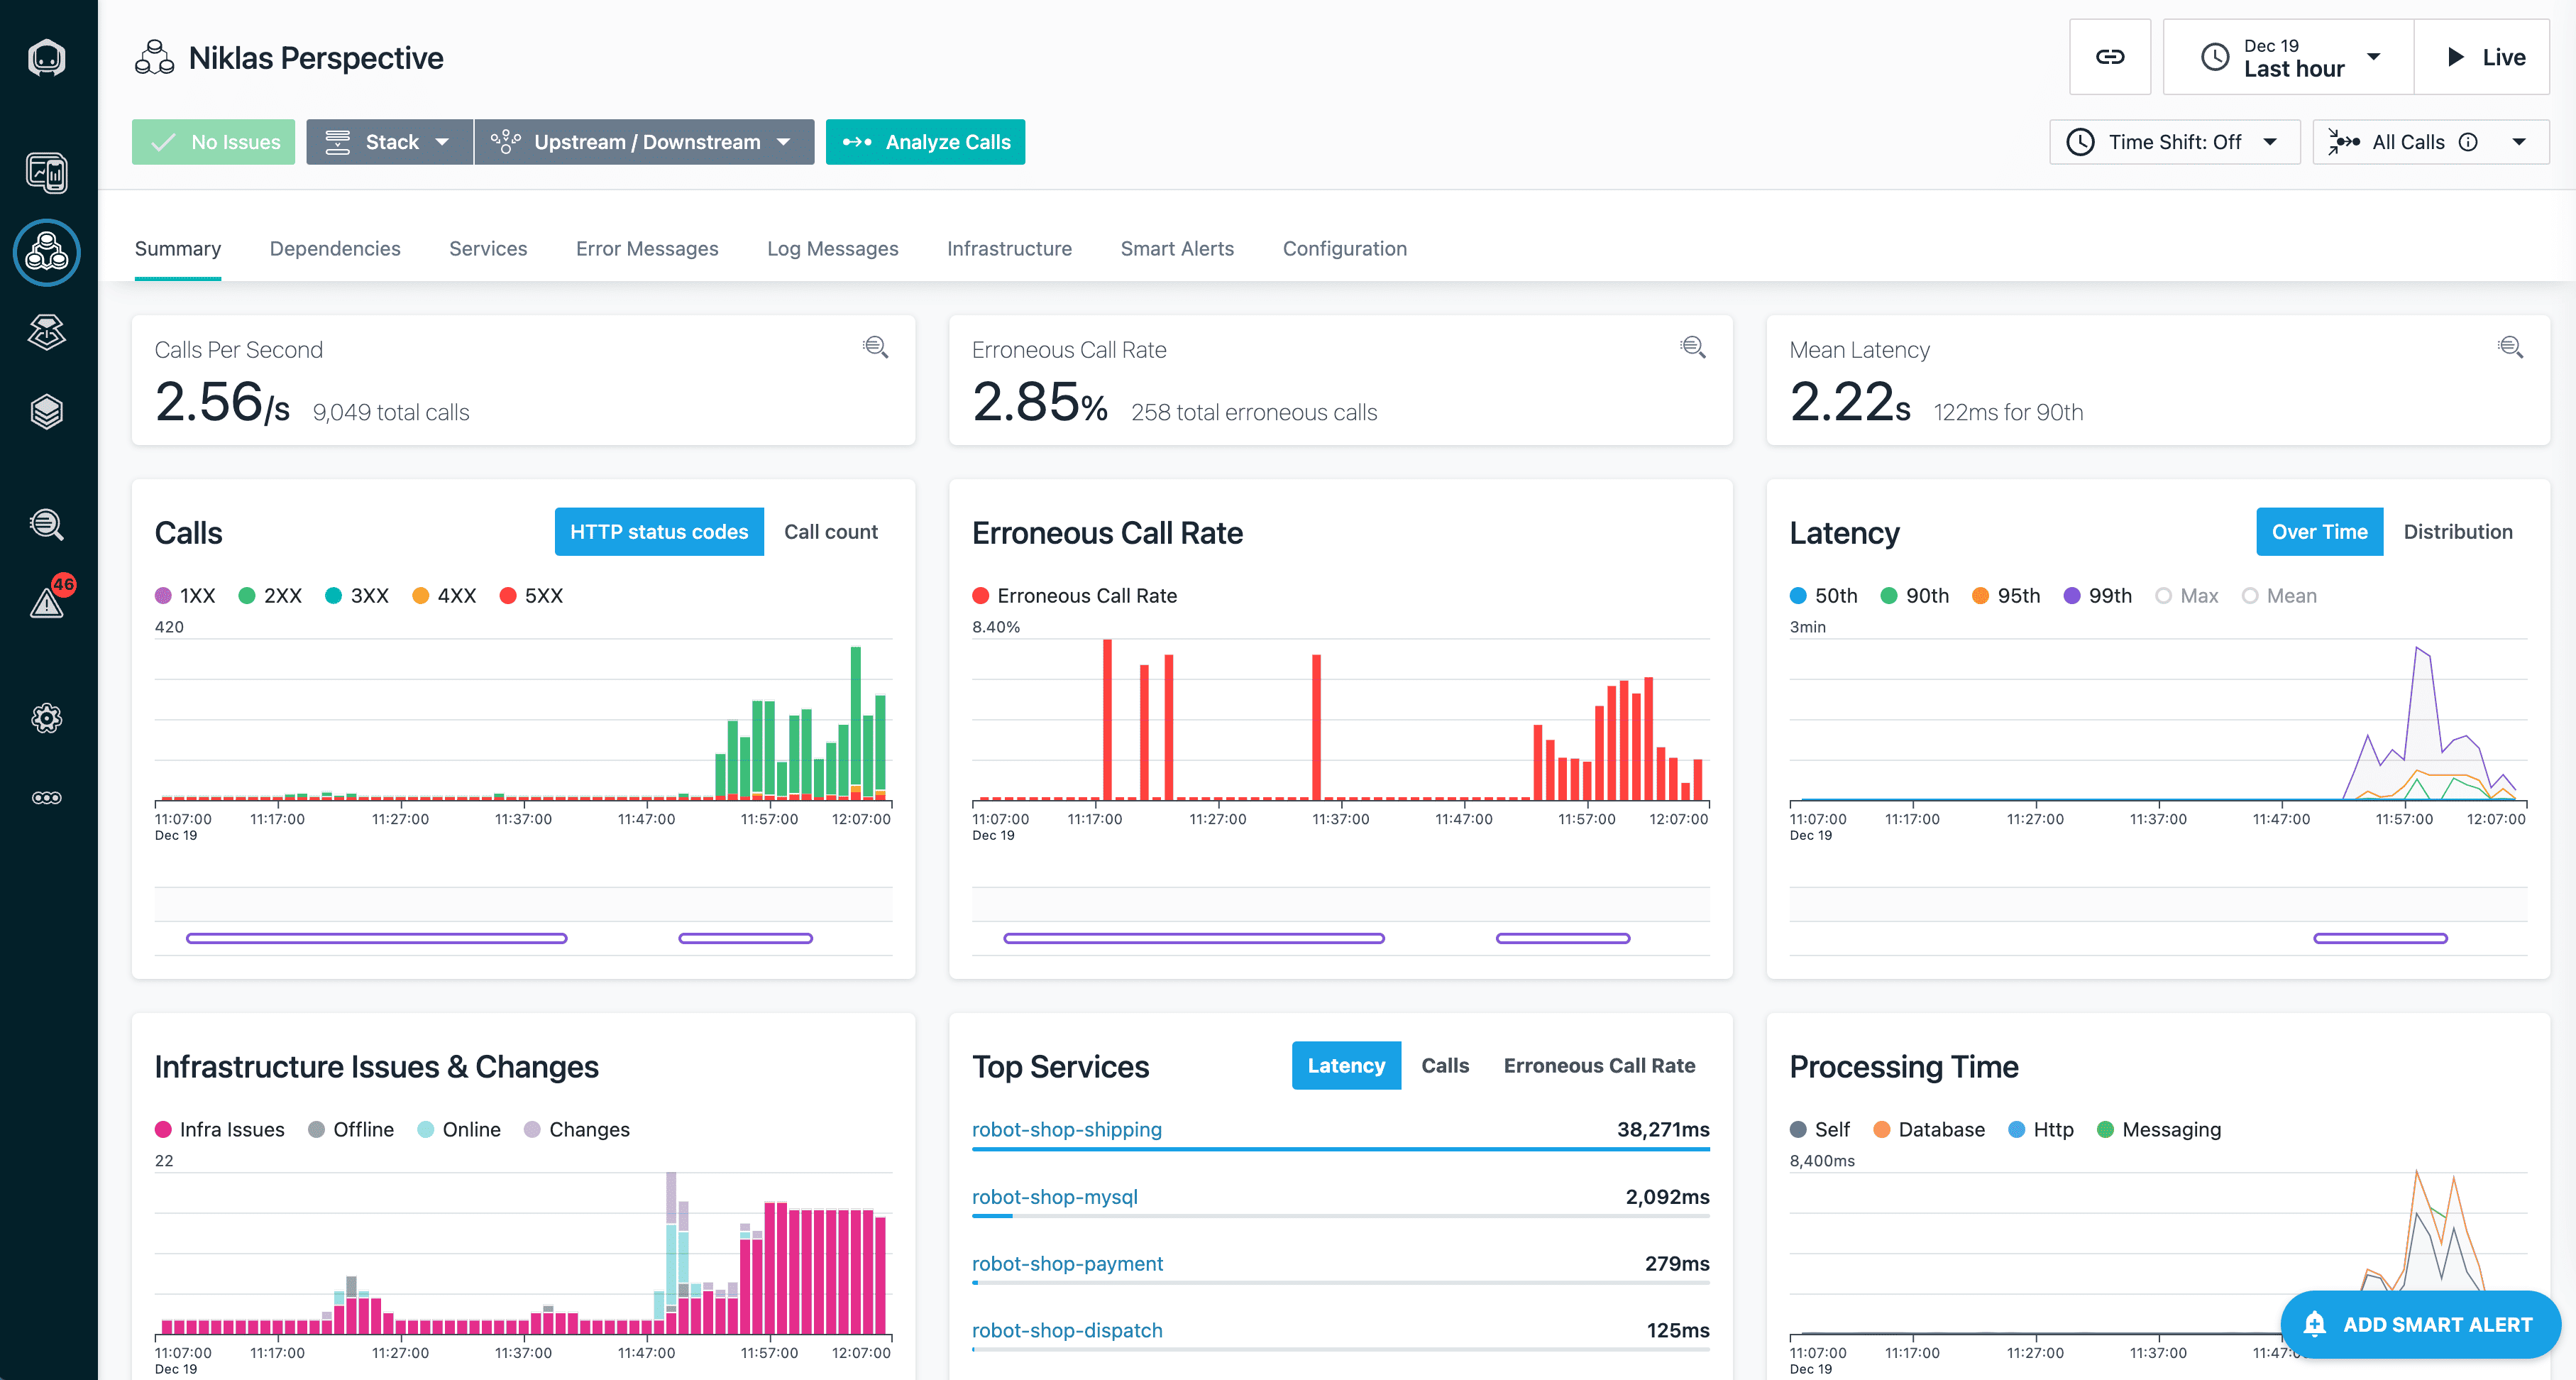
Image source.
IBM Instana is the cloud monitoring platform you reach for when your environment changes faster than your dashboards can keep up. Containers churn. Services move. APM gaps show up right when the incident hits. Instana’s promise is simple: auto-discovery plus a living service map that stays accurate while your stack mutates.
Teams running high-traffic digital experiences lean on it for two jobs: catch degradation early, and cut triage time by pointing at the dependency that actually broke. That’s where it wins – context. Especially when you’ve got lots of users and “who owns this service?” is a daily question.
Features
- Infrastructure monitoring: host/container/K8s visibility with fast signal, built for hybrid reality.
- Automatic topology + dependency mapping: service relationships update as deployments change.
- Root cause workflows: traces + metrics + service map to narrow blast radius quickly.
- Alerting that respects the stack: signals roll up around services, not random components.
- Enterprise integrations: slots into existing cloud monitoring services without rebuilding your ops process.
Pricing
Instana pricing is simple in the way DevOps people actually like: you pay per Managed Virtual Server (MVS), not per user. So your 5-person team doesn’t quietly double the bill.
In 2025, IBM shows Essentials at $20/MVS/month, and self-hosted options reaching $93.80/MVS/month. Trial is 14 days, enough to validate auto-discovery, service mapping, and alert quality in production-like traffic.
Now run the math: 100 servers ≈ 100 MVS → $2,000 to $9,380/month, whether those servers sit in one provider or spread across 3 clouds. That’s your baseline for serious infrastructure monitoring – then you decide how deep you want the extras.
Pros and Cons
✅ End-to-end monitoring & discovery: "It provides end‑to‑end monitoring across front end, back end, databases, and cloud APIs, all in one place… The automatic discovery of services and real‑time visibility make troubleshooting fast and easy" g2.com.
✅ Real-time insights & anomaly detection: "Instana’s modern UI makes managing even complex environments effortless… abnormal spikes and unusual service communications are detected with accuracy, crucial for security "g2.com.
✅ Easy integration and setup: "Instana is simple to implement, integrates smoothly during migrations and deployments… Overall, it has greatly improved our operations by streamlining monitoring and ensuring better performance and security" g2.com.
⚠️ Initially overwhelming interface: "At first, the dashboard and UI felt a bit overwhelming, with lots of data and a steeper learning curve compared to lighter tools" g2.com.
⚠️ Pricing is high for scaling: "Pricing can also be high for smaller teams… as we scale, the costs become even more prohibitive" g2.com.
⚠️ Limited customization: "Some areas of IBM Instana could be improved, such as providing more flexibility in customizing dashboards and alert rules for complex use cases" g2.com.
Read also: DevSecOps Architecture (A Practical Reference Model Teams Actually Use)
Datadog
G2: 4.5/5
Trial: 14 days
Best for: Organizations that need real-time dashboards and analytics across their infrastructure – Datadog provides live metrics, anomaly detection, and alerts in one unified view.
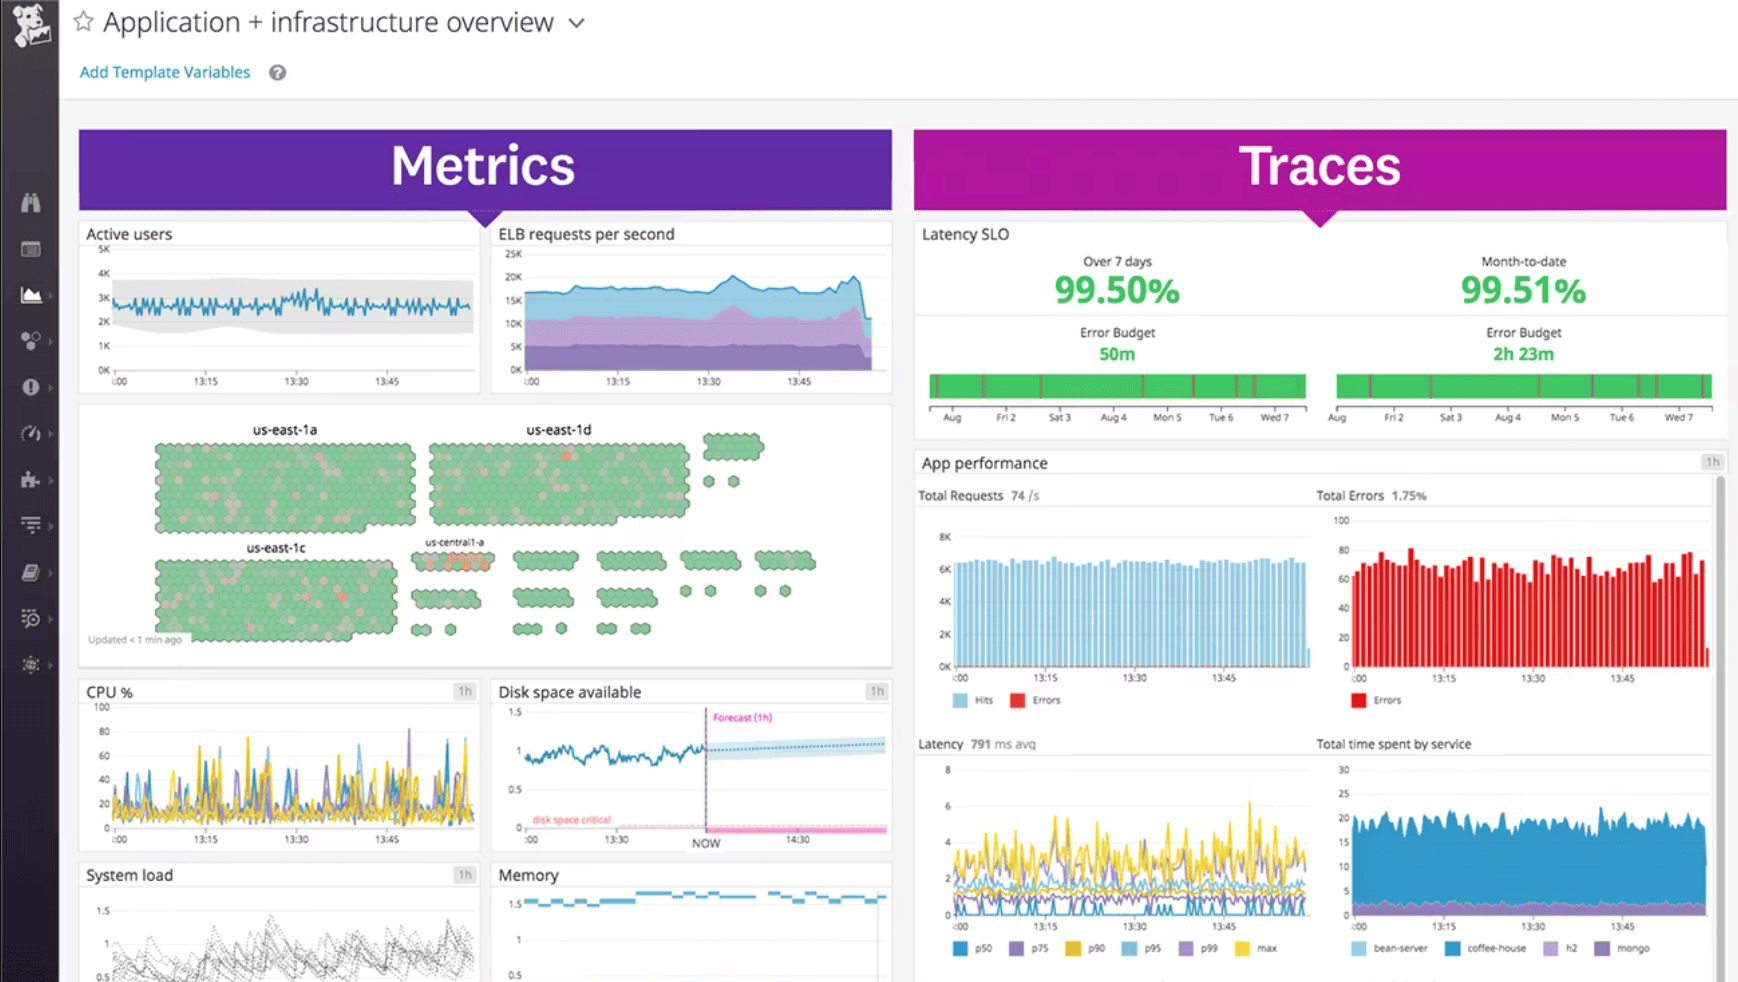 Image source.
Datadog earns its spot on any shortlist because it collapses your monitoring stack into one stream: metrics, logs, traces, RUM, synthetics – linked by tags you control. That matters when cloud environments are noisy and your incident call starts with, “Which service changed?”
Peloton used Datadog to watch availability and performance across AWS and connect real customer experience signals (like video quality or Wi-Fi strength) back to what the platform was doing. PayPal scaled observability with OpenTelemetry and Datadog so teams could move from frontend symptoms to backend traces without losing the thread. Autodesk leaned on Database Monitoring to catch slow queries before they turned into support tickets.
For experts comparing cloud infrastructure monitoring tools, here’s the practical test: can your service tags survive org sprawl and still deliver clean visibility? Datadog usually can. It also helps when Users need ownership context; the Software Catalog brings service inventory and metadata close to “CMDB-ish” without the ceremony.
Features
- Infrastructure Monitoring: host/container metrics plus alerting built for fast triage.
- APM + trace correlation: follow a request end-to-end, then pivot to the exact trace.
- Unified service tagging: env/service/version tags that keep telemetry joinable across teams.
- Real-time dashboards: rapid build + templates so you’re not reinventing panels.
- Software Catalog (ownership): service inventory with owners, links, and metadata.
- Database Monitoring: query-level visibility for “DB is the bottleneck” moments.
And yes, if your main requirement is cloud server monitoring tools at scale, Datadog’s breadth can save you from stitching five vendors together.
Pricing
Datadog pricing starts clean, then gets real. Your anchor is hosts: Infrastructure Pro is $15/host/month (annual), Enterprise is $23/host/month (annual), or $27 monthly.
Trial: 14 days.
For your setup – 3 clouds, 100 servers, 5 users – the math is straightforward: ~$1,500/month on Pro, ~$2,300/month on Enterprise. Users don’t drive cost; hosts do.
Now the part experts care about: the “real” total depends on what you turn on next. Logs are billed per GB, APM often stacks per host, and custom metrics can creep. Budget a buffer if you’re logging everything and calling it observability.
Pros and Cons
✅ Unified observability platform: "Datadog gives us a single observability layer that ties metrics, logs, traces, and AI-driven insights together… the correlation between logs → metrics → alerts is incredibly powerful" g2.com.
✅ High reliability under load: "Even during major global outages… Datadog continued to perform without any issues. The APM, RUM, and Synthetic Checks are exceptionally dependable, giving me the confidence to choose Datadog without hesitation" g2.com.
✅ User-friendly dashboards: "The platform is user-friendly, allowing us to easily set up various dashboards to view all the insights… Implementation is straightforward as well" g2.com.
⚠️ Expensive at scale: "The biggest drawback is cost. Datadog becomes expensive very quickly – especially when log volumes grow or when you create many custom metrics… the pricing model can be a challenge" g2.com.
⚠️ Outdated UI design: "I wish the UI had a more modern look, as it currently feels like I'm using an old inventory management system from the 2000s" g2.com.
⚠️ Challenging initial setup: "I find the setup of Datadog to be inefficient and somewhat challenging, making the initial configuration process moderately hard" g2.com.
Read also: SecDevOps vs DevSecOps - Differences, Security Models, and When to Choose
Dynatrace
G2: 4.5/5
Trial days: 15
Best for: Enterprises seeking AI-powered full-stack observability – Dynatrace automates end-to-end monitoring with AI-driven root-cause analysis across complex, dynamic environments.
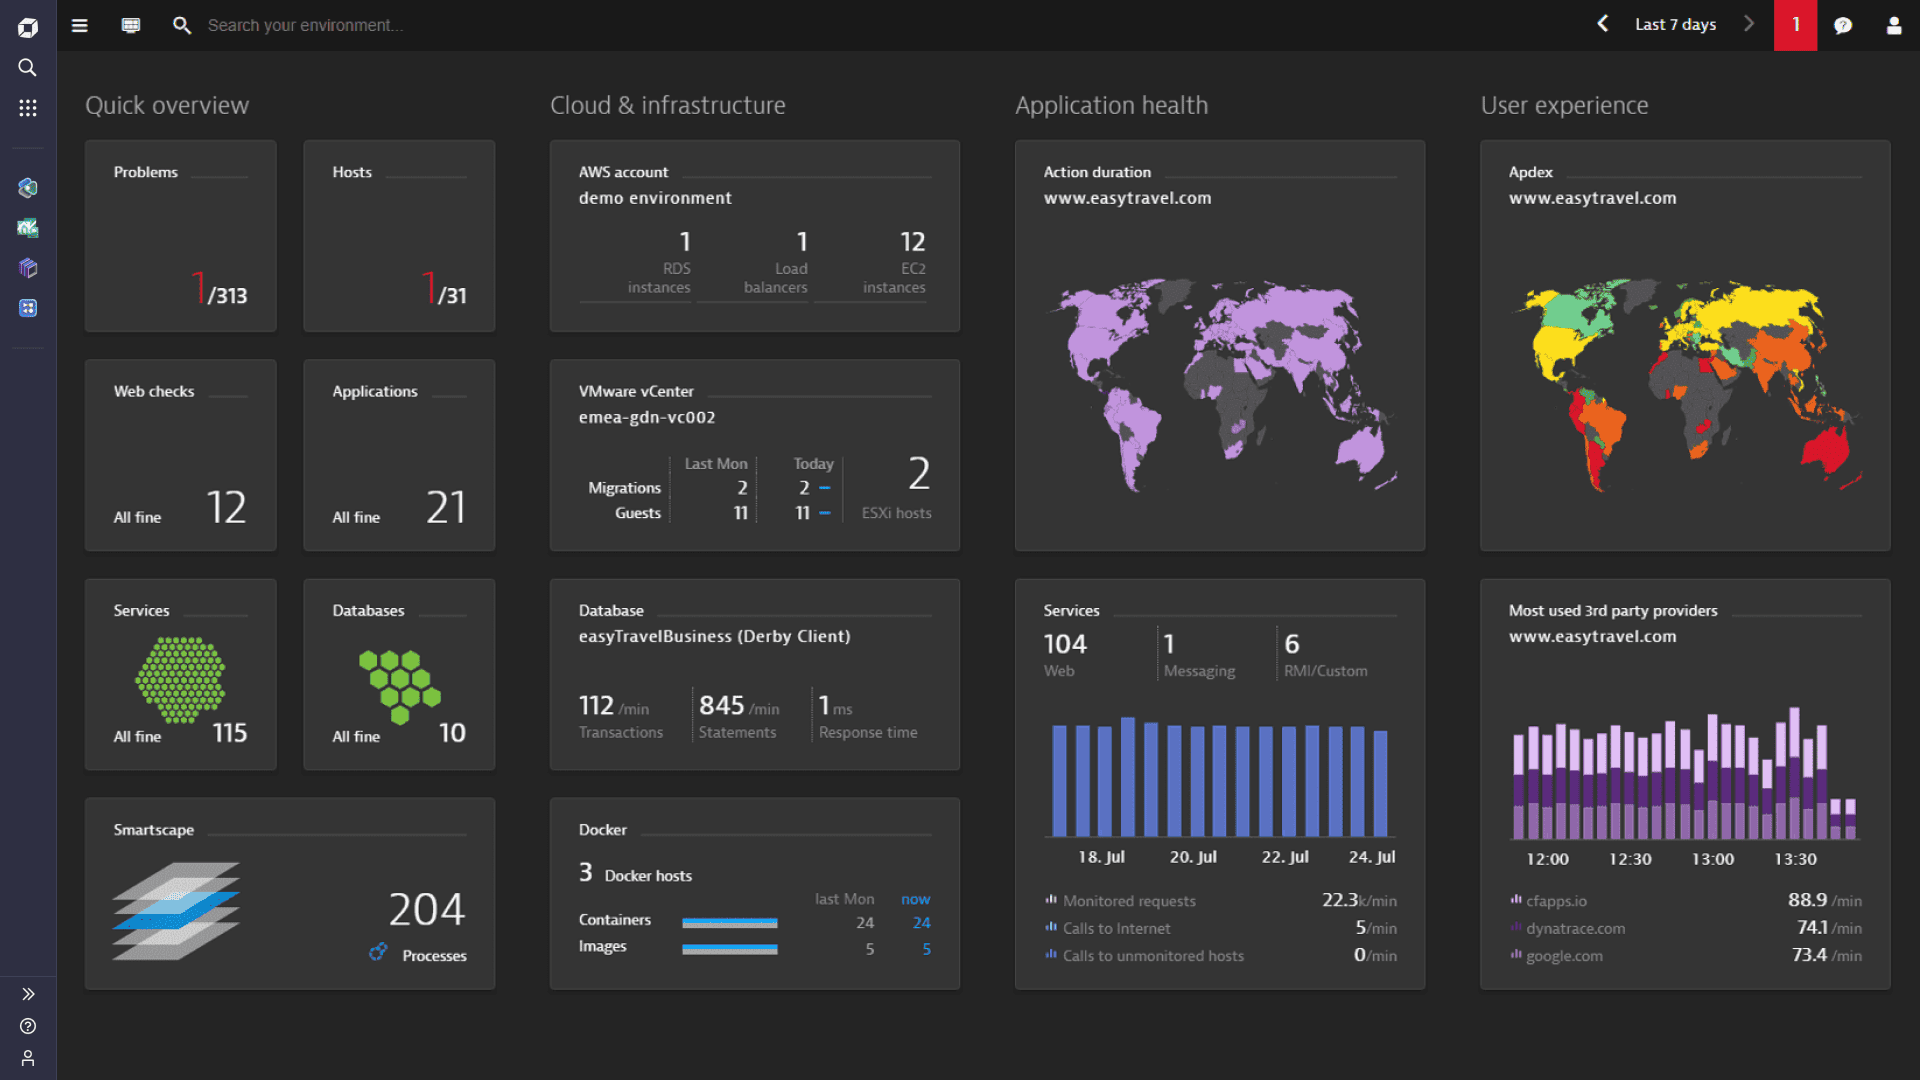
Image source.
Dynatrace is a cloud monitoring platform for teams who have outgrown “alert storms” and need causal answers that stand up in a post-incident review. Think hybrid cloud monitoring where the blast radius crosses K8s, legacy VMs, and managed services – then someone asks, “What changed?” Dynatrace is built to answer that question fast, with automated discovery and topology that behaves like a living CMDB.
Air Canada used it to keep visibility across a complex estate where issues can slip between teams. DISH leaned on Dynatrace for real-time, AI-driven root cause as microservices expanded. BMO called out major gains from Grail + AI, cutting log analysis toil and shrinking RCA time. That’s the competitive advantage: less time correlating, more time fixing.
If you’re evaluating monitoring software at scale, here’s the expert checklist Dynatrace tends to satisfy: does the topology update automatically, do alerts roll up to the service that matters, can you prove impact on user journeys, and can you query telemetry without waiting forever? It’s why Gartner has repeatedly positioned Dynatrace as a Leader in observability.
Features
- Smartscape topology: dependency mapping that stays current as services change.
- Davis AI: causal analysis to reduce noise and isolate root cause.
- Grail data lakehouse: logs/metrics/traces together for fast, contextual queries.
- Infrastructure monitoring: coverage across hosts, containers, and cloud services.
- Digital Experience Monitoring: tie user issues to backend performance and quantify impact.
- Multi-cloud monitoring: consistent visibility across providers and environments.
Pricing
Dynatrace pricing is built around what you monitor, not how many people log in. You’re buying host-hours (or GiB-hours), so 5 users barely move the needle. In 2025 pricing, you’ll see Foundation & Discovery at $7/host/month (or $0.01/host-hour) and Infrastructure Monitoring at $29/host/month (or $0.04/host-hour). Full-Stack is memory-based: $58 per 8-GiB host/month (or $0.01 per GiB-hour). Trial runs 15 days.
Now your scenario – 3 clouds, 100 servers:
- Infra monitoring: ~$2,900/month (100 × $29).
- Full-Stack (8 GiB each): ~$5,800/month (100 × $58).
The expert move? Budget by workload class. Spiky autoscaling will change your bill faster than any feature toggle.
Pros and Cons
✅ Automatic root-cause analysis: "Dynatrace’s Davis AI engine automatically pinpoints the root cause of issues, which saves huge time compared to manual troubleshooting. Dynatrace continuously monitors without gaps, so performance bottlenecks and anomalies are detected instantly" g2.com.
✅ Deep distributed tracing: "Using the tracing of requests through multiple microservices, I can find where the request is stalling or failing. It has helped me and my team get to the root of many problems without having to write custom code" g2.com.
✅ All-in-one observability: "It is a very good APM solution and can easily be leveraged as an enterprise full-stack monitoring solution" g2.com.
⚠️ Costly licensing: "Licensing can get expensive and sometimes confusing when scaling across multiple environments" g2.com.
⚠️ Complex interface: "There are so many options and so much power in the platform that users regularly get lost or confused… The good news is with a few hours of practice you learn where and how to do the work" g2.com.
⚠️ Extra effort for integrations: "Some advanced customization and integrations require extra effort or external tools" g2.com.
Read also: DevSecOps Framework in 2026. How to Choose the Right One?
SolarWinds
G2: 4.5/5
Trial days: 30
Best for: Mid-market, Windows-heavy, on-premises shops that need strong network/configuration management (NCM), asset discovery, and performance monitoring in one ecosystem.
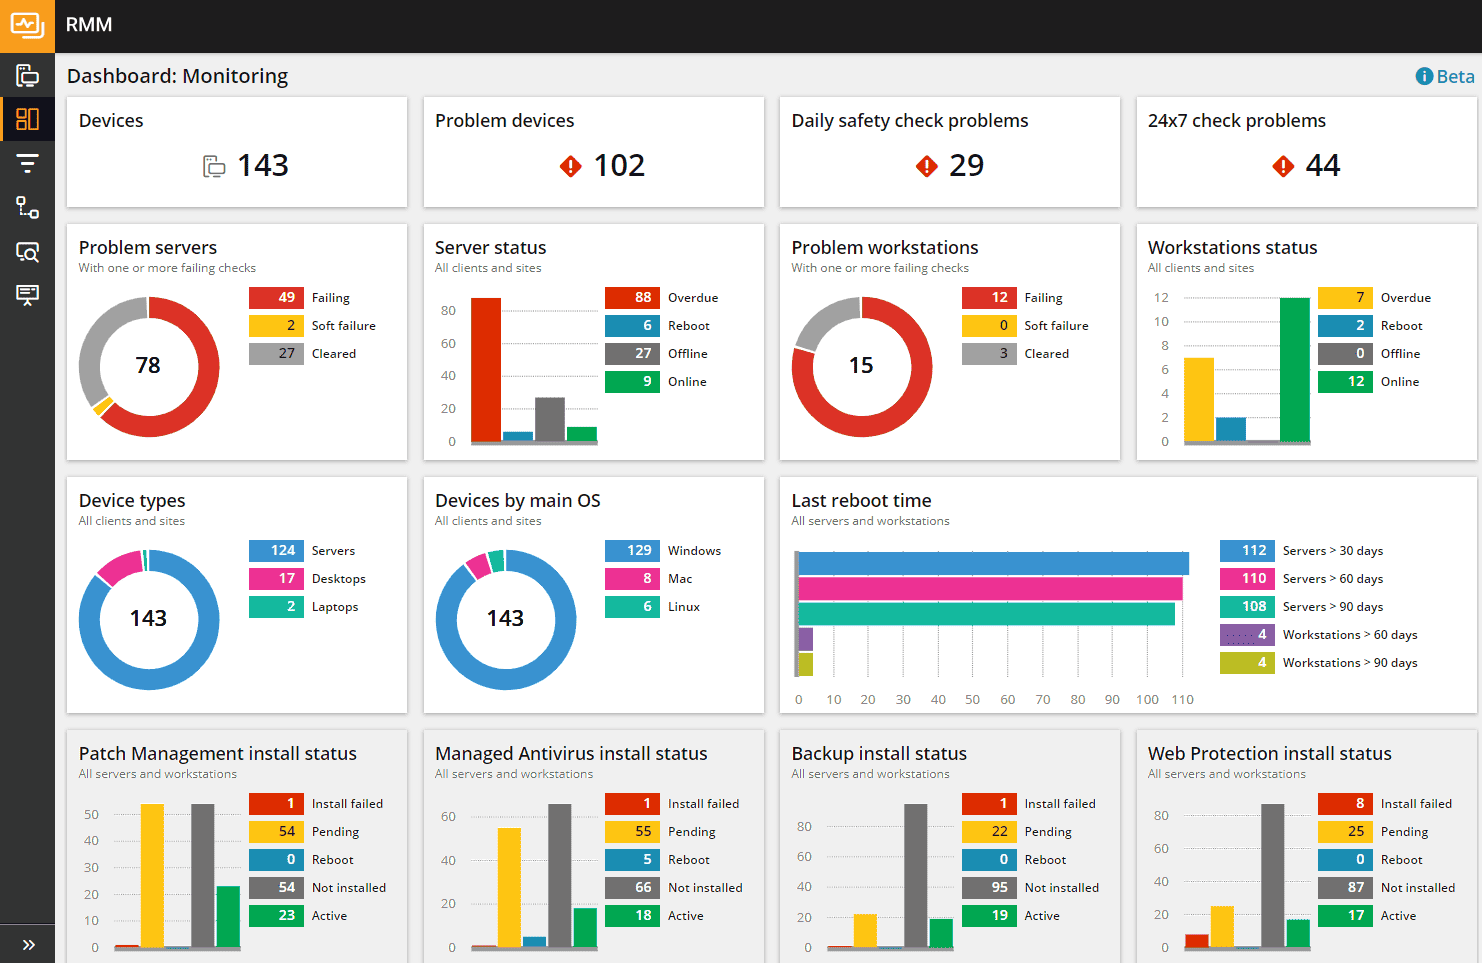 Image source.
If you’re shopping for a serious tool, here’s the SolarWinds angle in plain English: it’s built for operators who live in the “both/and” world. On-prem gear that still pays the bills. Cloud workloads that keep multiplying. SolarWinds shows up when teams want hybrid cloud monitoring without ripping out their whole playbook.
Real examples read like real life. Gaylor Electric used it while shifting into private cloud and juggling multiple sites. SHIFT leaned on it for targets, route monitoring, and trend analysis without needing a dedicated babysitter. An El Paso 911 district stacked modules (network, servers/apps, virtualization, database) to stabilize performance where outages aren’t “oops,” they’re headlines.
What makes it useful for experts? The network-first DNA. You get visibility into the stuff between systems – latency, paths, dependencies – across messy cloud environments.
Pricing
SolarWinds Observability pricing is “metered coverage.” You pay per active host/device for the base, then you bolt on depth. In 2025 numbers, Network & Infrastructure starts at $12 per active host/device/month for SaaS, and you get a 30-day full-access trial to validate it in production-like traffic.
Now run the math you care about: 3 clouds, 100 servers, 5 users → users don’t change the bill; hosts do. So you’re looking at roughly $1,200/month for core coverage (100 × $12).
Where the “final price” grows is scope. Add Application Observability at $27.50 per service/month, plus logs billed per GB and database monitoring per instance, and your total climbs fast – especially in larger cloud environments where services multiply.
Practical tip: price it by service count and log volume up front. That’s where visibility gets expensive.
Pros and Cons
✅ Automatic root-cause analysis: "Dynatrace’s Davis AI engine automatically pinpoints the root cause of issues, which saves huge time compared to manual troubleshooting. Dynatrace continuously monitors without gaps, so performance bottlenecks and anomalies are detected instantly" g2.com.
✅ Deep distributed tracing: "Using the tracing of requests through multiple microservices, I can find where the request is stalling or failing. It has helped me and my team get to the root of many problems without having to write custom code" g2.com.
✅ All-in-one observability: "It is a very good APM solution and can easily be leveraged as an enterprise full-stack monitoring solution" g2.com.
⚠️ Costly licensing: "Licensing can get expensive and sometimes confusing when scaling across multiple environments" g2.com.
⚠️ Complex interface: "There are so many options and so much power in the platform that users regularly get lost or confused… The good news is with a few hours of practice you learn where and how to do the work" g2.com.
⚠️ Extra effort for integrations: "Some advanced customization and integrations require extra effort or external tools" g2.com.
Device42
G2: 4.7/5
Trial days: 30
Best for: Hybrid and data-center-heavy organizations requiring agentless discovery (e.g. racks/IPAM) and application dependency mapping to populate or replace a CMDB.
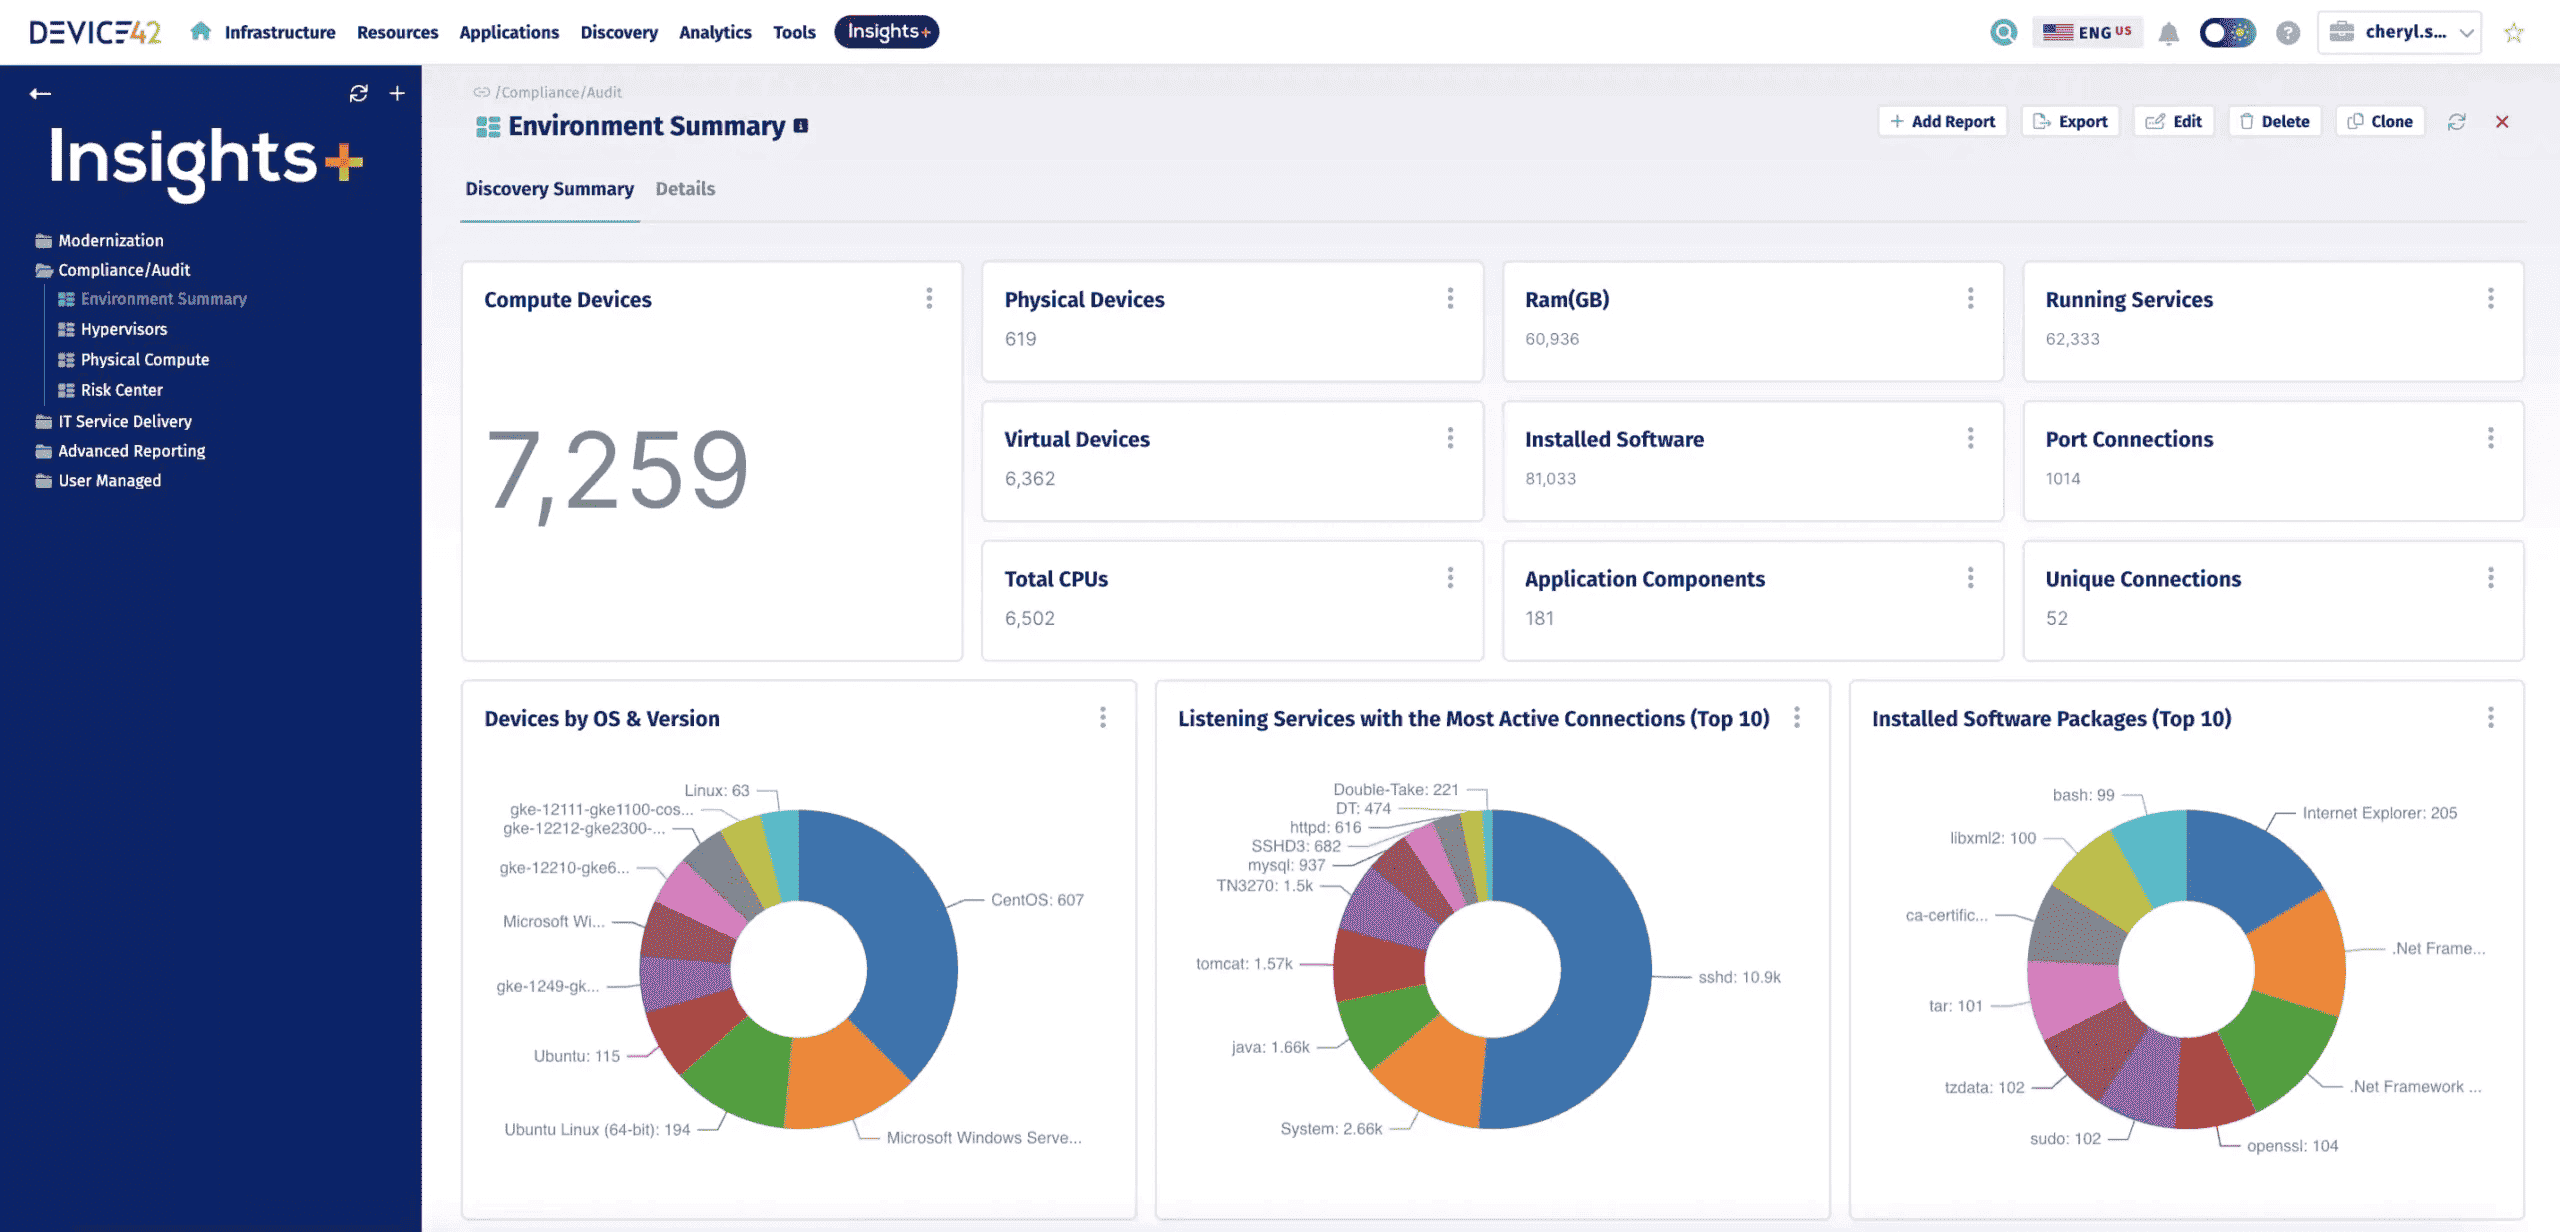 Image source.
Device42 shows up when the problem isn’t “we lack alerts.” The problem is “we don’t trust what we’re alerting on.” Shadow servers. Orphaned cloud resources. A service that changed owners three times and nobody updated the runbook. That’s why people get stuck in a cloud monitoring google loop – because the visibility layer is missing context.
Device42’s superpower is CMDB-grade truth with dependency mapping. LeasePlan used its agentless discovery and app dependency mapping to speed up an AWS replatforming. TP ICAP leaned on dependency mapping to plan consolidation with a cloud-first strategy. Imperial College London tracked “should this be monitored” and alert ownership right in the CMDB – so incidents route to the right humans.
So here’s the expert framing: Device42 isn’t your primary APM. It’s the layer that makes your monitoring software trustworthy. It sits underneath your monitoring solutions and fixes the inventory + ownership + dependency problem that breaks multi-cloud monitoring at scale.
Features
- Cloud Discovery: inventory across AWS/Azure/GCP accounts and regions.
- Application Dependency Mapping: app-to-infra relationships for impact and migrations.
- Monitoring ownership fields: “monitor yes/no” + who gets paged, tracked as CMDB data.
- Utilization context: tie performance signals back to specific assets for right-sizing.
- Agentless hybrid discovery: fast coverage across legacy servers and cloud resources.
Pricing
Device42 pricing is capacity-based, which experts usually love because it’s predictable. You’re paying for device count / license units, not seats. So your 5 users are basically a non-event.
In 2025 listings, you’ll see starter pricing around $1,449/year for up to 100 devices, with higher tiers reaching $9,999/year before things go custom. Trial runs 14 days (often capped to ~100 devices).
Now your scenario: 3 clouds, 100 servers, 5 users → you’re basically right at that entry tier: $1,449/year ($121/month) for the core CMDB/discovery layer, plus any add-ons (dependency mapping, integrations, etc.). That’s why it plays nicely underneath cloud infrastructure monitoring tools – you can budget it like inventory, then decide how much “smarts” you want on top.
Pros and Cons
✅ Automatic root-cause analysis: "Dynatrace’s Davis AI engine automatically pinpoints the root cause of issues, which saves huge time compared to manual troubleshooting. Dynatrace continuously monitors without gaps, so performance bottlenecks and anomalies are detected instantly" g2.com.
✅ Deep distributed tracing: "Using the tracing of requests through multiple microservices, I can find where the request is stalling or failing. It has helped me and my team get to the root of many problems without having to write custom code" g2.com.
✅ All-in-one observability: "It is a very good APM solution and can easily be leveraged as an enterprise full-stack monitoring solution" g2.com.
⚠️ Costly licensing: "Licensing can get expensive and sometimes confusing when scaling across multiple environments" g2.com.
⚠️ Complex interface: "There are so many options and so much power in the platform that users regularly get lost or confused… The good news is with a few hours of practice you learn where and how to do the work" g2.com.
⚠️ Extra effort for integrations: "Some advanced customization and integrations require extra effort or external tools" g2.com.
Read also: IT Asset Management Process - 6 Workflow Steps You Can’t Ignore!
ServiceNow
G2: 4.6/5
Trial days: 14
Best for: DevOps/SRE teams needing easy, cloud-native observability with deep distributed tracing – Lightstep focuses on monitoring health changes in microservice applications.
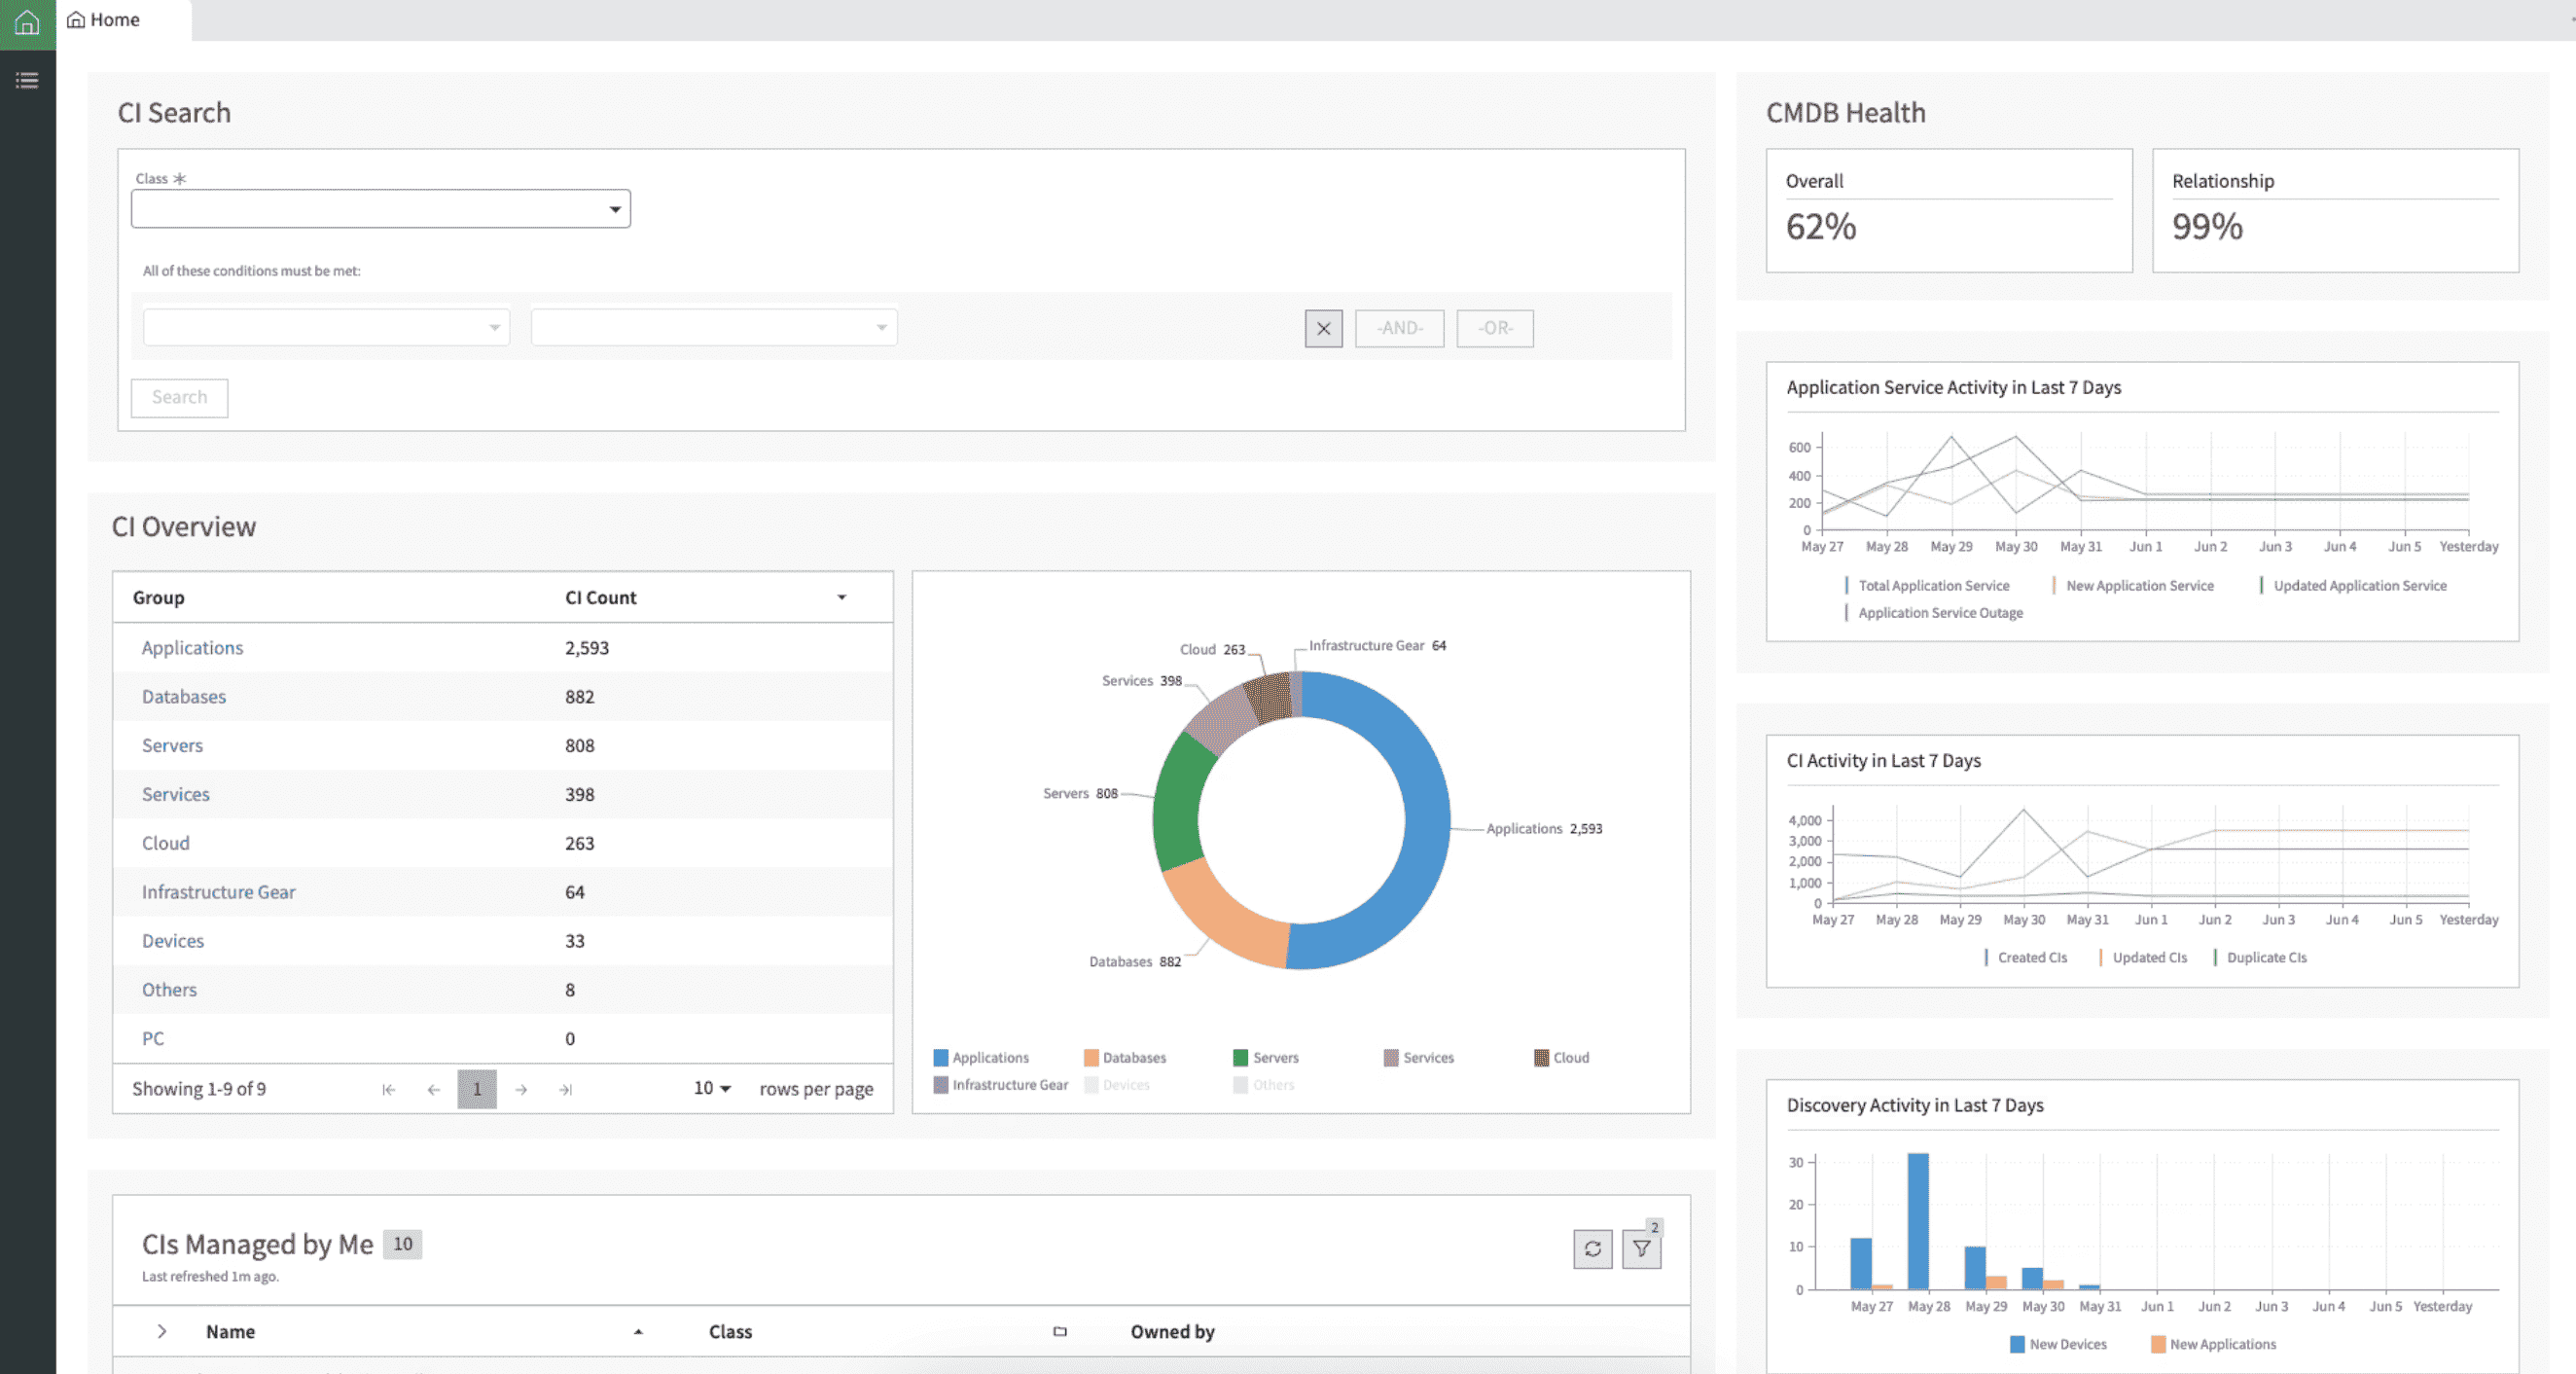 Image source.
ServiceNow makes sense on an expert shortlist when the real pain isn’t collecting signals. It’s turning signals into action across messy environments and cross-functional teams. You’ve got alerts in one tool, ownership in another, change history somewhere else, and a human trying to connect the dots at 2 a.m. ServiceNow is designed to close that loop.
GitHub used ServiceNow Cloud Observability to trace latency back to a load balancer when logs didn’t line up cleanly. Plaid called out real-time exploration of microservices with no ingestion lag. FactSet highlighted fast isolation of the backend host causing trouble even behind a load balancer. Those are the moments experts care about: “Can I find the failing dependency fast, with confidence?”
Here’s the expert framing: ServiceNow is strongest when you want infrastructure monitoring plus workflow – CMDB context, service mapping, event correlation, and incident routing that actually matches ownership. For buyers comparing cloud server monitoring tools, this is the differentiator: not the prettiest charts, but the cleanest path from alert → impacted service → accountable team → ticket with context.
Features
- ITOM Discovery + CMDB: auto-populates CIs so routing and ownership stay current.
- Service Mapping: groups telemetry by service impact, not random components.
- Event Management + AIOps: noise reduction + correlation with operational context.
- Cloud Observability tracing (Lightstep): distributed tracing for microservices and dependencies.
- Health Log Analytics: fast log search + patterns to speed investigations.
Pricing
ServiceNow pricing is “build-your-stack.” You buy core platform + the modules that match how you operate. Public pricing examples put ITSM around $90–$100 per user/month, which means 5 users is roughly $450–$500/month before you add anything else.
ITOM is where budgets swing. Costs are typically quote-based and often discussed in ranges like $30k–$80k/year, driven by discovery scope, nodes/devices, and how many environments you’re monitoring.
Trial: many ServiceNow Store apps run 30 days, which is enough to validate discovery accuracy and service mapping behavior in real estates.
For 3 clouds and ~100 servers, plan ~$30k–$80k/year for hybrid cloud monitoring, then layer seats. The reason teams pay that premium: CMDB + service maps + workflow keeps ownership clean when incidents hit.
Pros and Cons
✅ Leader in distributed tracing: "For micro-service architectures, Lightstep is the de-facto distributed tracing tool that allows DevOps teams to quickly pinpoint regressions down to a specific service" g2.com.
✅ Intuitive and insightful UI: "The user interface is very intuitive. Lightstep provides a lot of features that will help you notice a problem or suboptimal solution in production" g2.com.
✅ Deep performance visibility: "Lightstep gives me confidence in my running applications. It provides insight into what was previously a black box" g2.com.
⚠️ UI/UX needs improvement: "UX and UI are not on the same level as the feature set. There are many small improvements which can make this product much more useful" g2.com.
⚠️ Evolving feature set: "Lightstep is still new… there are many features that they are iterating and working on that I would love, like correlation analysis on traces" g2.com.
⚠️ Sluggish with large data: "They have a tremendous amount of data… I wish it were quicker though when I'm facing an issue" g2.com.
Ivanti
G2: 3.9/5
Trial days: ~30
Best for: Mid-to-large enterprises (often in regulated sectors) with distributed endpoints that want an ITIL-aligned ITSM platform with CMDB-driven automation and strong governance across devices.
 Image source.
Ivanti is the “ops glue” you reach for when cloud monitoring means more than charts – you need accurate inventory, ownership, and remediation paths across messy environments.
SAIC uses Ivanti Neurons (incl. RBVM + ITSM) to get more actionable security data and keep compliance tight across a huge estate. SouthStar Bank leans on Neurons for Discovery + Patch Management + automation so issues get fixed before end-users notice, with real-time edge intelligence for faster analysis. Agrex Brazil consolidated tools with Ivanti to gain complete real-time visibility and scale patching (7x more patches per device/month).
The competitive edge vs many cloud infrastructure monitoring tools: Ivanti keeps the CMDB context current and automates the “next step,” which is why it lands on plenty of best cloud-based monitoring tools shortlists when teams are drowning in tickets and blind spots. It’s especially handy when your cloud infrastructure changes daily.
Features
- Neurons for Discovery – builds a near real-time hardware/software inventory so you can see risk and coverage gaps fast.
- CMDB Service Mapping – maps dependencies and impact so incidents route with context.
- Neurons for Patch Management – prioritizes patching with exploit/threat context, plus automation.
- Healing + automation bots – proactive fixes before users even file tickets.
- Edge Intelligence – faster troubleshooting with visibility signals pulled from endpoints (even off-network).
Pricing
Ivanti pricing is basically three dials: analyst seats, devices, and servers. Clouds don’t matter. Scope does. Public 2025 pricing examples show analysts at £72.67/mo (entry) up to £256.58/mo (top), plus add-on meters: £2.19/device/mo (platform), £7.26/device/mo (Discovery), and £44/server/mo (Service Mapping).
Trial is 30 days.
Now your scenario – 3 clouds, 100 servers, 5 users – assume the common 200-device minimum. Base platform+discovery alone lands around ~£2.25k/month. Add service mapping for 100 servers and you jump to ~£6.65k/month.
Expert tip: price it by “how many things you’ll map,” not by how many people will log in. That’s where the real bill comes from.
Pros and Cons
✅ Automation and self-healing: "What I like best… is its strong automation and self-healing features, along with comprehensive visibility" g2.com.
✅ Unified endpoint visibility: "The user can manage multiple endpoints and bring all the devices under one umbrella which gives a better overview of the IT posture of the organization" g2.com.
✅ Detailed device insights: "Ivanti Neurons UEM… give[s] better statistics about the number of types of devices, the status of the devices… Easy to use" g2.com.
⚠️ Cluttered interface: "The user interface feels cluttered, hindering quick access to essential tools. [It’s] a little difficult to navigate through most of the features efficiently" g2.com.
⚠️ Limited dashboard customization: "Some of the nuances in Neurons, particularly around dashboards, don't offer a lot of customization at the moment" g2.com.
⚠️ Steep learning curve: "Training may be necessary for IT staff to effectively use and manage UEM solutions" g2.com.
Read also: 12 Multi Cloud Management Tools - Software Features & Pricing Review
Axonius
G2: 4.2/5
Trial days: 30
Best for: Organizations prioritizing cybersecurity asset visibility – Axonius is suited for those focusing on endpoint security and compliance across complex IT environments.
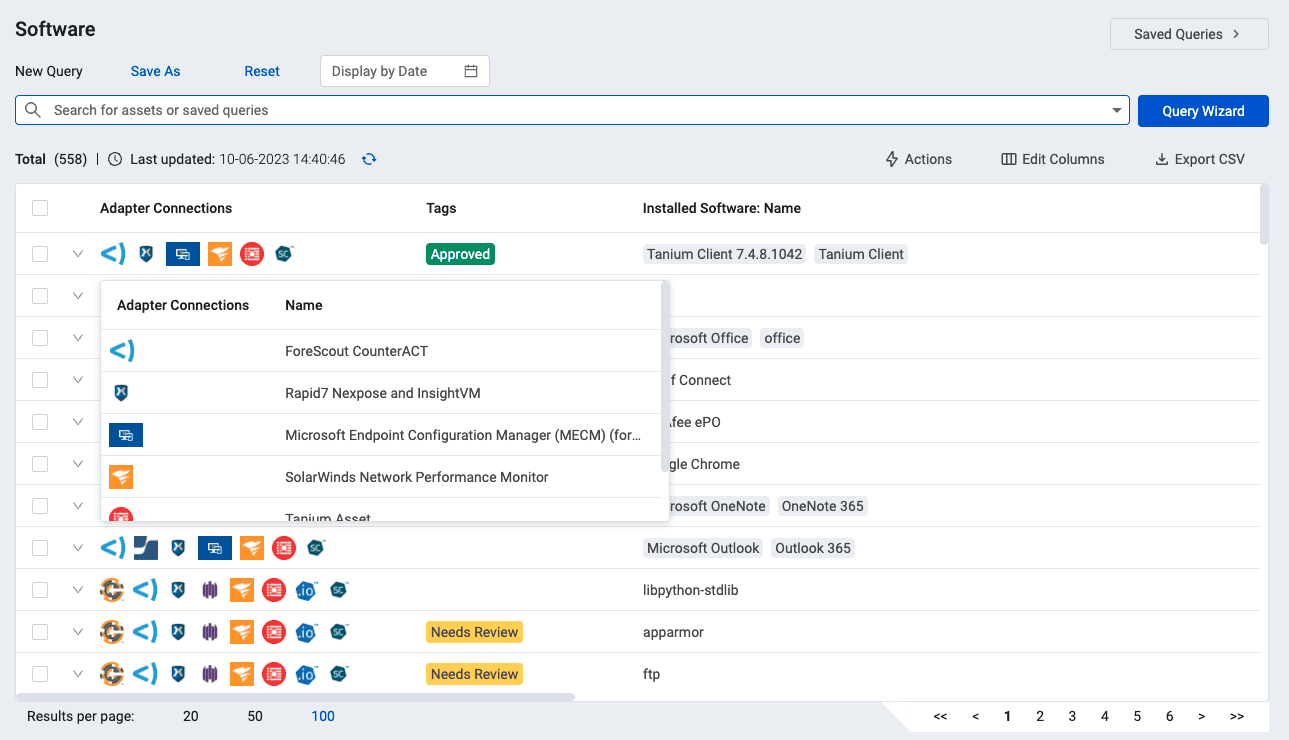 Image source.
Axonius is what you buy when the hard part isn’t dashboards – it’s asset truth. Orphaned cloud instances. Duplicate records. Tools disagreeing about what exists. That’s the stuff that breaks incident response and makes compliance a guessing game. Axonius pulls data from the systems you already run, normalizes it, deduplicates it, and gives you a master record per asset. In CMDB terms, it’s the “finally trustworthy” source of inventory.
Gigamon used Axonius to gain clearer insight into AWS assets and reduce blind spots across hybrid setups. Public references also cite enterprise customers like Schneider Electric and News Corp using it to manage devices, software, and cloud services at scale. The competitive advantage is breadth plus actionability: 1,200+ integrations and the ability to trigger workflows when an asset violates policy.
Here’s the expert takeaway: Axonius makes cloud infrastructure measurable. It keeps teams aligned across changing environments. And it feeds cleaner context into cloud application monitoring tools so alerts route to the right owner with the right metadata.
Features
- 1,200+ integrations: unify tool data into one asset view.
- Normalization + deduplication: one master record per asset.
- Coverage gaps: find unmanaged assets and missing controls.
- Automated actions: tag, ticket, quarantine, or remediate based on conditions.
- Exposure insights: highlight risky configurations and visibility gaps.
Pricing
Axonius pricing is asset-led. The meter is unique assets (servers, endpoints, cloud resources), then the bill flexes based on how many integrations and modules you turn on. Users don’t really matter here – 5 seats won’t swing cost.
Trial is 30 days, which is plenty to validate data normalization, deduping, and how fast you can close coverage gaps.
For 2025 benchmarks, Vendr lists ranges around $34,371/year (low), $60,985/year (median), and $129,249/year (high).
So your scenario – 3 clouds, 100 servers, 5 users – lands roughly $35k–$61k/year if you’re running a normal adapter set. Crank up the integrations and workflow actions, and you move toward the high end. That’s the lever experts should model when comparing cloud monitoring tools.
Pros and Cons
✅ Intelligent asset correlation: "Axonius solves the problem of overall asset visibility… Axonius correlate[s], normalize[s], validate[s], and deduplicate[s] data. By the help of correlation, you can easily identify rogue devices [and] devices with no agents" g2.com.
✅ Easy data aggregation & querying: "Software was simple to install and set up. Can aggregate data for endpoints, servers and people. It's simple to create and save queries to reconcile assets" g2.com.
✅ Unified view via integrations: "This tool brings everything together in 1 view… we can filter on information from each adapter and reconcile accordingly" g2.com.
⚠️ Dependent on integrations: "Axonius is… dependent on the number of management tools it integrates with (in the form of adapters). You should have different tools such as AD, EPP/EDR, NAC, etc. [to get the most value]" g2.com.
⚠️ No custom dashboard arrangement: "There isn’t a way to organize the metric cards. They are sorted in order of creation" g2.com.
⚠️ Not very intuitive: "Not easy of use, [and] advanced automation options are not completely optimized" g2.com.
New Relic
G2: 4.4/5
Trial days: Free tier with no time limit
Best for: Tech-driven teams (e.g. SaaS, retail, healthcare) requiring a unified SaaS observability platform – New Relic is ideal for deep application performance insights and real user monitoring at enterprise scale.
 Image source.
New Relic is the tool you reach for when you want one narrative across your telemetry – fast.
Verizon used it with Pixie to get instant observability for Kubernetes workloads at the 5G edge, where “normal” agents don’t fit. Wix rolled it out so developers could watch real user behavior with browser monitoring and spot microservice interdependencies without waiting for ops to translate graphs. Workiva consolidated multiple tools into New Relic One, then built SLO views and apps to monitor AWS + Kubernetes resources in one place.
That’s the hook for hybrid cloud monitoring: fewer tool handoffs, more shared context. If you’re comparing the best cloud-based monitoring tools, New Relic’s advantage is unified data + query power (NRQL), plus quickstarts/integrations so your teams don’t spend weeks wiring basics. Clean entity records help you keep cloud infrastructure ownership sane across shifting environments.
Features
- Infrastructure Monitoring – inventory + event/change feed for hosts and packages.
- APM + distributed tracing – trace transactions across services and dependencies.
- Browser monitoring (RUM) – tie frontend experience to backend performance signals.
- Kubernetes monitoring (Pixie option) – lightweight auto-telemetry for K8s, even at the edge.
- Alerts + SLO views – service-level health dashboards and drill-down availability checks.
- OpenTelemetry support – ingest OTel data so you’re not locked into one instrumentation path.
Pricing
New Relic pricing is two levers: who can query (billable users) and how much telemetry you ship (GB ingested). In 2025 pricing, you get 100 GB/month free, then pay $0.40/GB (or $0.60/GB with Data Plus).
On Standard, users price as $10 for the first full user + $99 for each additional (up to 5). Higher tiers list up to $549/user/month (or $658.80 PAYG). The “trial” is effectively unlimited via the free tier.
Now your scenario – 3 clouds, 100 servers, 5 users – server count doesn’t meter directly. With 5 full users, you’re around $406/month if your ingest stays under 100 GB.
Go over? Add $0.40 per extra GB and the bill scales with usage. That’s the pricing reality experts should model when comparing cloud application monitoring tools.
Pros and Cons
✅ Unified observability in one place: "What I like most about New Relic is how it brings everything I need into one place… a single dashboard that shows the full picture. It’s clean, intuitive, and the visualizations are easy to understand" g2.com.
✅ Real-time insights and alerting: "The platform provides deep insights into application performance, infrastructure health, and user experience, all in one place. I particularly appreciate its real-time monitoring and alerting, which helps teams detect and resolve issues before they impact end users" g2.com.
✅ Ease of use and integration: "New Relic stands out for its ease of use and intuitive dashboards, which make monitoring and troubleshooting straightforward even for complex applications… integrating it into our tech stack was smooth, with clear documentation and quick setup" g2.com.
⚠️ High and unpredictable costs: "It can get expensive, especially as you scale up and start monitoring more hosts… The pricing model isn’t always predictable, and sometimes small changes in usage can lead to higher bills than expected" g2.com.
⚠️ Overwhelming interface for newcomers: "The UI, while feature-rich, can feel overwhelming for new users because of the sheer number of options and data points available" g2.com.
⚠️ Costly data retention: "Data retention beyond the default period often incurs extra charges, which can be limiting for teams that need long-term historical analysis" g2.com.
Read also: 15 DevSecOps Tools - Software Features & Pricing Review
Splunk Observability Cloud
G2: 4.3/5
Trial days: 14
Best for: Large enterprises needing end-to-end visibility and AIOps across hybrid environments – Splunk excels in log management, metrics/traces analytics, and event correlation for IT operations and security.
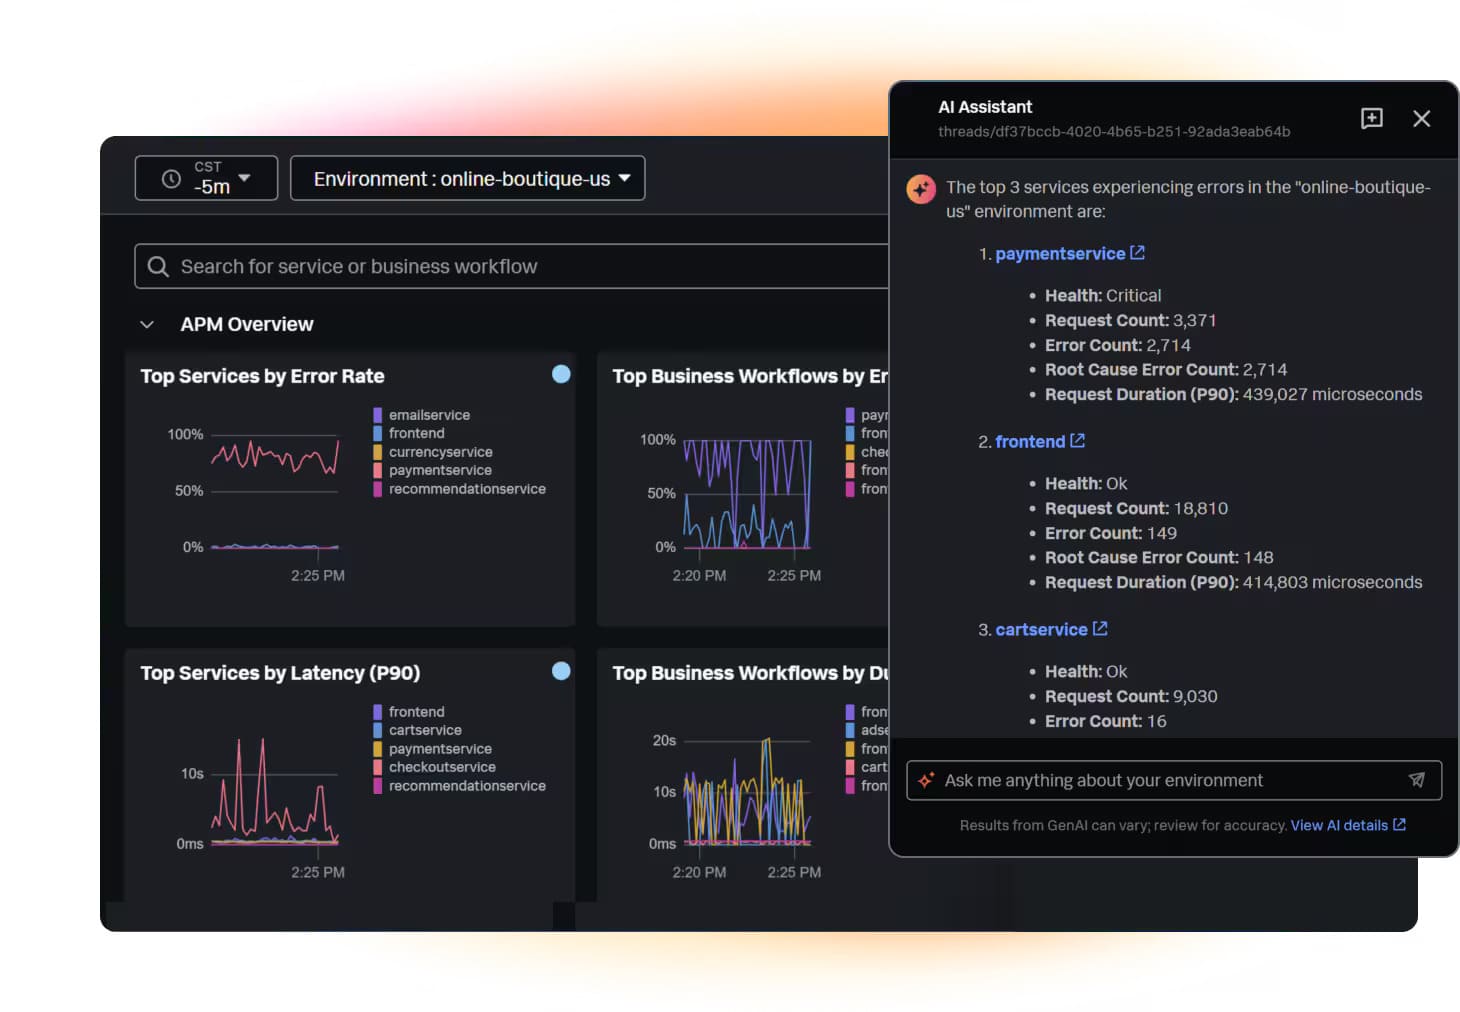 Image source.
Splunk Observability Cloud is for the days when your alerts are loud, but the answer is quiet. You get hybrid cloud monitoring that pulls metrics, logs, and traces into one story – so you can stop swiveling between tabs.
Progressive uses it for full-fidelity tracing to protect performance at massive scale. Travelport used it to cut false positives by 95% and stay ahead of uptime goals. Sansan credits it with end-to-end visibility during peak transaction periods.
The competitive edge for cloud performance monitoring tools shoppers: OpenTelemetry-native + NoSample tracing + guided RCA. Built for modern cloud environments, and grounded in your cloud infrastructure reality.
In fast-changing environments, teams get answers faster – and fewer war rooms. Plus: named a Leader in the 2025 Gartner Magic Quadrant for Observability Platforms.
Features
- Application Performance Monitoring (APM): traces and service-level views to spot the bottleneck fast.
- Infrastructure Monitoring: real-time alerts with full context across hosts and services.
- Real User Monitoring: connects frontend pain to backend cause.
- Synthetic Monitoring: proactive checks to catch issues before customers do.
- Log Observer Connect: pull “why” from Splunk logs without losing incident context.
- AI Assistant + guided troubleshooting: faster triage with directed insights.
- NoSample tracing: 100% trace collection to avoid blind spots.
Pricing
Splunk Observability Cloud is priced per host/month (annual billing), so 5 users don’t change the math. Plans start at $15/host/mo (Infrastructure) and go up to $75/host/mo (End-to-End).
Free trial: 14 days.
For 3 clouds + 100 servers: ~$1,500/mo (Infra) → ~$7,500/mo (End-to-End). For multi cloud monitoring tools, clouds don’t add cost – hosts do.
These are clean cloud monitoring solutions when you want predictable budgeting.
Pros and Cons
✅ Unified observability in one place: "What I like most about New Relic is how it brings everything I need into one place… a single dashboard that shows the full picture. It’s clean, intuitive, and the visualizations are easy to understand" g2.com.
✅ Real-time insights and alerting: "The platform provides deep insights into application performance, infrastructure health, and user experience, all in one place. I particularly appreciate its real-time monitoring and alerting, which helps teams detect and resolve issues before they impact end users" g2.com.
✅ Ease of use and integration: "New Relic stands out for its ease of use and intuitive dashboards, which make monitoring and troubleshooting straightforward even for complex applications… integrating it into our tech stack was smooth, with clear documentation and quick setup" g2.com
⚠️ High and unpredictable costs: "It can get expensive, especially as you scale up and start monitoring more hosts… The pricing model isn’t always predictable, and sometimes small changes in usage can lead to higher bills than expected" g2.com.
⚠️ Overwhelming interface for newcomers: "The UI, while feature-rich, can feel overwhelming for new users because of the sheer number of options and data points available" g2.com.
⚠️ Costly data retention: "Data retention beyond the default period often incurs extra charges, which can be limiting for teams that need long-term historical analysis" g2.com.
Flexera
G2: 4.3/5
Trial days: 30
Best for: Enterprises with highly complex hybrid IT estates – Flexera One provides comprehensive visibility, asset governance, and cloud cost optimization for organizations managing on-prem, SaaS, and multi-cloud assets.
 Image source.
Flexera is the cloud monitoring platform for the stuff that quietly murders budgets: spend, commitments, and licensing drift.
Accruent used it to slice costs down to the “why,” like spotting network egress for a specific region and pool of web servers – then banked $200K/year in savings. Northern Trust talks about using Flexera to manage SaaS and cloud assets and support migration + FinOps decisions from one place. Even Volkswagen highlights Flexera for governing assets and licenses – useful when software entitlement affects cloud bills.
Where it wins? It’s one of the few hybrid cloud monitoring tools that treats AWS/Azure/GCP plus licenses as one ledger for your cloud infrastructure. You get clean allocation, better cost performance, and fewer “who owns this?” fights across infrastructure. This is cloud monitoring for finance-grade reporting, not pager noise.
Features
- Cloud cost allocation (billing centers) – showback/chargeback by app, team, tag, or account.
- Rightsizing + waste detection – flags idle/oversized resources with savings estimates.
- Commitment management – tracks RI/SP-style commitments and savings impact over time.
- Multi-cloud spend visibility – one view across providers for faster variance detection.
- Governance + policy alerts – rules for tag hygiene, budget thresholds, and optimization actions.
- License + SaaS optimization tie-in – connects entitlements to real cloud usage decisions.
Pricing
Flexera pricing is basically “how much are you managing?” You pay per node (server/VM/switch), and the bill climbs with node count and modules. Starting point: $1,499/year for up to 100 nodes, plus a 30-day free trial.
For your setup – 3 clouds, 100 servers, 5 users – that’s roughly $1,499/year (~$125/mo) since users don’t drive price.
At the enterprise end (cloud-spend contracts), public examples cite ~$50,000/year for managing up to $1M in cloud spend.
Pros and Cons
✅ Unified observability in one place: "What I like most about New Relic is how it brings everything I need into one place… a single dashboard that shows the full picture. It’s clean, intuitive, and the visualizations are easy to understand" g2.com.
✅ Real-time insights and alerting: "The platform provides deep insights into application performance, infrastructure health, and user experience, all in one place. I particularly appreciate its real-time monitoring and alerting, which helps teams detect and resolve issues before they impact end users" g2.com.
✅ Ease of use and integration: "New Relic stands out for its ease of use and intuitive dashboards, which make monitoring and troubleshooting straightforward even for complex applications… integrating it into our tech stack was smooth, with clear documentation and quick setup" g2.com.
⚠️ High and unpredictable costs: "It can get expensive, especially as you scale up and start monitoring more hosts… The pricing model isn’t always predictable, and sometimes small changes in usage can lead to higher bills than expected" g2.com.
⚠️ Overwhelming interface for newcomers: "The UI, while feature-rich, can feel overwhelming for new users because of the sheer number of options and data points available" g2.com.
⚠️ Costly data retention: "Data retention beyond the default period often incurs extra charges, which can be limiting for teams that need long-term historical analysis" g2.com.
Read also: 13 CMDB Tools. Choose the Best Configuration Management Database
OpenText
G2: 4/5
Trial days: 60
Best for: Large enterprises with complex hybrid infrastructure requiring AI-driven operations – OpsBridge (formerly Micro Focus) automatically monitors health across all environments and uses machine-learning for event noise reduction and automated remediation.
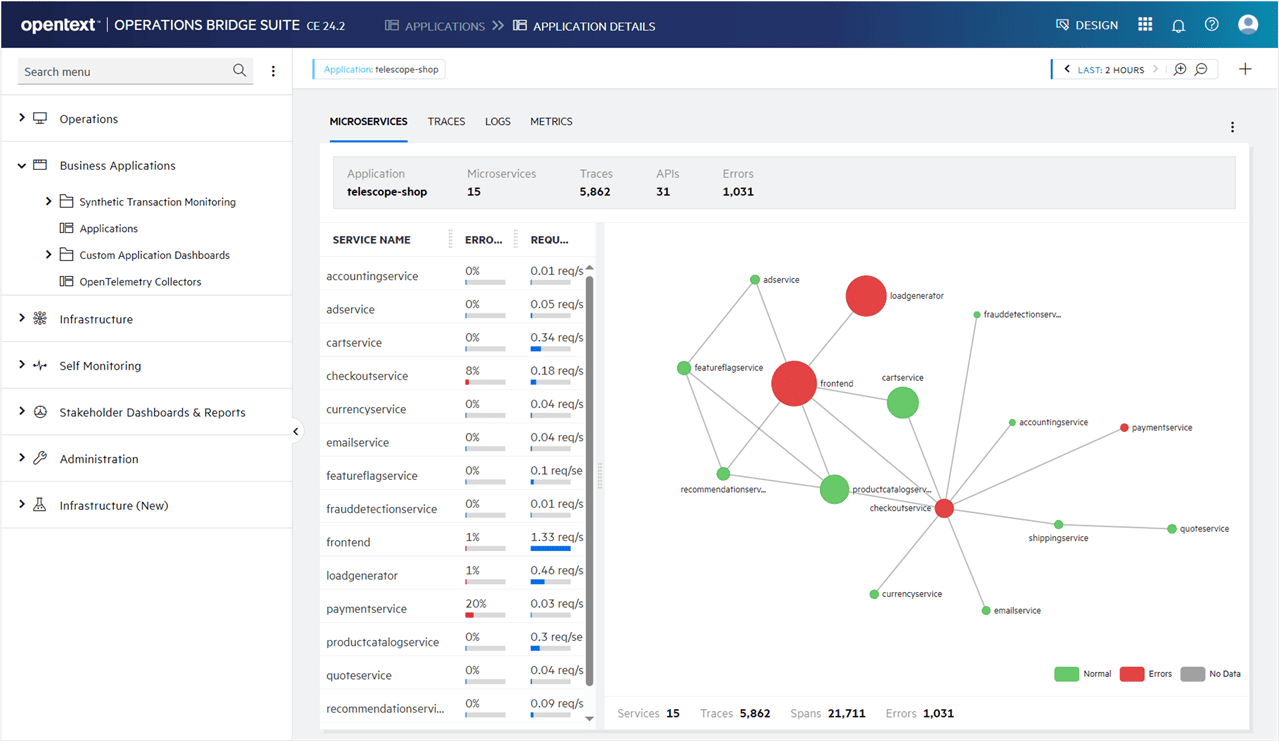 Image source.
OpenText (Operations Bridge / AI Operations Management) is what you pick when your monitoring problem is “too many tools, too many alarms, not enough answers.”
Vodafone Shared Services used it to cut noise hard – 70% alarm reduction – and speed RCA from hours to minutes. Türk Telekom paired OpsBridge with Universal Discovery + Universal CMDB, centralized server data, and built dashboards from 41 data sources while watching anomalies across ~200 apps. HPE IT used Operations Bridge Analytics to unify siloed ops data and pinpoint root cause 72x faster (30 minutes vs. 36 hours).
Where it shines: topology-aware correlation + a data lake approach that helps hybrid cloud monitoring tools buyers reduce event chaos without ripping out everything. Your cloud infrastructure gets mapped to services, so incidents land with context. That’s why it shows up on best cloud based monitoring tools shortlists for big, messy estates.
Features
- Automatic Event Correlation (AEC): groups related alerts and suggests probable root cause using ML.
- Universal Discovery + Universal CMDB: discovers resources and relationships for service-level context.
- Tool integrations: ingest events/metrics/topology from lots of third-party systems.
- AIOps analytics + dashboards: search, visual analytics, guided troubleshooting for ops data.
- Automated remediation hooks: trigger workflows/tickets once patterns are recognized.
Pricing
Bestie, OpsBridge bills per “unit” (roughly an OS instance) plus add-ons – clean cloud monitoring solutions math.
Base cloud monitoring: $10/unit/mo (Premium) or $12 OT Cloud; trial is 60 days.
For 100 servers, infrastructure cost ≈ £734/mo (3 clouds + 5 users don’t change it). Add Analytics ($6/unit) + Reporting ($46/unit) + Integration Hub ($957/mo) for heavier network intake.
That pushes you to $2.919,70/mo and buys faster performance triage.
Pros and Cons
✅ AI-driven root cause analysis: "By using machine learning and analytics it provides faster resolution by reducing critical events and also helps to find out the root cause… which I like the best" g2.com.
✅ Unified monitoring across tools: "With Micro Focus OMi, you can integrate all Micro Focus products… you can monitor all alerts on the same screen [in OpsBridge]" g2.com.
✅ Time-saving automation: "It provides automated solutions using machine learning & analytics… It helps to find a root cause behind a problem, provides the best solution idea for it as well. It really saves a lot of time" g2.com.
⚠️ Lacks open-source integration: "Their approach towards integration with open source is still not there" g2.com.
⚠️ High pricing: "Applications which they are selling currently are at high market price as compared to others" g2.com.
⚠️ Poor support quality: "The product is good but support is really bad… If you open a case, no one [provides] a good solution. The support engineers only want the logs and cannot do anything" g2.com.
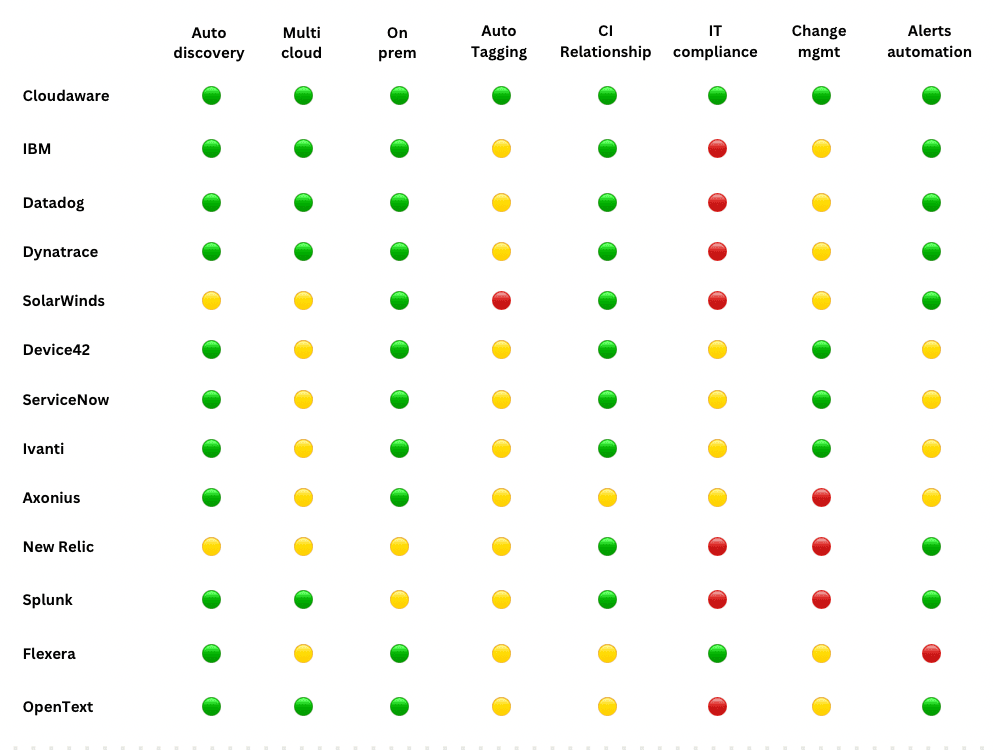
Let’s summarize: 13 cloud monitoring tools comparison
If you want quick answers, here’s the summary snapshot of this cloud monitoring tools list – a fast “yes/no/limited” grid against the must-have checklist for modern cloud infrastructure. Use it as your shortlisting cheat sheet before you dive into the full reviews of these cloud monitoring tools.
Legend: 🟢 Available 🟡 Limited / add-on / depends on edition 🔴 Not a core capability
Too many options?
How to choose the best cloud monitoring solutions
Most cloud monitoring tools look amazing in a demo. Clean dashboards. Perfect graphs. Zero chaos. Then you connect your real estate – three clouds, a Kubernetes cluster that never sits still, some legacy VMs you can’t kill and suddenly the tool either becomes your best teammate… or your loudest distraction.
So when you’re testing, don’t “click around.” Run it like an incident.
- Multi-cloud + hybrid coverage, in one view. You need AWS, Azure, GCP, Kubernetes, and on-prem to show up without duct tape. Because the outage won’t politely stay inside one provider. If you can’t see the full blast radius, you’ll chase symptoms, not causes.
- Data collection that’s fast and safe. Agent where you need depth. Agentless where you need speed. Least-privilege access, clear throttling behavior, and retention that doesn’t surprise you later. If onboarding requires heroics, the tool won’t scale.
- Metrics + logs + traces, in one workflow. Full-stack visibility matters because real incidents are cross-layer. Latency spike? You want to pivot from a service chart to a trace, then to the log line that proves it – without exporting anything or opening a second product.
- Automatic topology and “related items”. This is your CMDB reality check. When you touch a load balancer, what breaks? Which services depend on that database? If the tool can’t answer dependency questions, change becomes roulette.
- Real-time alerting with noise control. Alerts should behave like a senior engineer. Dedupe storms. Suppress known maintenance. Detect anomalies without waking you up for normal seasonality. If the tool can’t control noise, it becomes noise.
- Routing and workflows that match ownership. Slack, PagerDuty, Jira, ServiceNow – sure. But the real test is whether alerts land with context: service owner, runbook link, escalation path, and the last change that touched the system. That’s how minutes disappear from MTTR.
- Dashboards. NOC needs a traffic-light view. SRE needs heatmaps and golden signals. Execs need trends and risk. If everything looks the same to everyone, adoption dies quietly.
- Tags and labels you can trust. A good tool helps you filter, group, allocate ownership, and flag missing tags before they become billing or incident drama.
- Change awareness. Deploy markers, config drift, and “what changed?” answers should be native. Because every serious incident has a timeline – and your tool should build that timeline for you.
- Security and compliance basics. RBAC, audit trails, encryption, data residency controls. Non-negotiable. Monitoring often becomes a system of record in audits, postmortems, and customer escalations.
- APIs and integrations that don’t trap your data. You’ll want to export, automate, and connect to cloud-native sources like CloudWatch and Azure Monitor. If data can’t move, your monitoring strategy can’t evolve.