


DevSecOps metrics are how you prove success in 2026: faster delivery, bounded risk, and evidence on demand. A DevSecOps dashboard should spotlight outcome metrics, not vanity outputs. Scan count can go up while your exposure window stays the same. More alerts can mean noisier tooling, not fewer security vulnerabilities.
In addition to a list of metrics in this article, you’ll find answers to:
- What’s your real release speed when you measure delivery performance and stability per service and per environment?
- Which signals separate security metrics vs KPIs for application security without turning CI/CD into paperwork?
- If an auditor asked tomorrow, how fast could you pull evidence collection that actually holds up?
TL;DR
If you’re serious about measuring DevSecOps success, you need a scoreboard that covers flow, risk, cloud reality, and governance. Not a list of tool outputs.
- Flow: track the DORA metrics, aka the Four Keys. Deployment frequency tells you if shipping is routine. Lead time shows where work gets stuck. Change failure rate keeps speed honest. Time to restore service proves resilience when things break.
- Risk reduction: measure vulnerability MTTD, then mean time to remediate vulnerabilities, plus time to patch for critical issues. Detection is awareness. Remediation and patching are risks actually going down in production.
- Cloud reality: watch configuration drift, misconfiguration MTTD/MTTR, and policy compliance over time. Snapshots lie. Trends tell you if controls hold after deployment.
- Governance that scales: ratio of automated vs. manual approvals. If approvals live in meetings, your process doesn’t scale. If they live by rules and evidence, it does.
Next, we zoom into the delivery layer and make these numbers usable per service and environment 👇
Delivery performance DevSecOps KPIs
Delivery performance keep your DevSecOps metrics honest, because they measure what the business actually feels. Shipping “more” is meaningless if deploys are fragile, recovery is slow, or releases pile up behind manual gates. Track these numbers per service and per environment, otherwise one noisy app can hide a stable platform, and a calm dashboard can hide a burning production lane.
When leadership asks, “Are we faster now?” this is where you answer with proof, not vibes.
When security asks, “Did controls slow delivery?” this is where you show the tradeoff, or show that there isn’t one.
Now let’s zoom in on the metric that exposes bottlenecks you can fix this week, not next quarter.
Deployment frequency
Deployment frequency is your release frequency to production. In plain terms, it answers one question: how often do you ship working code into real user traffic? It’s one of those DevSecOps metrics that looks simple until you try to make it comparable across teams.
How to calculate it:
Pick a window, then count production deploys that actually reach production.
Formula: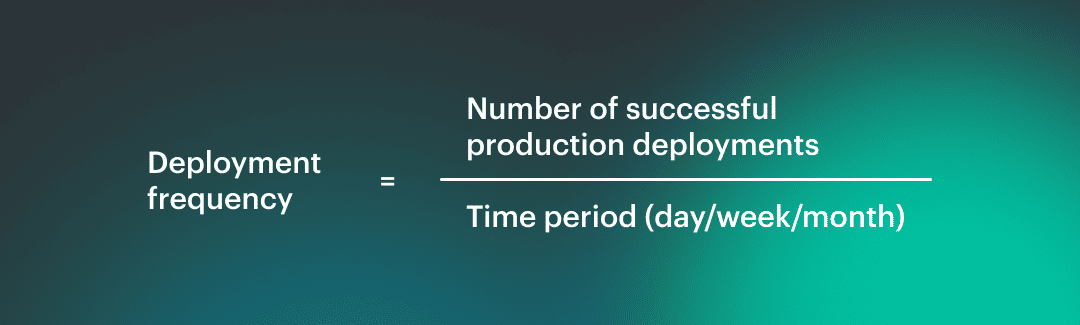 Source of truth: CI/CD logs or deployment events, not “merge to main”.
That gives you your raw CI/CD throughput.
Why does it lie when taken alone?
High deployment frequency can mean healthy delivery. It can also mean you’re shipping tiny changes because bigger ones are too risky. Low frequency can signal bottlenecks, or it can mean you run a stable platform with deliberate releases. Without context, it’s just a number.
Add security gates, rollback rates, and recovery time, then the metric starts telling the truth.
What to segment by
Don’t average the whole org. Slice it:
- Service tier: customer facing Tier 0 vs internal tooling
- Environment: prod vs non-prod, plus region if you deploy globally. This is where DevOps teams stop arguing about whose pipeline is “slow” and start seeing where the constraint actually sits.
A Cloudaware DevOps expert put it like this:
Lead time for changes
Lead time for changes is the pace of trust. Not how fast you write code, but how fast the organization can turn a real change into a real outcome without panicking. For this article, we’ll define change lead time as commit to production. One clock, one finish line, no arguing about what “done” means.
Here’s how you measure it in practice 👇
Take the timestamp of the first commit that ends up in a release, and subtract it from the timestamp when that release is successfully deployed to prod. Do it per service and per environment.
Then break it into components so the number becomes actionable: pull request time plus pipeline duration plus any waiting time in between. That’s your cycle time with receipts, and it’s one of the few DevSecOps KPIs that instantly exposes where work goes to nap.
Security gates can distort this metric in two ways.
- First, they add latency you can see, like a manual approval that sits for 36 hours.
- Second, they add latency you don’t notice, like teams splitting work into micro-commits to avoid slow scans, which looks “faster” while increasing coordination overhead.
You end up measuring the team’s coping strategy, not the delivery system.
Healthy friction is different. It’s when gates are predictable, automated, and proportional to risk. A low-risk change clears fast. A high-risk change gets challenged early, not at the end, and the feedback is specific enough to fix without a week of back-and-forth. Lead time goes down even with security present because uncertainty goes down.
Now the uncomfortable question. When your lead time improves, are you actually delivering safer, or just moving failure downstream? That’s exactly what the next metric will tell you. 👇
Change failure rate
Change failure rate is the reality check that keeps your other DevSecOps metrics from turning into a victory lap. You shipped. Great. Did you have to undo it?
Treat a change as failed if it triggers any of these within a defined window, usually 24 hours in prod:
- Rollback or roll-forward that reverts the release (your rollback rate.)
- Urgent patch to stabilize production (your hotfix rate.)
- Deployment marked as unsuccessful in CI/CD, when it actually reached prod and had to be corrected (a subset of failed deployments.)
Pick the window and stick to it. The goal is consistency, not perfection.
How to track the cause without turning it into a blame game
You’ll want two tags on every failure record, even if you start simple:
- Functional failure: bugs, regressions, performance drops, broken integrations
- Security-caused failure: a release that must be reverted or patched because a security control triggered late, a policy breach was discovered post-deploy, or an emergency fix was required to reduce exposure
This isn’t about finger-pointing. It’s about deciding whether the problem is product quality, pipeline quality, or security feedback arriving too late.
The bypass trap
Bypass paths feel like speed. They are debt with interest. Every time someone skips a scan, merges without review, or disables a gate “just this once,” the change looks successful today. Later it returns as a production rollback, a weekend hotfix, or a compliance cleanup that blocks the next release. The metric worsens, but it worsens on a delay, which is why teams deny the connection.
A Cloudaware DevSecOps expert sums up the benchmark mindset like this:
One more step before we move on. Change failure rate tells you how often you fall. It doesn’t tell you how quickly you get back up, and that’s the difference between an annoying blip and a career-limiting outage.
Read also: What Is DevSecOps - DevSecOps Definition, Security, and Methodology
Time to restore service (MTTR)
When you’re measuring DevSecOps success, MTTR is the metric that proves resilience is real, not a slide. It answers the question everyone secretly cares about after a bad release: how long were users stuck in the blast radius?
First, define the clock. Restore time is not the same as time to mitigation. Mitigation is “we stopped the bleeding” like disabling a feature flag or throttling traffic. Restore is “service is back to agreed normal” which means your SLO is met again, error rates are stable, and the fix is durable enough that you are not babysitting it every 10 minutes. Pick that definition upfront or you’ll celebrate too early.
Then decide what you’re restoring from. Track general incident recovery time, and also keep a tight lens on release-driven pain: failed deployment recovery time and rollback time. Those slices tell you whether your pipeline is producing predictable change or surprise.
Here’s why MTTR is mostly a traceability problem. If you can’t quickly answer what changed, where it runs, who owns it, and what dependencies it touches, recovery becomes guesswork. The best responders look fast because their system is legible.
A Cloudaware DevOps expert frames the benchmark like this:
Now we pivot from getting service back to reducing the risk that caused the fire in the first place.
Read also: DevSecOps Statistics (2026) - Market, Adoption, and AI Trends
Security remediation metrics
Security remediation metrics are the part of your scoreboard that separates “we found issues” from “we reduced risk.” Alerts are cheap. Risk isn’t.
These DevSecOps KPIs tell you how long critical exposure stays open, whether fixes actually reach production, and which teams or services keep accumulating the same debt. Slice them by service tier and environment so a safe dev sandbox doesn’t mask a messy prod reality, and so security work stops being a vague backlog and starts being measurable delivery.
Now for the metric that sets the whole clock in motion. If you can’t detect fast, you can’t remediate fast, no matter how good your team is.
Vulnerability mean time to detect (MTTD)
Lead time tells you how fast change moves. Vulnerability MTTD is the DevSecOps metric that tells you how long risk sits in the dark. That gap is your real problem, not the number of findings.
Pick the clock you mean. Detection time has two common definitions, and mixing them ruins the metric.
- Introduced → found: when the vulnerable component/config first appears in your estate, then the first time a tool flags it. This shows your real blind spot.
- Published → flagged: when a CVE is public, then the first time you detect you’re exposed. This shows your external reaction speed.
Now scope it, or you’ll measure noise. Time to detect vulnerabilities should be tracked separately for:
- Code (SAST/SCA in PR and build)
- Image (container image scanning in registry and pipeline)
- Runtime (what’s actually running in prod right now)
Here’s the uncomfortable truth. Security detection metrics without routing are theater. If the finding can’t land on an owner with a service name, environment, and severity context, it becomes an inbox artifact. Your exposure window stays open, just with nicer charts.
How this shows up in Cloudaware dashboards, in practice:
- Findings are tied to the asset record (account, service/app, environment, tags), so “detected” is measured at the moment the issue is first observed against a specific owned asset.
- MTTD is visualized as a trend over time and sliced by service tier, env, and severity, so averages don’t hide the ugly parts.
- The dashboard naturally highlights “unknown owner / missing context” items, because an unowned asset is where detection goes to die.
Once you can detect fast and route cleanly, the next question becomes painfully obvious. How long does it take to actually fix? 👇
Read also: DevSecOps vs Agile - How Agile DevSecOps Works Across the SDLC
Vulnerability mean time to remediate (MTTR)
MTTD tells you when you noticed the fire. MTTR tells you when it stopped being a fire. This is one of those DevSecOps KPIs that forces honesty, because “we fixed it in Jira” is not the same thing as “users are no longer exposed.”
Start with severity, or the metric becomes meaningless. Remediation SLAs need tiers. A simple model most teams can live with looks like this:
- Critical: days, not weeks.
- High: measured in weeks.
- Medium/Low: managed as backlog with aging buckets so it doesn’t turn into permanent security debt.
Now pick which finish line you measure. You actually need two clocks:
- Time to fix: detection timestamp → code/config change merged (the engineering speed)
- Time to deploy fix: detection timestamp → fix running in production (the risk reduction)
The second one is what leadership cares about, because that’s your real vulnerability remediation time. The first one is what helps you debug the process, because it shows whether the bottleneck is engineering or delivery.
You’ll also need a grown-up way to handle reality. Not every finding gets fixed immediately. Track exceptions as explicit records with an expiry date and a reason, like “compensating control in place” or “vendor patch pending.” No expiry date means you just renamed the backlog.
A Cloudaware DevOps expert describes the benchmark mindset like this:
“Good MTTR isn’t a heroic sprint. It’s a predictable slope. Critical exposure shrinks fast in prod, then the curve flattens for lower severities. If the curve doesn’t slope down, you’re not remediating; you’re collecting.”
And once you have MTTR under control, the next question gets sharper. Some risks cannot be remediated when possible. Some say, “patch now or explain yourself.” 👇
Time to patch
Time to patch is the metric you pull out when “we’ll remediate it in the next sprint” is no longer an acceptable sentence. For measuring DevSecOps success, it’s the clearest signal that the org can respond to real-world risk without freezing delivery.
Definition you can defend: from identified → patched in prod. Not merged. Not “ticket created.” Patched and running where the exposure actually exists. That’s why this differs from generic MTTR. MTTR can include refactors, compensating design changes, or longer remediation plans. Time to patch is for the cases where there’s a known fix and the clock is the threat model.
Track it as patch latency with severity filters. You’ll want a tight slice for your worst days, usually “critical vulnerabilities on Tier 0 services in production.” That number is your critical vulnerability patch time. It’s also the one that gets discussed in board meetings, audits, and postmortems.
Reality check though. Sometimes the patch can’t ship today. Dependencies break, vendors delay, uptime windows are locked. This is where compensating controls save you from pretending. You keep the “patched in prod” clock running, but you also record a risk-reduction milestone: feature flag off, WAF rule added, network path restricted, vulnerable component isolated. Risk goes down even if a patch is pending, and the metric stays honest.
A Cloudaware DevOps expert says it best:
Next, we zoom out from the speed of one fix to the shape of your backlog. If time to patch is the sprint, the next metric is the gravity. 👇
Read also: 6 Core DevSecOps Automation Stages Across CI/CD
Open critical vulnerabilities
This is the backlog metric that doesn’t care how good your slide deck is. Open critical vulns are your security debt with a severity label, and they quietly tax every release until you pay them down.
Don’t treat it as a single number. Use trendlines first. Are you burning down faster than you’re creating. That’s the only “win” that matters. Then add an aging report, because totals lie without time. A flat count can hide a worsening reality if items are aging in place.
Here’s the bucket view that actually changes behavior:
- 0-7 days: normal operational churn
- 8-30 days: risk is becoming a habit
- 31-90 days: you’re accumulating a vulnerability backlog
- 90+ days: this is institutionalized exposure, not an oversight
Now the part most teams skip. Slice by ownership and environment. One critical in a prod Tier 0 service is not the same as five in a dev sandbox. Cloudaware makes this practical because the same record can show who owns the asset, where it runs, and what tags define its tier, so “everybody’s problem” becomes a named team with a due date.
This is where DevSecOps reports transition from status updates to steering. You can only manage what you can segment, and these are the DevSecOps KPIs that expose whether you’re improving or just busy.
Next we shift from backlog outcomes to the system that creates them. 👇
Read also: Six pillars of DevSecOps - Practical Guide to Their Implementation in a Pipeline
Control maturity KPIs
Governance KPIs address the uncomfortable question that often goes unspoken when measuring DevSecOps success. Are your controls running like software or like a calendar invite? Automation is what turns security from “please review” into a predictable system, because it reduces waiting, removes human variance, and keeps evidence consistent across teams.
Track how often checks run automatically, how many approvals are exception-only, and how much review time is spent on real risk instead of repeat decisions. When these metrics move in the right direction, delivery speeds up without trading away control.
Next, we zoom back into the flow metric, feeling the impact of governance immediately. 👇
Automated security test coverage
“Coverage” sounds comforting until you ask, coverage of what, exactly? For this metric, define it as the share of repos or services that run the right automated checks on every meaningful change, not once a quarter when somebody remembers. That definition keeps your DevSecOps metrics grounded in reality because it ties security to delivery, not to good intentions.
Here’s what counts as coverage in a modern pipeline:
- SAST coverage for code-level issues on PRs and main builds.
- SCA coverage for vulnerable dependencies, including transitive packages.
- Secrets detection so credentials do not become a release artifact.
- IaC scanning for Terraform, CloudFormation, Kubernetes manifests before they hit an environment.
- Container image scanning at build time and in the registry.
- Kubernetes posture checks for what actually runs, not what the repo claims it runs.
If you do DAST, call it out separately as DAST coverage, because it behaves differently and usually runs on schedules, not per commit.
Measure it by repo or service, then roll it up by tier. One Tier 0 service without checks is a bigger risk than ten small internal tools without them. Your DevSecOps reports should show the gaps as a short list you can assign, not a feel-good percentage.
The common trap is obvious once you’ve seen it. Teams hit “100% coverage” by automating low-value checks that never fail, while the highest-risk paths stay untested or run too late to matter. You get green pipelines and a growing exposure window.
A Cloudaware DevOps expert describes a useful benchmark like this:
Next we take those automated checks and ask the question that matters to security and auditors alike. Are the controls holding over time, or do they decay after the deploy? \*\*👇\*\*
Read also: 9 DevSecOps Benefits for Security Leaders [With Proof]
Policy compliance rate over time
Policy compliance rate is the metric that answers, “Are our controls actually holding in the wild.” Not on the day you ran the audit script. Not in the slide you sent to leadership. In production, across accounts, while people deploy, change permissions, and spin up infrastructure at 2 a.m. That’s why it belongs in your core DevSecOps KPIs set.
Start with a definition that won’t collapse under debate. “Compliant” means an asset meets a specific policy rule at a specific point in time. For example, “S3 buckets must block public access,” “EBS volumes must be encrypted,” “No admin access keys older than X days,” “Security groups cannot allow 0.0.0.0/0 on SSH.” If you’re tracking CIS compliance, be clear whether you’re measuring full benchmark pass rate, or a subset of controls mapped to your environment.
Exceptions are not failures. They are time-boxed decisions. Treat exceptions as first-class objects with an owner, reason, and expiry date. No expiry date means you created a loophole, then forgot it existed. That’s how “temporary” becomes policy.
Now the big mistake. Point-in-time compliance is weaker than trend plus drift control. A snapshot can look perfect right after a cleanup, then decay quietly as new resources appear and settings drift. Trendlines show whether you’re improving. Drift shows whether the system can stay improved. That combination is what “continuous compliance” is supposed to mean.
Cloudaware continuously evaluates resources against policies and rolls results up into dashboards you can slice by application, account, environment, and team. You track compliance rate over time per policy pack, see exactly which assets failed and why, and export audit-ready artifacts when someone asks.
Next, we move from “are we compliant” to “how do we keep it compliant without meetings.” 👇
Ratio of automated to manual approvals
This KPI tells you whether your process can scale past the people who currently keep it alive. When teams grow, releases accelerate, and platforms expand across accounts, manual reviews become the quiet limiter. Your pipeline governance might look “controlled,” but it behaves like a queue.
How to compute it
Formula: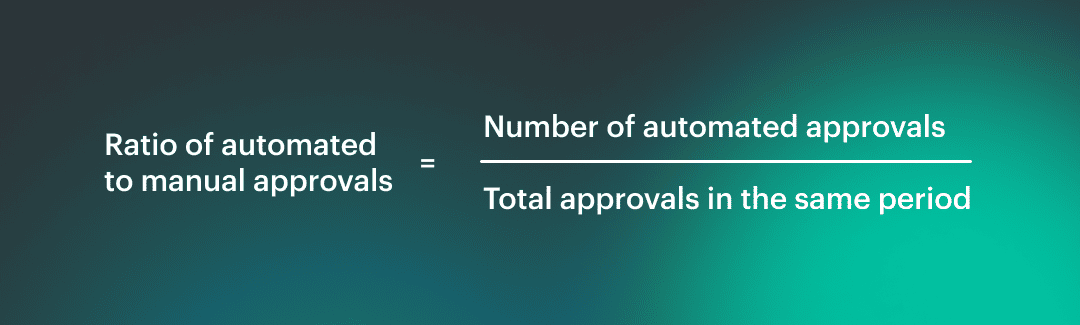 Count approvals that unblock a deploy, a merge, or an infrastructure change. Keep the scope consistent, then slice by service tier and environment. The ratio should look very different for Tier 0 production than for a dev sandbox, and that’s fine.
What “too manual” looks like
You’ll recognize it fast. Approvals sit for hours or days with no comments. The same questions get asked every time. People approve based on trust in a person, not evidence from controls. A release that should be routine becomes a meeting, then becomes a habit.
How to automate without making it unsafe
Automation is only reckless when it’s unconditional. Safe automation is conditional and observable. Build security gates that pass low-risk changes automatically, and force human review only when risk signals trip.
Think severity thresholds, sensitive resource types, privileged access changes, or policy exceptions near expiry. Make the logic explicit, log every decision, and keep a fast rollback path if a rule is wrong.
Those release gates should speed up the common case and slow down the scary one, on purpose.
Next we leave approvals and step into the environment that keeps changing even after the deploy is “done.” 👇
Cloud posture DevSecOps metrics
Post-release checks exist because the cloud keeps moving after you ship. Permissions drift, security groups get “temporarily” opened, tags disappear, a hotfix bypasses the baseline, and suddenly yesterday’s compliant release is today’s risky runtime.
These metrics matter because they measure the part nobody sees in the pipeline, the slow creep that turns stable systems into surprise outages and audit panic. When your DevSecOps reports track what changed after deployment per environment and service tier, you stop arguing about intent and start managing reality.
Next we circle back to the flow metric that shows the cost of that reality immediately. 👇
Configuration drift rate
If you’re serious about measuring DevSecOps success, configuration drift is the metric that keeps you honest after the release party is over. Drift is simple to define and brutal in impact. It’s when runtime configuration diverges from the approved baseline, whether that baseline is IaC, policy, or a known-good CMDB state.
One tiny baseline deviation can turn into a public bucket, an exposed port, or a privileged role nobody remembers granting.
How to measure it without hand-waving
Pick a unit that lets teams act:
- Resources per week drifting: “42 resources drifted in prod last week”
- Percent of fleet drifting: “3.1% of prod resources are currently in drift”
Both are useful. The first shows operational load. The second normalizes growth so you can compare quarters.
Why drift is a post-release security signal: most risky changes don’t arrive as a clean PR. They appear as console edits, emergency tweaks, inherited permissions, or “temporary” access that never got rolled back. Your pipeline can be perfect and you can still end up with cloud misconfiguration drift.
A Cloudaware DevOps expert frames the benchmark like this:
“Healthy systems drift less, and they drift for shorter periods. I don’t care about zero drift. I care that prod drift is rare, obvious, and fixed before it becomes the new normal.”
Cloudaware runs drift detection continuously and flags resources whose current state deviates from baseline rules or policy expectations.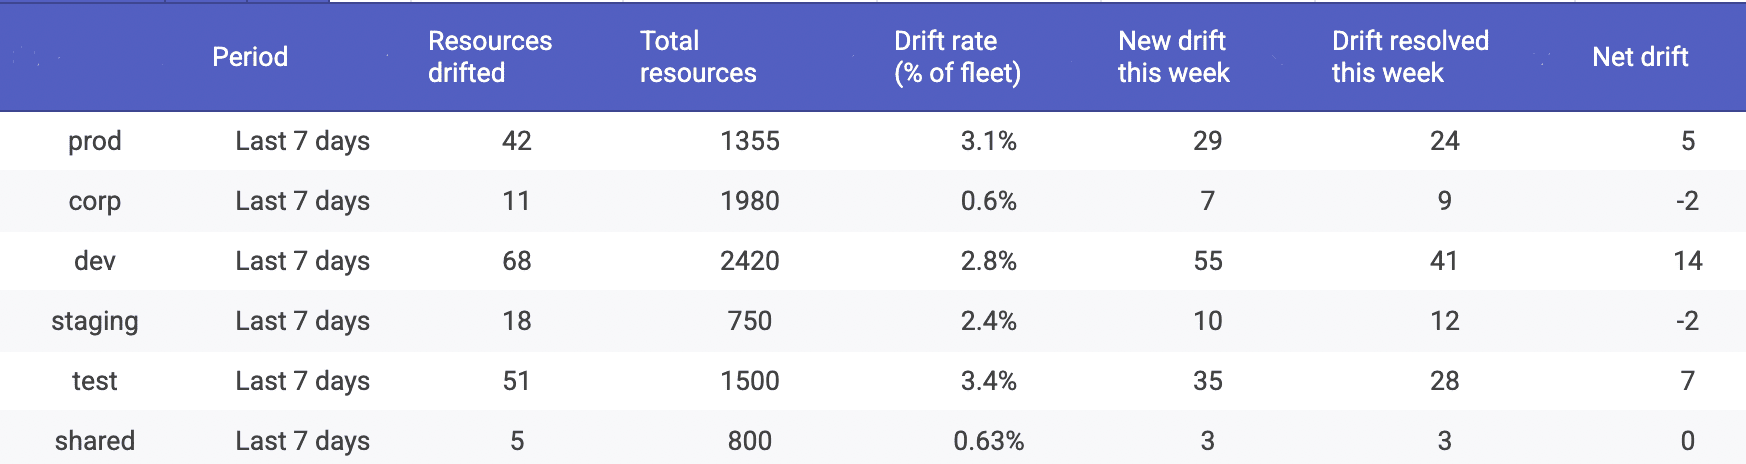 Drift is displayed as a trend over time and sliced by environment, account, service tier, and ownership, so you can see where drift is being created. The workflow that matters is built in: track drift by environment first, because prod drift is the headline, then measure MTTD and MTTR for the misconfigurations that drift reveals.
Next we tighten the lens. Drift rate tells you how much is changing. The next metric tells you how long it takes you to notice the change at all. 👇
Read also: DevSecOps Roles and Responsibilities - Who Does What and Teams Structure
Mean time to detect misconfiguration (cloud)
This is one of those DevSecOps metrics that sounds niche until you’ve lived through it. A misconfiguration isn’t a bug in code, it’s a risky state in your environment. The clock starts when the environment becomes non-compliant, and it stops when your tooling first flags it. That’s your misconfiguration detection time.
Where the signal comes from matters. You’re detecting a policy violation in live cloud configuration. Think CSPM checks, continuous policy evaluation, and drift signals. In other words, cloud security posture metrics. A vulnerable library can sit harmlessly until it’s reachable. A misconfigured security group can be reachable the second it’s created. Different physics, faster consequences.
Cloudaware already frames this metric explicitly in its lifecycle guidance, and the wording is worth keeping consistent across your article and dashboards. In Cloudaware reporting, detection time is captured as the gap between when a resource first enters a non-compliant state during policy evaluation and when that breach is first recorded against the specific asset.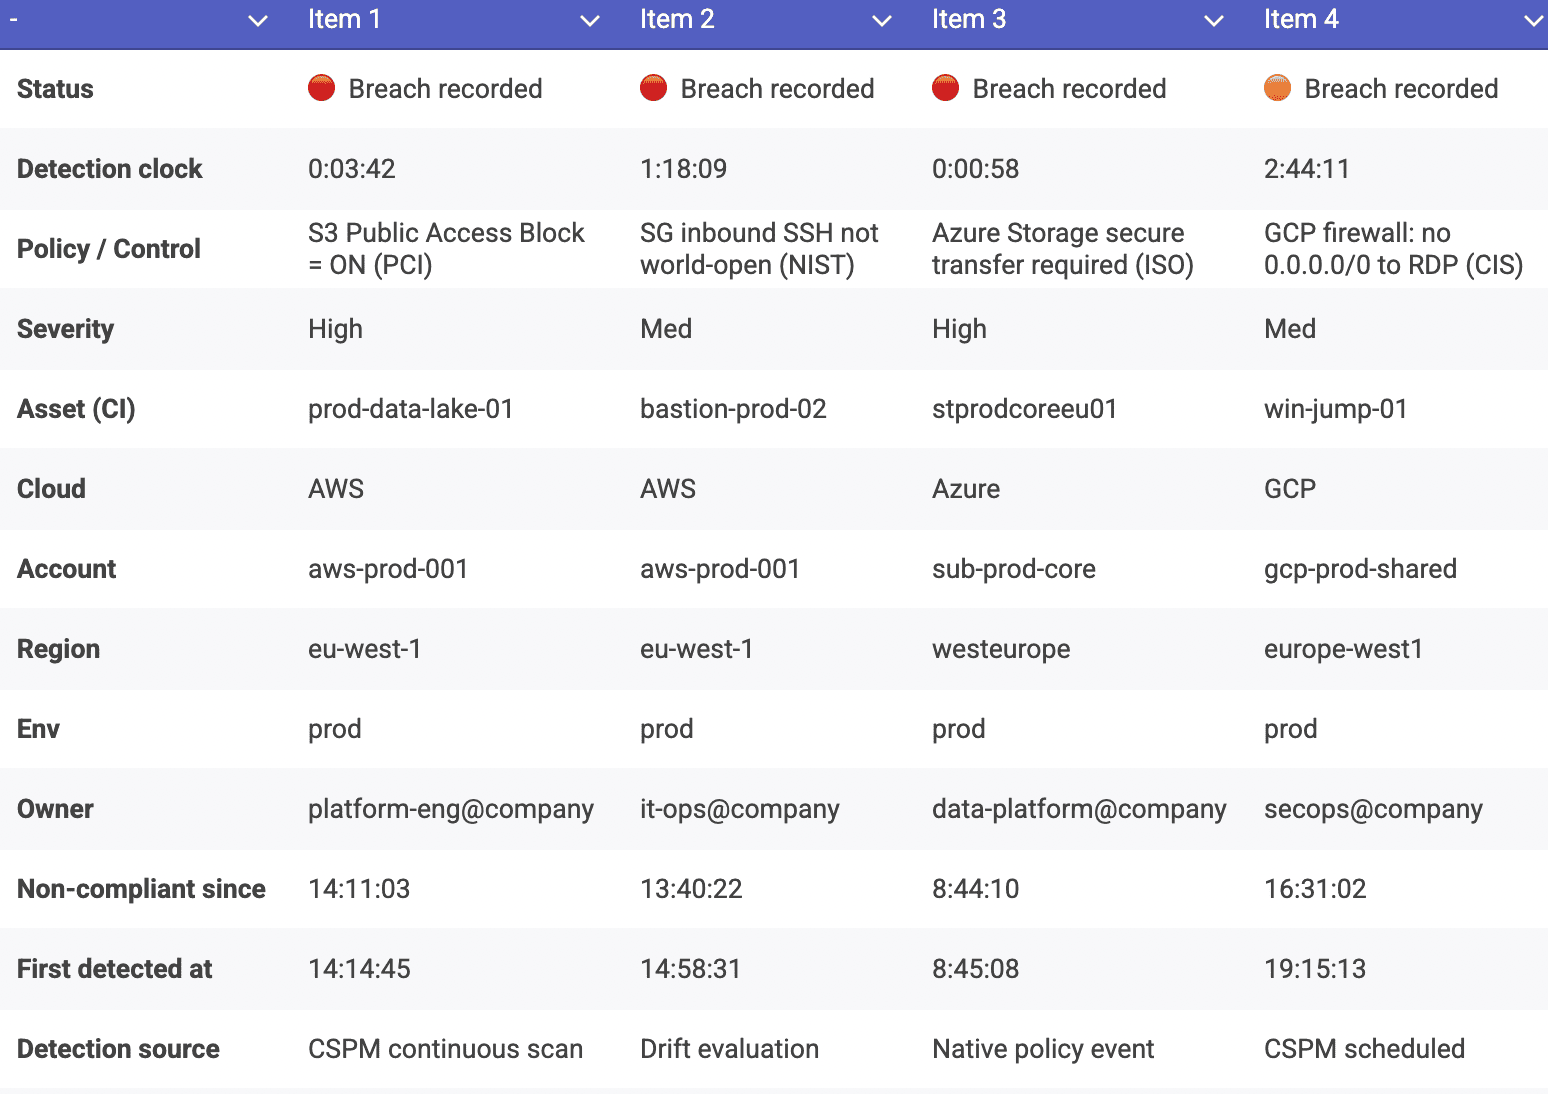 From there, you can trend it over time and slice by environment, account, service tier, and owner, which makes policy breach detection actionable instead of noisy.
A Cloudaware DevOps expert puts the benchmark plainly:
“In cloud, late detection is the risk. If prod misconfigurations sit undetected for days, you’re trusting luck. Healthy teams measure in hours, and they measure it per environment, because dev noise should never mask prod exposure.”
Once you can detect quickly, you get to the part that separates mature programs from busy ones. How fast do you bring the environment back to safe? 👇
Read also: DevSecOps Pipeline Explained - Stages, Diagrams, and CI/CD Patterns
Mean time to remediate misconfiguration (cloud)
Detection is the moment you stop guessing. Remediation is the moment you stop being exposed. Define this metric as misconfiguration remediation time from detected → baseline restored. Baseline means the resource is back in the approved state, the policy check passes again, and the fix survives the next deploy.
Split the work into two lanes, because they behave differently. Automation remediation is fast and consistent. Think drift correction via approved runbooks, IaC redeploy, or enforced configuration defaults. Human remediation is slower and messy, often because the owner is unclear, the blast radius is unknown, or the “fix” needs a change window.
Your DevSecOps reports should show both, because the gap is the business case for automation, not a moral failure.
Preventing recurrence is where mature teams pull ahead. You don’t want to focus solely on one aspect. You want the system to resist bad states by default with policy enforcement that makes the safe configuration easy. This is the post-release promise: controls continue to hold after deployment, even when the cloud keeps changing.
A Cloudaware DevOps expert describes the benchmark like this:
“Good remediation is boring. The same misconfiguration should get fixed faster every time, then stop happening. If MTTR drops but the same policy keeps failing, you’re optimizing cleanup, not improving posture.”
How Cloudaware measures it in dashboards:
The timer starts when a policy evaluation first flags a resource as non-compliant, tied to a specific asset and environment. The timer stops when the resource returns to a compliant state and stays there, so you are measuring a durable fix, not a temporary tweak. 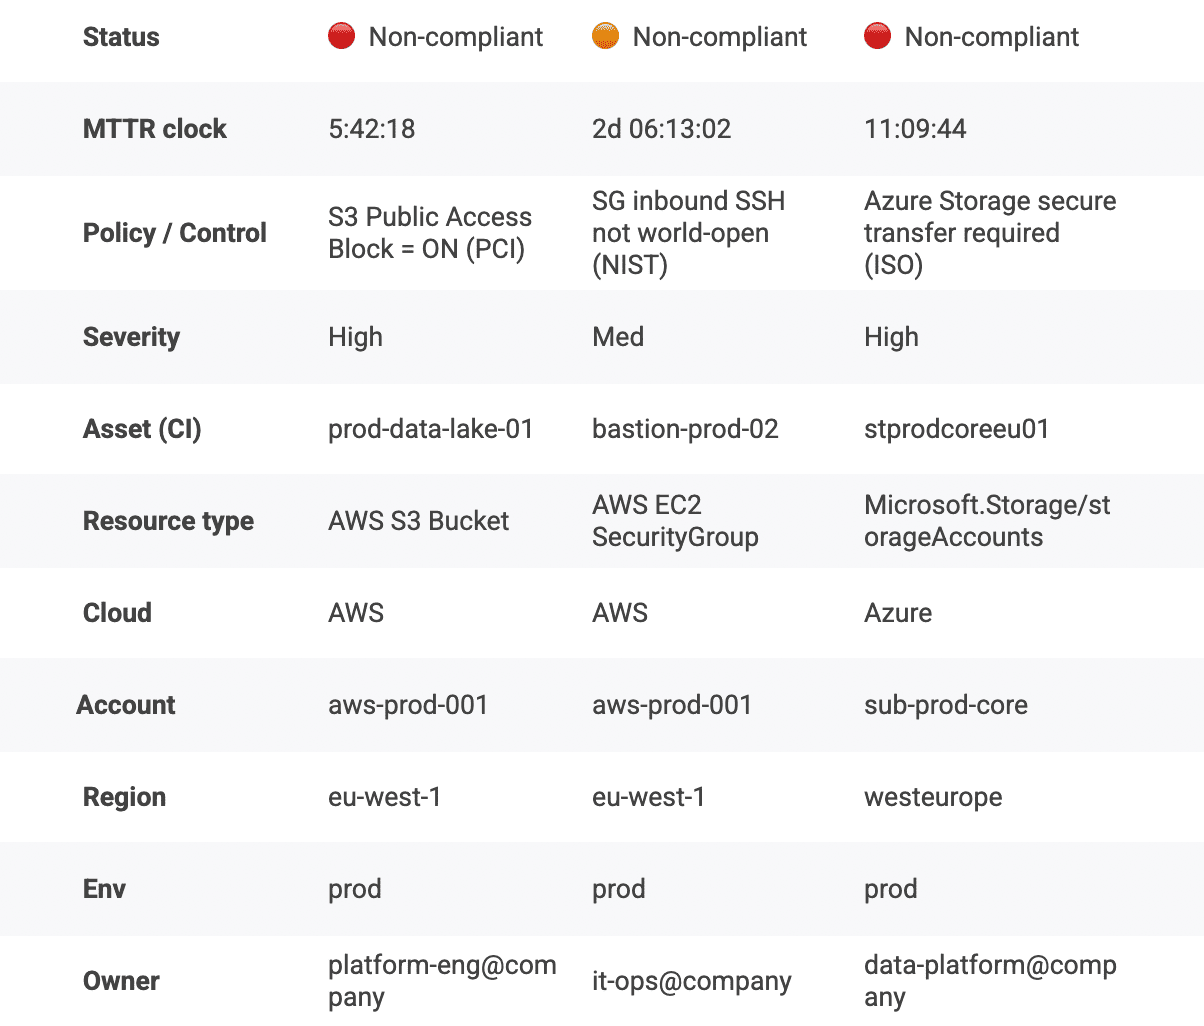 You can slice MTTR by environment, service tier, account, and owner, which turns the metric into a queue you can actually manage. That’s how DevSecOps KPIs become operational, not decorative.
Next we pull these metrics together and show how to make them easier to collect, harder to game, and more useful in real decisions.
Read also: 15 DevSecOps Tools - Software Features & Pricing Review
Enhance DevSecOps metrics with Cloudaware
After you’ve defined 10+ metrics, the next problem isn’t math. It’s plumbing. You’ve got CI/CD in one place, tickets in another, scanners somewhere else, cloud configs living inside three consoles, and now you’re supposed to prove measuring DevSecOps success without inventing a data warehouse hobby.
-
Keep what already ships. Your pipeline stays your pipeline. Jenkins, GitHub Actions, GitLab. No rip-and-replace drama. Cloudaware sits next to it and focuses on the part most teams lack: consistent context and evidence, not “yet another runner.”
-
Add shared context once. Metrics get sharp when every datapoint knows its owner, its environment boundary, and its application scope. Inventory plus ownership stops “unknown” assets from becoming permanent risk. One policy language means teams stop translating rules across tools.
-
Make evidence automatic. Approvals, changes, current config state. You should be able to reconstruct the story on demand, including why a control passed, why it failed, and what changed afterward. That’s how automation supports compliance and turns audit season into a normal Tuesday.
-
Slice the metrics until they tell the truth. Global averages hide the story. Cloudaware helps you slice by app or service, by environment, by account or subscription, or by team. Suddenly your failure rate isn’t a blame grenade. It’s a map.
21-it-inventory-management-software-1-see-demo-with-anna