


Slack pings. Dashboards open. Another cloud cost spike and no clear explanation. It’s a familiar routine — checking commit coverage, digging through the latest tagging report, and hunting for anomalies buried in noise. Meanwhile, the pressure builds in the cloud financial management trenches: chasing forecasts, tracking down untagged assets, and defending a budget that’s already outdated.
Google “FinOps KPIs” and you’ll find 30+ “key performance indicators” every blog swears you must track. But let’s be real — you don’t need all of them. What you need is to know when to use which metric — and why it actually matters when you’re operating across accounts, clouds, and cost centers.
So, in this article, we’re breaking it down by situation:
- Want better visibility? Measure these.
- Spotting cloud waste? Track this.
- Justifying spend to finance? Use these KPIs.
- Optimizing usage and savings plans? Here’s what to watch.
- Gauging FinOps maturity? These indicators are gold.
- Proving migration value? Yep, KPIs for that too.
Let’s start with the first one 👇
How do we improve visibility into our cloud spend?
You’re neck-deep in chargeback reports, tagging audits, and budget review prep — but dashboard still can’t answer “Where exactly is our cloud money going?”
Between cost centers, shared services, and that jungle of untagged EC2s and S3 buckets, cloud financial management starts feeling like cloud financial guesswork. You’ve got data pouring in from every direction, but zero clarity.
When you're done chasing anomalies through dashboards and ready to actually see where you spend lives and breathes — these are the FinOps KPIs to keep your eyes on 👇
% of Cloud Spend Allocated (via tags or accounts)
You’re pulling together numbers for a QBR, and boom — half your cloud cost is swimming in the “unallocated” abyss. No owner, no context, no way to explain that $480K spend without shrugging.
This KPI? It’s your lifeline.
% of Cloud Spend Allocated tells you how much of your cloud spend is actually mapped — via tags, linked accounts, or org structures — to the right teams, apps, and environments.
Clean. Traceable. Defensible.
Without proper allocation, your cost management strategy stalls. You can’t forecast, can’t charge back, can’t flag anomalies. You’re just tossing dashboards into the void, hoping someone will identify what went wrong.
How to calculate it:

FinOps Foundation benchmarks “crawl” maturity at 50% allocation. “Run” is 90%+. Aim for 80%+ if you want confident reporting, automation, and solid tracking of spend attribution across cloud services.
Track it when launching a new business unit, building showback models, or untangling the tag spaghetti from infra-as-code that forgot the “code” part.
Cloudaware integrates cost and usage data from AWS (DBR/CUR), Azure EA, and GCP billing accounts. Once integrated, Cloudaware enriches this data with metadata and tags from its CMDB, enabling organizations to identify and link each cost line item to teams, applications, or environments — leveraging tagging policies, account hierarchies, and custom pricing structures.
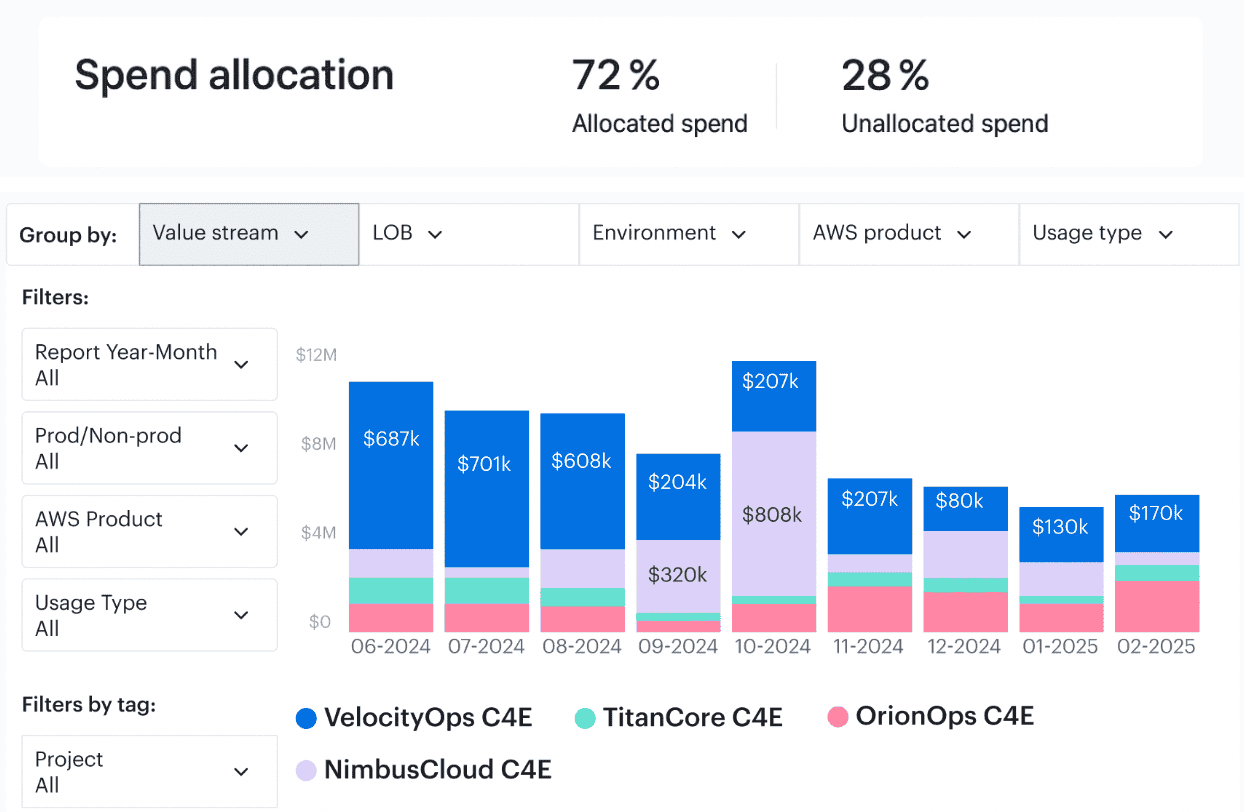
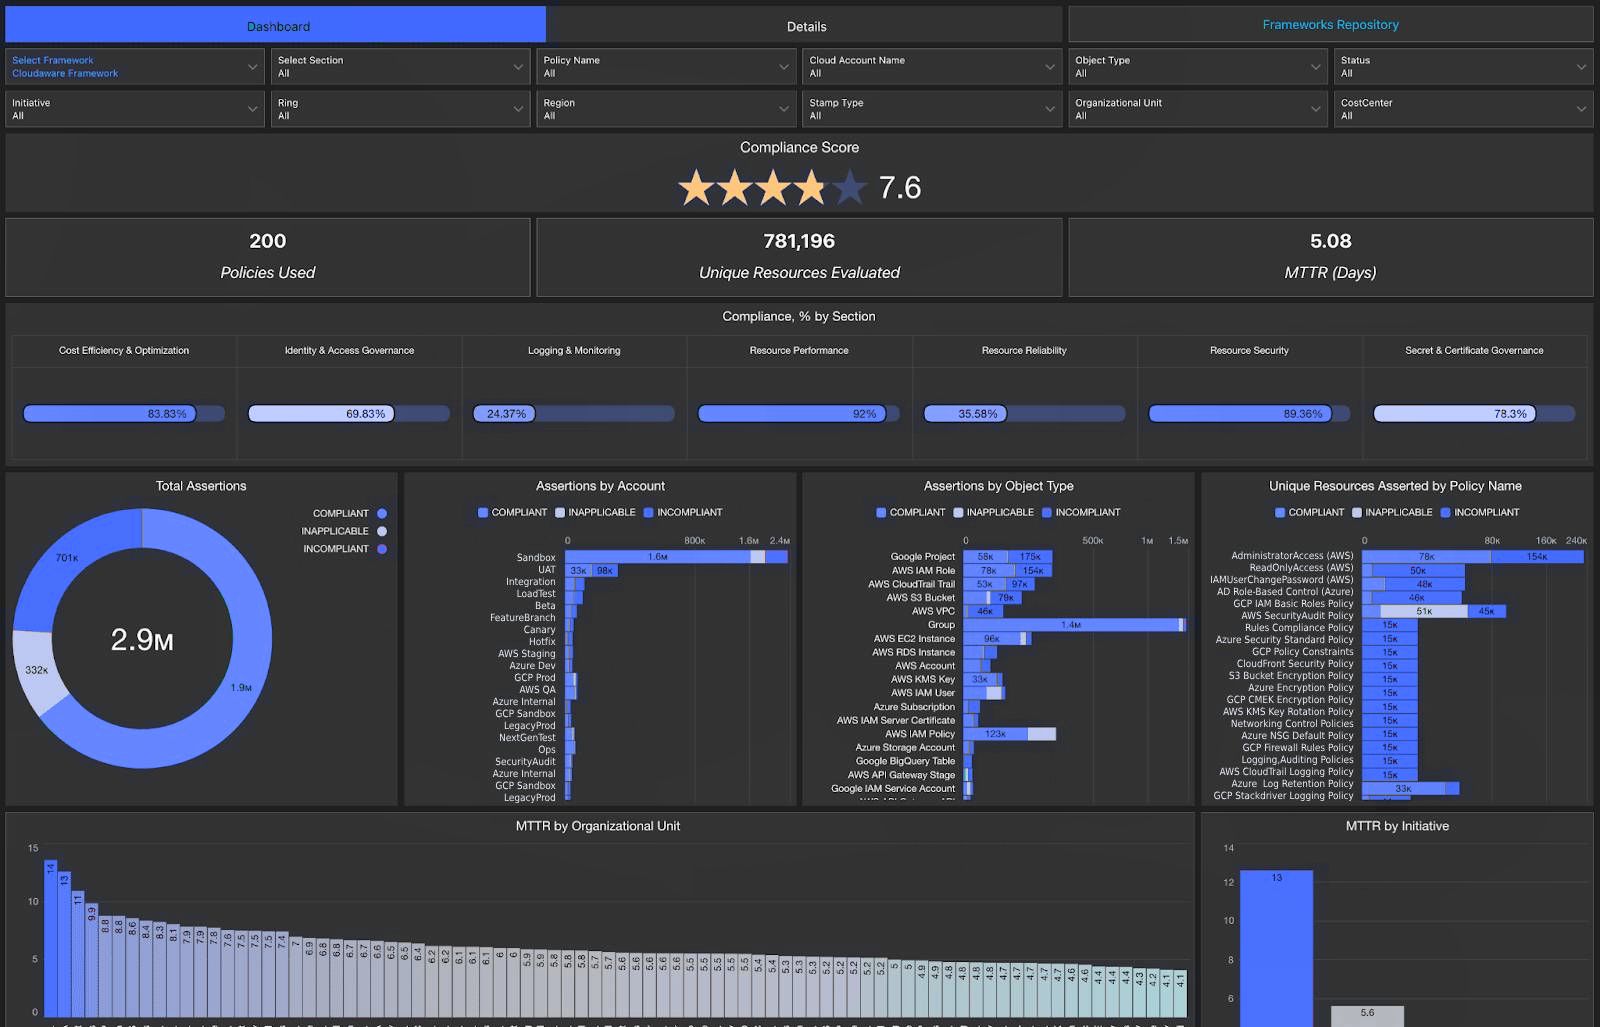
Element of the Cloudaware report of spent allocation history. Schedule a demo to see it live
Using the Force.com-powered report and dashboard builder, you can generate spend allocation reports that break down cloud cost by allocation status. These dashboards support filters by tag keys (e.g., project, cost-center), cloud account, provider, or environment — perfect for cross-team accountability and tracking high-impact services.
Read also: 7 Cloud Cost Allocation Strategies from FinOps Experts
% of Tagging Policy Compliance
Tell me if this sounds familiar — you’re chasing down a spike in cloud spend, open up the resource report, and boom: half your stuff is tagged null, n/a, or just… blank. No owner, no cost-center, no clue.
Been there.
That’s why this KPI — % of Tagging Policy Compliance — is one of Cloudaware users go-tos. It tells you how many of your taggable resources are actually following the rules you set for cost accountability.
If it’s not tagged, it’s invisible. And if it’s invisible, your cloud financial management turns into guesswork. This KPI keeps things clean: chargebacks make sense, forecasts aren’t garbage, and alerts go to the right people instead of falling into the void. Tagging is the foundation, and this metric tells you if that foundation is cracking.
How to calculate it:

💡_Quick benchmark check:_ Crawl-stage orgs sit around 40–60%. Once you’re walking, aim for 85%+ in production — and don’t let owner, env, or project tags slide. Those are the big ones.
You want to track this any time you're onboarding a new dev team, rolling out a new IaC template, or watching tagging drift creep in from autoscaling fleets. Basically, if infra’s being spun up fast, this metric’s your early warning system.
Cloudaware totally has your back here. It pulls in resource data from AWS, Azure, and GCP, runs everything through your custom tagging policy using the Compliance Engine, and shows you exactly where the gaps are. You get dashboards with real-time compliance by tag key, alerts when coverage dips, and reports that actually make sense to finance and engineering alike.
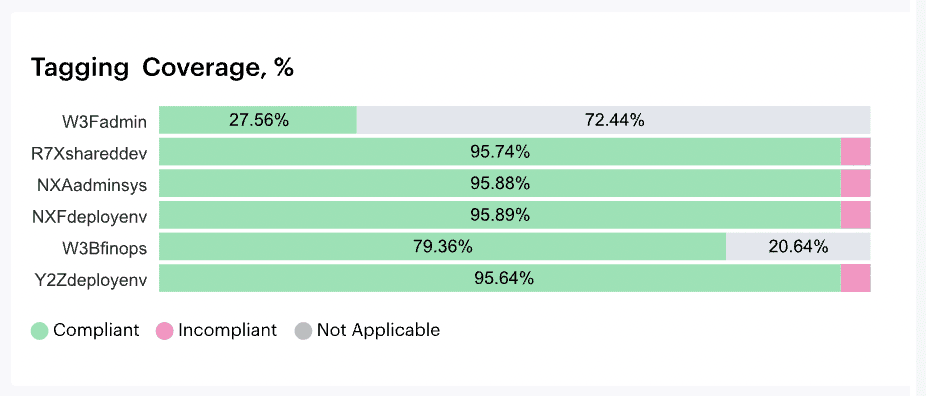
Element of the tagging coverage report in Cloudaware. Schedule a demo to see it live
It’s like having a tagging auditor that never sleeps — and actually tells you what’s broken, where, and why. Total sanity-saver.
Read also: How Experts Are Navigating the FinOps Lifecycle in 2025
% of Untagged Cloud Resources
This one always sneaks up on you. You’re pulling a cloud spend report, trying to prep for chargeback or maybe just figuring out where last month’s budget actually went… and bam. There’s a growing blob of cloud resources with no tags. No owner, no project, no env. Just silently sitting there, clocking hours and eating costs.
That’s why Cloudaware clients keep a close eye on % of Untagged Cloud Resources. It tells you exactly how much of your environment is flying under the radar.
This one’s more than just a number — it’s your early warning system. Untagged resources are invisible to your cloud financial management stack. You can’t allocate them, you can’t optimize them, and they mess up everything from anomaly detection to RI/SP utilization tracking. If you're working across multiple clouds with dynamic workloads, this KPI is gold for monitoring waste and staying ahead of budget drift.
Here’s how to calculate it:

Want some context?
🟡 If you're just getting your tagging policies in place, 30–50% untagged isn’t unusual.
🟠 Once you're rolling with some enforcement, aim for <25%.
🟢 And if you're in “run” mode? Push for under 10%. Prod should basically be clean.
I usually check this right after big deployments or infra refreshes — especially when there’s IaC involved and you’re not 100% sure the tagging step made it into the pipeline. It’s also great for catching dev teams that are “just testing something” but forget to clean up after themselves.
In Cloudaware you get dashboards that highlight untagged resources by service, tag key, and account. You can even see their cost impact — because yes, that untagged dev bucket is costing you $400 a month.
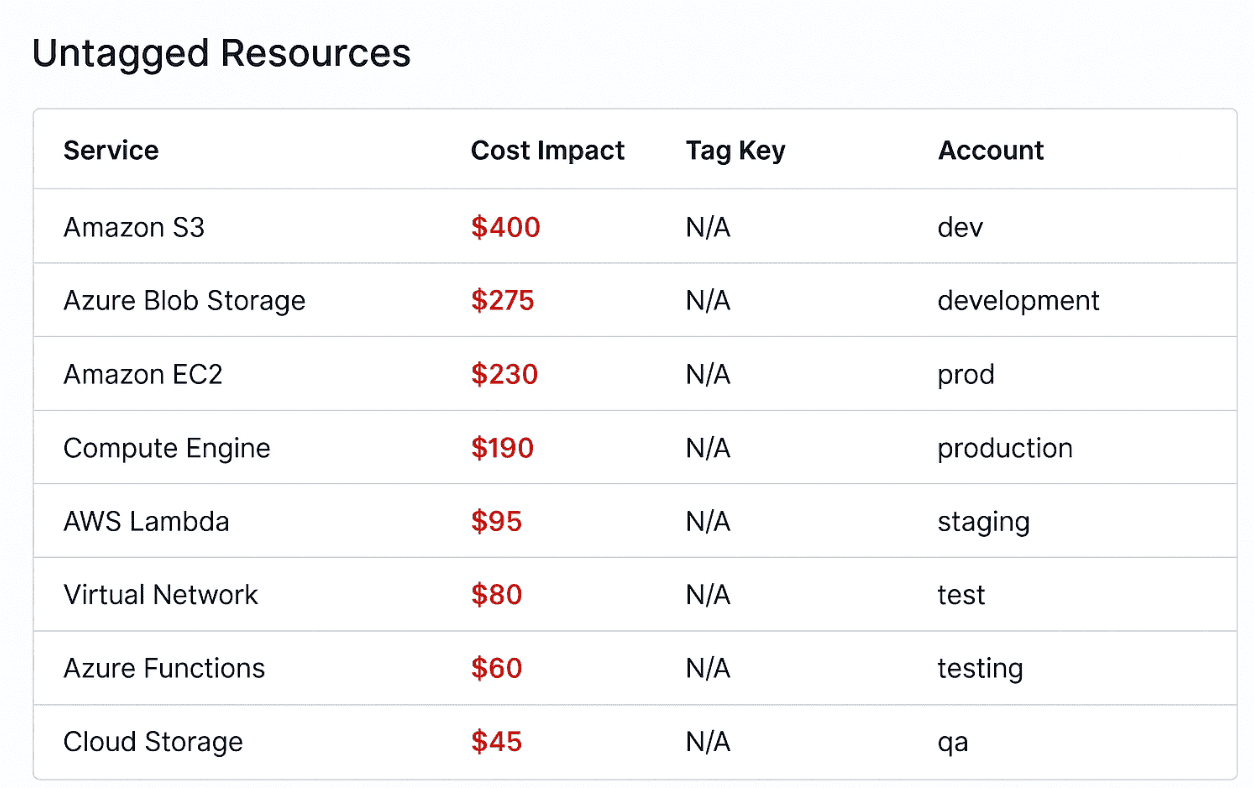
Example of the untagged resources report. Schedule a demo to see it live
And the best part? You can set alerts when untagged coverage drops, send reminders, and even route tasks to the right team to fix it — before your financial management team starts monitoring anomalies and asking questions.
Read also: What Is FinOps? Framework, Roles, Strategy & Tools in 2026
% of Unallocated Shared Cloud Costs
You know that part of the cloud bill — the one labeled “shared services,” where everything from NAT gateways to support charges and transit fees just hangs out with no clear owner?
That’s the swamp. And % of Unallocated Shared Cloud Costs is the KPI that tells you how deep you’re in it. It measures how much of your total cloud spend is sitting in shared or indirect buckets that haven't been distributed to any team, app, or business unit.
This one’s a silent budget killer. When shared costs go unallocated, your cost models break. Teams start pushing back on their bills, forecasting gets sketchy, and leadership loses confidence in your numbers. I’ve seen clients go from mild “we’ll figure it out later” to full-on budget escalations because this number got out of hand. It’s not just about cost recovery — it’s about trust in your entire cloud financial management practice.
Here’s the formula:

At crawl stage, 50%+ unallocated shared cost isn’t uncommon. But once you're walking, you should be pushing that under 25%. Run-stage orgs aim for 10% or less — especially in production and customer-facing environments.
You’ll want to keep an eye on this whenever you’re refining your chargeback/showback models, onboarding new shared services, or scaling multi-tenant platforms that make cost traceability tricky. It also helps after infrastructure-as-code changes — especially when central resources get recreated and lose their previous allocation logic.
Here’s how Cloudaware handles it behind the scenes:
First, it pulls in detailed billing data from AWS CUR, Azure EA, and GCP Billing Accounts. Then it enriches that data using your tagging structure, linked accounts, and the Cloudaware CMDB — cross-matching shared services like ELBs, NATs, support plans, and VPC transit with consumers using metadata patterns and usage signals.
You can define your own allocation logic using policies — by usage hours, API calls, GB transferred, whatever makes sense for your org.
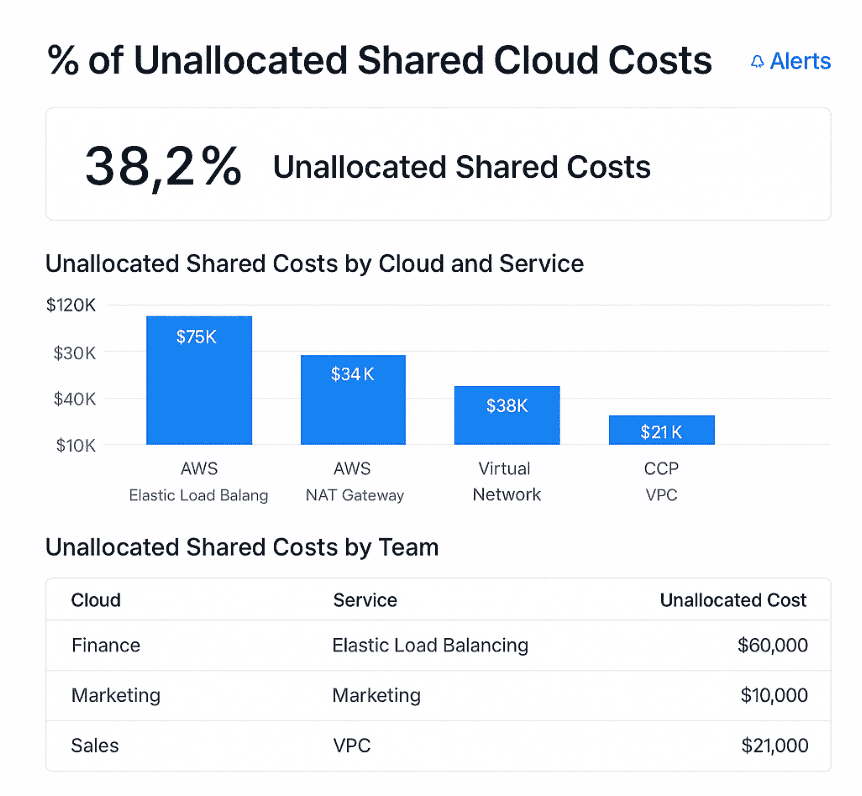
This is an example of a dashboard on unallocated shared costs. Schedule a demo to see it live
The result? Dashboards that clearly separate allocated vs. unallocated shared spend, filtered by cloud, service, or team. You’ll also get alerts when unallocated percentages creep past your set thresholds — so you know when it’s time to revisit your logic or chase down missing tags.
Read also: Cloud Cost Optimization Metrics: 18 KPIs FinOps Track
% of Queryable, Normalized Billing Data
You ever try to build a cloud spend dashboard and feel like you’re wrestling a wild CSV with one hand while blindfolded? Yeah — because even with CUR, EA exports, or GCP billing files, what you get from the cloud providers isn’t immediately useful.
That’s where % of Queryable, Normalized Billing Data comes in. It tells you how much of your cloud billing data is clean, consistent, and analytics-ready.
This FinOps KPI directly impacts how fast you can slice cloud costs by tag, filter by service, or trace charges across multi-cloud setups. If your data isn’t normalized, you’re wasting hours hunting down mismatched fields and fixing broken pivots instead of answering questions from financial stakeholders or catching spend anomalies in real time.
How to calculate it:

Basically: how much of your billing data can be trusted and queried right now without needing manual intervention?
Iurii Khokhriakov, Technical Account Manager:
Now here’s how Cloudaware gets you there:
It starts by pulling your CUR (AWS), EA Billing Data (Azure), and GCP billing exports, all through secure integrations. Then, it parses every cost line item and enriches it using Cloudaware’s CMDB metadata, tags, and account associations. That means when you look at spend tied to project:alpha or env:prod, you’re not guessing — it’s already been translated into a clean, normalized model with mapped object types and usage dimensions.
You get Force.com-powered dashboards where every report is built on top of normalized data. Want to see cloud costs per service, region, or account with filters that actually work? Done. Need an export? You’ve got Excel and PDF scheduled deliveries. Cloudaware even validates billing data freshness and alerts you when ingestion errors occur or a provider misses a billing cycle sync.
Where are we wasting money?
You’re reviewing last month’s cloud financial management report, and the numbers don’t lie — spend is up, but usage? Flat. You’ve already ruled out tagging issues and shared cost anomalies, so now it’s time to get surgical. Maybe it's idle dev clusters left running over the weekend, oversized instances chewing through RI coverage, or containers that never auto-scaled down. Wherever the leak is, your FinOps KPIs need to surface it fast — because if you can’t show where the waste is, you can’t fix it.
Here’s what to track when you’re ready to hunt down cloud waste with surgical precision.
Waste detected (unattached storage, idle VMs, overprovisioned instances)
You’re prepping for month-end close, and someone from finance pings you: “Quick question — are we really using all of this?” And just like that, you’re sifting through thousands of cloud resources, trying to explain why there’s $19K in spend tied to volumes no one’s touched in weeks.
The Waste Detected KPI surfaces spend linked to idle, orphaned, or oversized resources — things like unused EBS volumes, underutilized EC2s, and container nodes running at 10% capacity.
This KPI isn’t just about optimization — it’s about cloud financial management maturity. It helps you cut dead weight, improve commit coverage accuracy, and push cost accountability back into engineering workflows. No fluff — just measurable savings.
How to calculate it:

Break it down by category:
- Idle VMs: sustained <5% CPU usage over 7+ days
- Unattached storage: volumes not linked to any instance
- Oversized compute: provisioned far beyond actual usage
Using 100+ waste detection policies Cloudaware analyzes factors like storage state, usage history, and tagging coverage to flag idle VMs, unattached EBS volumes, and oversized nodes — along with their cost impact.
You’ll get a dedicated Waste Dashboard where findings are sorted by account, service, tag key, and potential savings. Using Force.com’s reporting engine, you can schedule exports, build custom reports, and trigger alerts when waste crosses set thresholds.
For example:
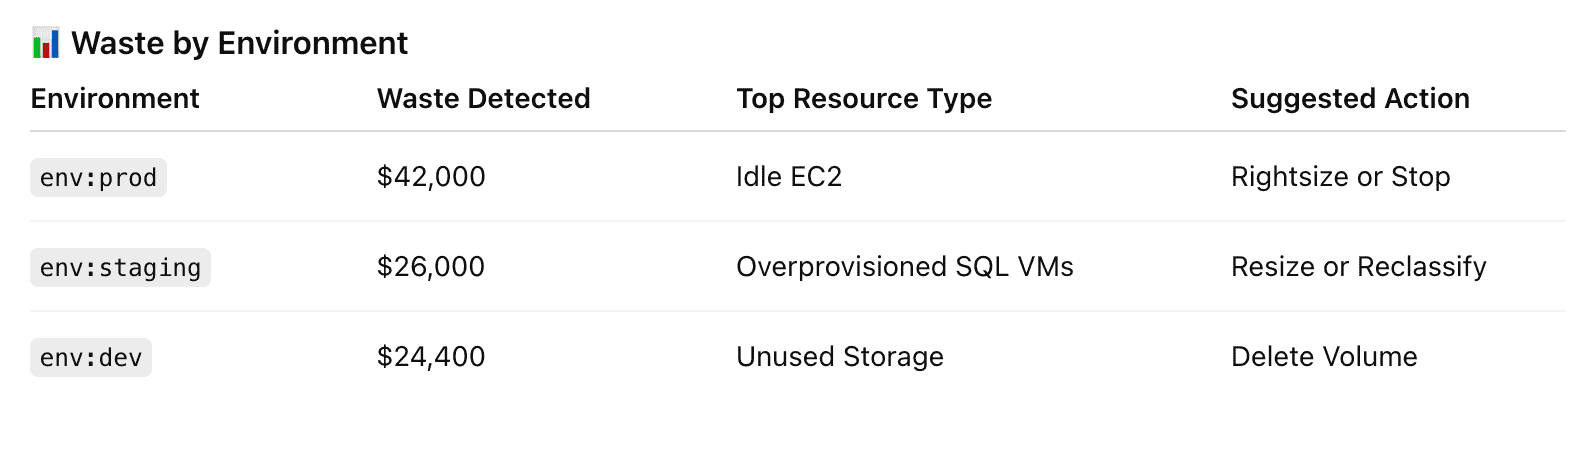
Element of the waste detected report in Cloudaware. Schedule a demo to see it live
Waste data is mapped to the CMDB for context, and you can use tagging policies or compliance rules to route reviews or cleanup tasks. While Cloudaware doesn’t auto-remediate, it gives you everything you need to catch inefficiencies before they become budget problems.
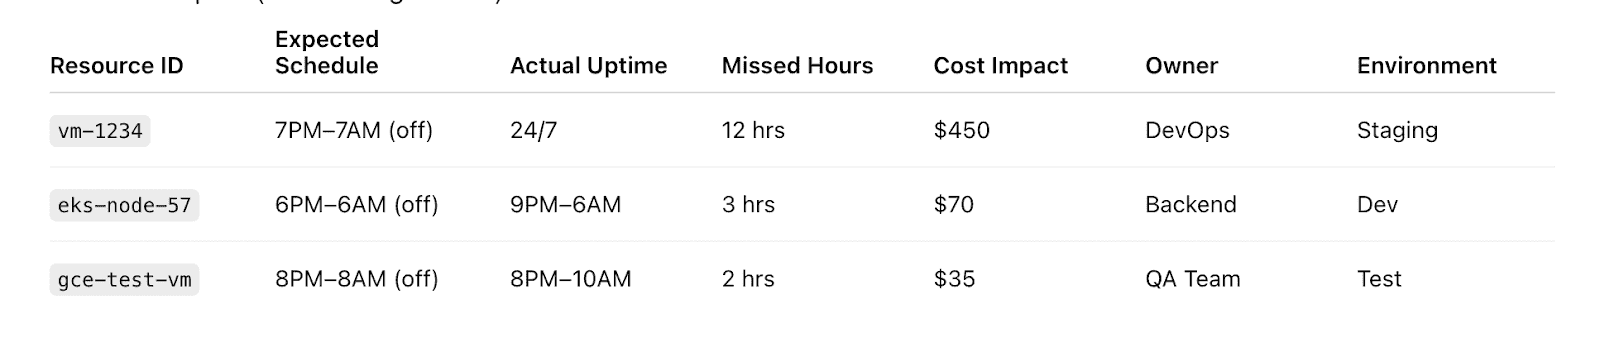
Power schedule adherence rate
You’ve built the schedules. You’ve aligned the policies. You’ve told every team, “If it’s non-prod, it doesn’t need to run 24/7.” And yet here you are, watching EC2s and Kubernetes nodes hum away on weekends and during off-hours like it’s no one’s cloud spend.
Power Schedule Adherence Rate measures how well your services are sticking to their expected runtime schedule — so you know if you’re actually saving, or just pretending to.
This KPI matters because scheduled power-downs are one of the lowest-effort ways to achieve cloud cost optimization. Missed schedules = missed savings. And with dozens of environments, thousands of resources, and team ownership scattered across clouds, enforcing schedules manually?
Not scalable. This metric gives you visibility into drift, supports automation, and improves cost management by helping organizations consistently act on opportunity.
How to calculate it:

You can also flip it to show non-adherence and track wasted hours per resource class.
Anna, ITAM expert at Cloudaware:
Using CMDB context — like environment (dev, test, stage) and resource owner — Cloudaware identifies which VMs, containers, or services should follow defined power schedules. These expectations are set through tagging rules, policy configs, or custom logic in the Compliance Engine.
The system then checks actual usage times against expected schedules and calculates adherence. You’ll get daily-updated dashboards showing which resources powered down as planned and which didn’t — sorted by tag, account, region, pricing tier, or cloud.
Element of the RI utilization data report in Cloudaware. Schedule a demo to see it live
You can filter by dollar impact too, so you know exactly which missed schedules are burning the most cash.
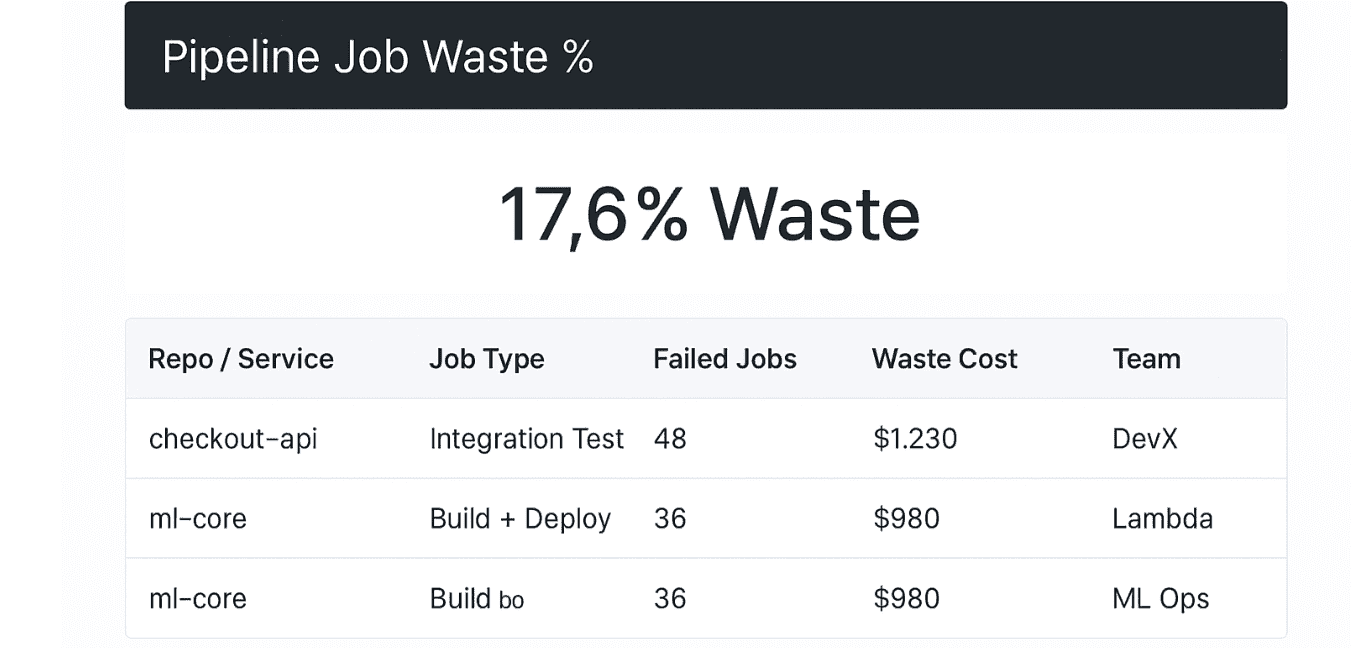
Pipeline job waste % (failed, canceled, timed-out jobs)
Here’s one that hits where it hurts: you're spinning up builds 24/7 — CI jobs firing off from GitHub Actions, GitHub runners scaling in and out, ephemeral test environments coming to life like clockwork.
But buried inside those logs? A money trail of failure. Jobs that crashed, timed out, or got nuked halfway through.
That’s what Pipeline Job Waste % uncovers — the hidden cost of pipeline chaos.
This metric tells you how much of your CI/CD spend went into jobs that never shipped anything. No artifact. No deployment. Just compute time burned with nothing to show for it. When you're running thousands of builds a week, that waste adds up fast — and it rarely shows up in your cloud bill as a clean line item.
How to calculate it:

Benchmarks? 10–15% waste is normal in fast-moving teams.
Over 20%? Time to dig in. Elite FinOps orgs track this weekly and tie it to cost per repo or environment.
Here’s how Cloudaware makes it visible:
Cloudaware connects to your CI platforms, pulls execution metadata (job ID, duration, outcome), and maps those events to provisioned infrastructure via CMDB correlation. Whether you’re using containers, Lambda functions, spot VMs, or full-stack test environments — Cloudaware rolls up the cost of every job that didn’t cross the finish line.
Element of the Cloudaware FinOps report. Schedule a demo to see it live
Your Pipeline Waste Dashboard shows job waste trends by service, repo, tag, or runner type. You can sort by dollar loss, set failure rate thresholds, and alert the exact team that owns the pipeline. It’s clean, fast, and fully reportable.
Want to include it in sprint planning? Done.
Need it in a PDF for engineering leadership? Easy.
Read also: Multi-Cloud Cost Optimization Assessment Playbook
% of Commitment discount waste
This is the KPI that quietly drains your cloud budget while looking like a savings win on paper. I’m talking about % of Commitment Discount Waste. You know the deal — you reserve capacity through Savings Plans or Reserved Instances to lower unit rates, everyone high-fives in the kickoff meeting… and then six months in, your utilization drifts, workloads move regions, or some team scales down without telling finance.
Now you're paying for commitments you're not even using.
This metric shows the percentage of those unused commitment hours — or dollars — compared to what you actually paid for. It’s not just wasted spend; it’s missed opportunity. That leftover commitment could’ve covered other accounts, apps, or environments if you’d caught it earlier.
It’s a core part of measuring FinOps maturity — especially when your organization is trying to tie strategic planning to actual cloud costs.
How to calculate it:

And yeah, you want this one low.
Benchmarks? At crawl stage, 15–25% waste isn’t unusual. Once you’re actively monitoring coverage and utilization, 5–10% is the sweet spot. Elite teams push it below 3% across production environments.
Mikhail Malamud Cloudaware GM:
Cloudaware pulls Savings Plans and RI utilization data from AWS CUR and Cost Explorer, then matches it against actual resource consumption — across linked accounts, instance types, and regions. It tracks hourly usage against commitments and flags underutilized plans based on daily granularity.
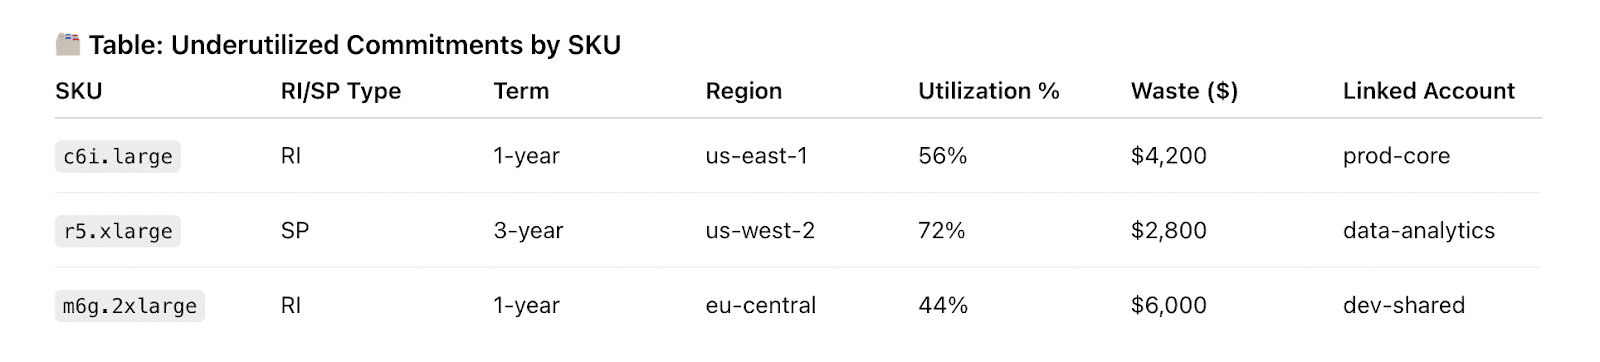
A part of the Cloudaware report. Schedule a demo to see it live
Your Commitment Waste Dashboard visualizes unutilized hours, coverage gaps, and overcommitted SKUs in context. Want to know which accounts are burning unused C6i RIs or under-consuming 1-year SPs? Done.
Want to filter that by tag, team, or environment? Easy.
You’ll also get alerts when utilization dips below your policy thresholds, so you can act before that waste compounds.
% of Legacy Resource Types
Legacy infra is that drawer everyone avoids opening. You know there are old T2s, dusty RDS versions, and storage configs no one’s touched since launch day. But they’re still running. Still costing you. That’s what % of Legacy Resource Types calls out: the part of your cloud spend tied to outdated, overpriced, underperforming services that never got the upgrade memo.
It’s not about blame. It’s about visibility. This metric shows how much money is tied up in infrastructure you could’ve replaced three quarters ago. And it’s one of the easiest wins in cloud financial management — once you track it.
Here’s the formula:

You define what “legacy” means — old instance families, storage tiers, database engines. Then track them down.
Kristina, Seniour ITAM expert at Cloudaware:
Cloudaware makes this super clear:
Every day, Cloudaware collects your multi-cloud resource inventory and classifies it using our built-in service taxonomy. You can flag anything as “legacy” based on instance family, engine version, or SKU.
The platform then maps your billing data to these outdated resources, tags them in the Legacy Resource Report, and shows how much they’re costing you — sorted by team, project, or account.
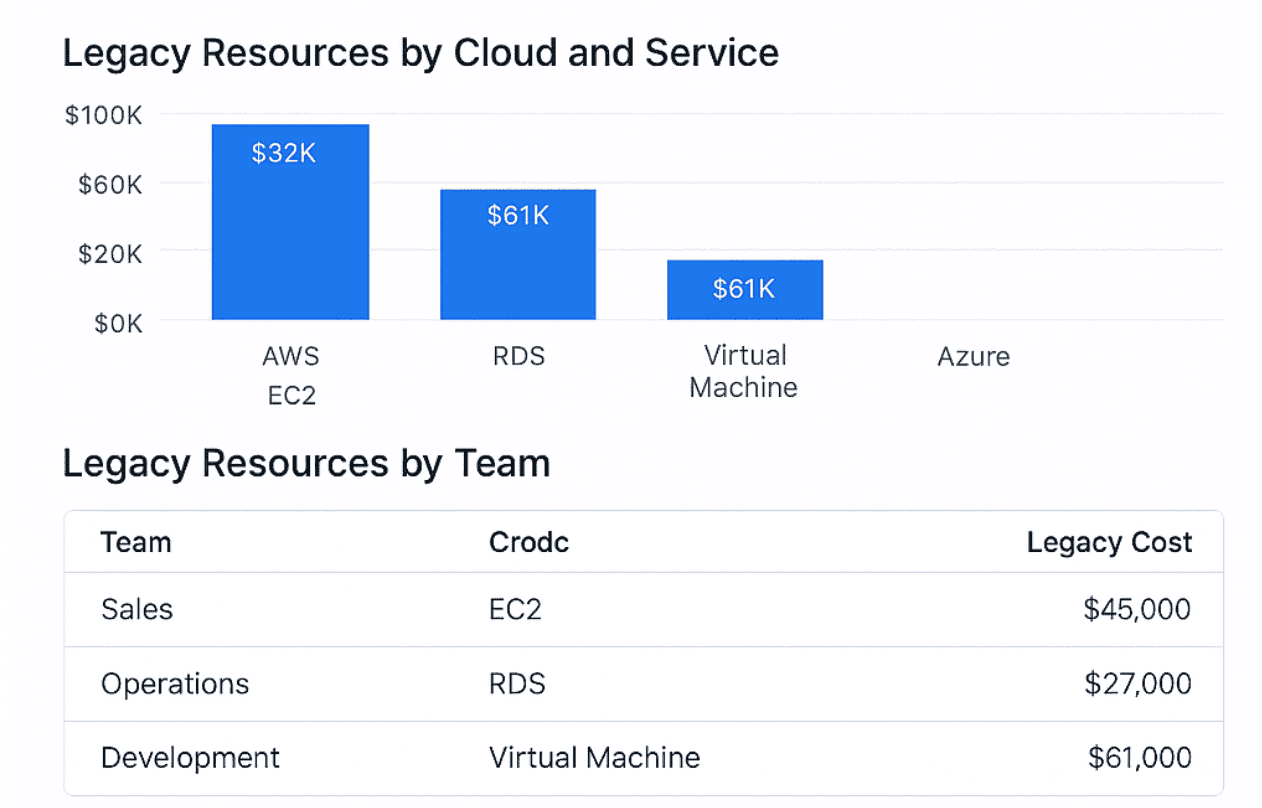
A part of the Cloudaware dashboard. Schedule a demo to see it live
You get a clean dashboard, filterable views, and alerts when legacy spend crosses thresholds. Even better? You can feed this data into compliance policies, backlog grooming, or cost review meetings — without scraping logs or juggling exports.
Read also: How Cloud Experts Use 6 FinOps Principles to Optimize Costs
Can we forecast and justify our cloud budget?
You’re staring at your Q3 forecast, juggling anomaly spikes, fluctuating workload demand, and one wildcard team that keeps launching new services with zero heads-up. Leadership wants a clean number. Finance wants proof it’s defendable.
And you? You’re stuck translating tag-blind cloud usage into business-aligned logic. Welcome to the land of “can we forecast and justify our costs?”
This isn’t about predicting spend — it’s about backing it with context, confidence, and real-time financial signals. You need continuous monitoring, actual utilization data, and cross-team management workflows that sync engineering with finance.
Here are the FinOps KPIs you’ll want on your side when you're done with guesstimates and ready to build a forecast you can actually stand behind 👇
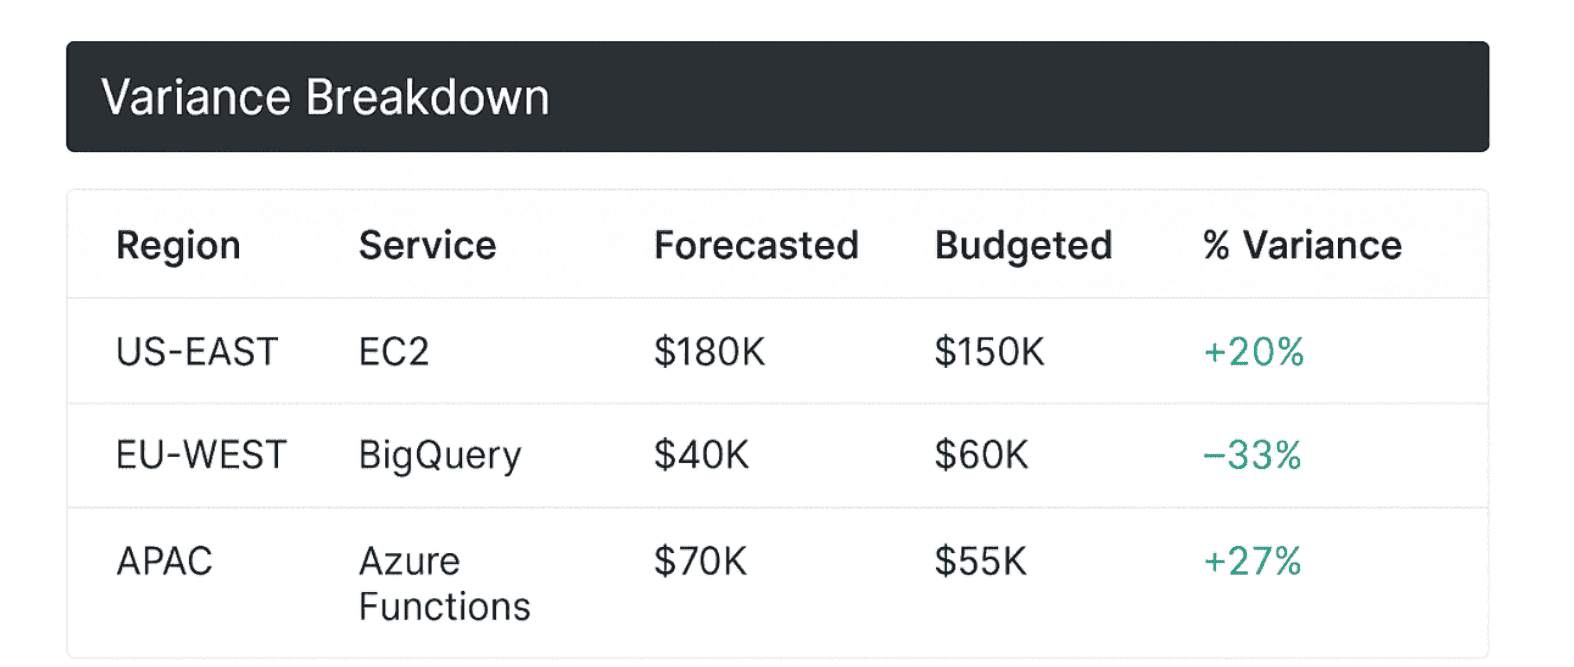
% Variance of budgeted vs. Forecasted spend
This KPI tracks the delta between your original cloud budget and your most recent forecast.
Not actual spend — just the gap between what you planned and what you expect to spend now that your services are scaling, shifting, and occasionally spiraling.
This KPI is all about control. If your forecast drifts too far from budget, it signals either unstable usage patterns or weak assumptions. That’s why it’s so important to identify trends early and align budget expectations with live pricing dynamics.
When that variance shows up unannounced in front of your CFO? That’s a cloud cost headache no one needs.
For organizations practicing FinOps at scale, this KPI plays a vital role in tracking financial accuracy and building executive confidence across business units and environments.
How to calculate it:

Track this monthly or quarterly, ideally at the team, account, or environment level.
💡 Benchmarks? A 5–10% variance is healthy in a walk-stage FinOps setup. Over 15%? You’re either underestimating, overcommitting, or both.
How Cloudaware services makes it happen:
Cloudaware integrates budget baselines into its reporting engine, then compares them daily against updated cloud forecasts based on billing data from AWS, Azure, and GCP. You’ll see real-time variance across services, environments, cost centers, and tags — visualized in dashboards you can filter by region, team, or cloud.
A part of the Cloudaware FinOps dashboard. Schedule a demo to see it live
You can export forecast vs. budget delta reports, schedule alerts when variance breaches thresholds, and trigger cost reviews before your numbers start slipping off-track.
In short? You don’t just catch the drift — you show up to every budget meeting already one step ahead.
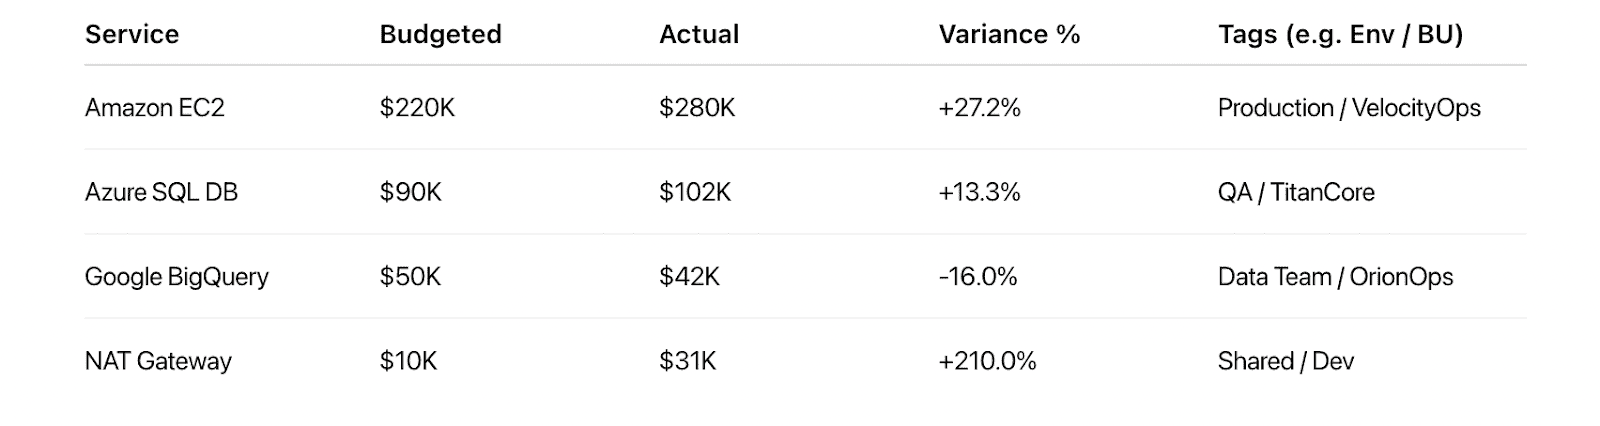
% Variance of Budgeted vs. Actual Spend
You’ve seen this play out — budget’s locked, the forecast looked solid, and two weeks into the quarter… cloud spend’s already blowing past what you promised finance.
That’s when % Variance of Budgeted vs. Actual Spend becomes your most important FinOps signal.
It tells you exactly how much your actual cloud usage deviated from your approved budget. And if you’re not tracking cloud spend, you’re operating in the dark.
This KPI measures trust. High variance erodes credibility with finance. Low variance builds it. It helps you validate assumptions, tighten future models, and flag scaling drift before it becomes a pattern.
Formula:

Use it monthly, quarterly, or by team/project. Apply filters by environment, tag, or service.
Benchmarks: Most teams in the walk stage aim for under 10% variance across production. If you’re breaching 15% repeatedly, it’s time to revisit your tagging integrity, usage forecasting, or burst-heavy workloads.
Iurii Khokhriakov, Technical Account Manager at Cloudaware:
How Cloudaware brings it together:
In Cloudaware every spend line is tied to a specific service, tag, or environment — so you don’t just see overage, you see its source.
Variance of Budgeted vs. Actual Spend report in Cloudaware. Schedule a demo to see it live
Dashboards show live variance trends by account, business unit, or project. You can schedule reports, set variance alerts (say 5% over plan), and trigger reviews automatically when drift crosses a threshold.
Read also: Augmented FinOps. How the Best Teams Scale with Automation
Forecast accuracy over time
This one’s not about a single spike or miss. Forecast Accuracy Over Time shows you if your FinOps engine is actually learning. It tracks how consistently your cloud spend forecast lines up with reality — across weeks, months, quarters. You’re not just watching a number — you’re watching a pattern. A trend. A confidence signal.
The magic here? Momentum. If your forecast accuracy is improving, it means your tagging is solid, your scaling patterns are predictable, and your teams are feeding you the right context. If it’s bouncing all over the place… you’ve got visibility debt hiding somewhere.
How to calculate it:

Run it per environment, per BU, per service. Then plot it monthly and look for stability.
Benchmarks from the field: 90%+ accuracy in prod means your forecasting muscle is mature. 80% across all clouds is a healthy baseline. Below 70%? Time to audit the data behind your confidence.
How Cloudaware supports your forecast accuracy maturity:
Cloudaware pulls actual cloud spend daily from AWS, Azure, and GCP, layering in CMDB context like business unit, environment, and owner. Forecasts are built from historical usage, then compared to real-time billing. You don’t have to build formulas — just open your Forecast Accuracy Trend dashboard and see where confidence holds and where it breaks.
Forecasted spend dashboard element. Schedule a demo to see it live
You can filter by project, cloud, or tag. Trigger alerts when accuracy drops below target. Export deltas by team for planning sessions. And if you want to map accuracy trends to specific cleanup efforts? You’ve got that too.
% Costs with defined owners
This one shows you who’s actually got skin in the game. % of Costs with Defined Owners measures how much of your cloud bill can be traced back to someone who’s responsible. Not “dev team 3.” Not “shared.” A person. A squad. A cost center with a Slack handle.
Why does it matter? Because without ownership, every budgeting conversation becomes a guessing game. And when actuals spike mid-quarter, the finger-pointing starts. This KPI gives you a clean map of accountability — so forecasts aren’t just numbers, they’re commitments.
How to track it:
Cloudaware continuously pulls resource metadata from AWS, Azure, and GCP and matches it against your CMDB. If the owner, team, or project tag is missing, it auto-fills it using predefined logic — from linked accounts, naming conventions, or service relationships.
Once enriched, the platform calculates this KPI using:

You’ll see the result in dashboards that break it down by cloud, business unit, tag key, or cost center.
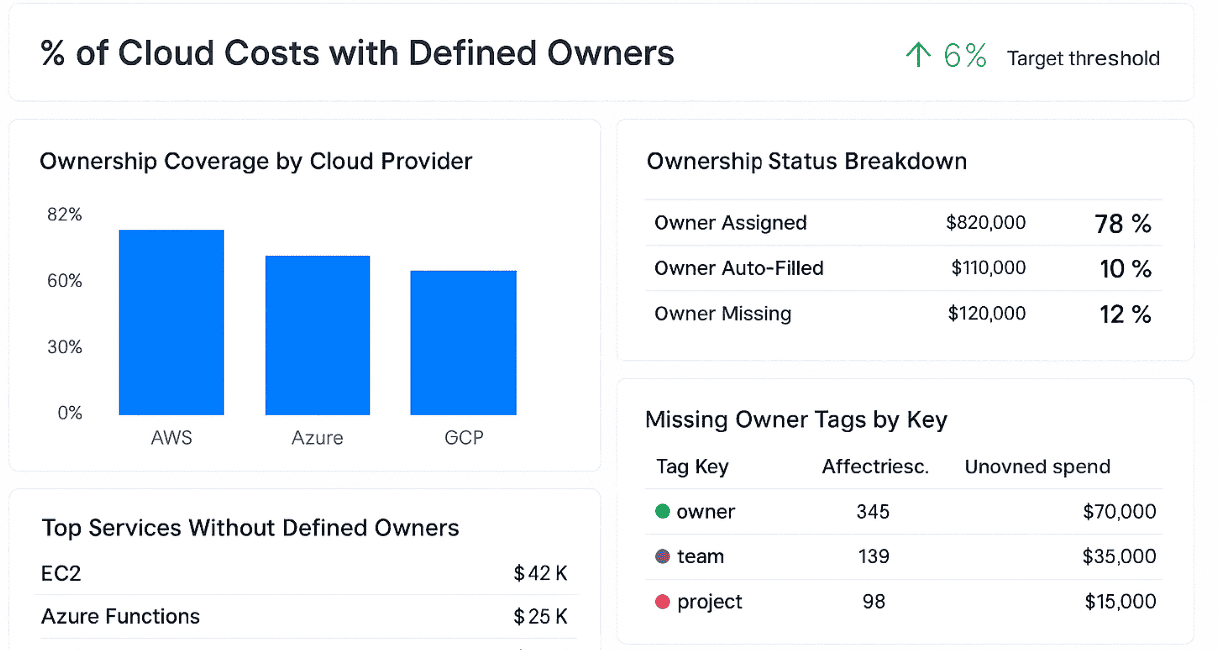
Cloudaware FinOps dashboard element. Schedule a demo to see it live
No manual tagging. No blind spots. Just traceable, accountable cloud costs — automatically.
Daria, ITAM expert at Cloudaware:
Business Unit/Team-Level Chargeback Accuracy
This metric tells you how much of your cloud bill is actually landing in the right hands — with the right explanation and the right data trail to back it.
When accuracy slips, budget reviews turn into blame sessions. Forecasting? Totally off. And optimization? No one’s doing it if they don’t believe the cost belongs to them.
It measures the percentage of your cloud spend that’s correctly and confidently allocated to the team, product, or BU that used it.
Cloudaware applies tagging logic, account mappings, and usage policies to distribute every cost line item to its rightful owner.
If something can’t be traced, it’s flagged instantly.
Formula:

You’ll see allocation breakdowns by tag, account, project, service, or environment — and whether the chargeback actually matches what the BU expected.
Anna, ITAM expert at Cloudaware:
Chargeback is where strategy meets reality. If your numbers aren’t defensible at the BU level, your entire FinOps pipeline starts to unravel. This metric keeps your budgets honest, your forecasts clean, and your cost accountability rock solid.
How well are we using what we’ve provisioned?
Your autoscaling group scaled out — again. A dev team requested another node pool. And those GPUs in staging? Still sitting at 7% utilization, quietly eating budget. You’ve got dashboards, you’ve got thresholds — but the real question still lingers: how well are we using what we’ve provisioned? This isn’t just about overspend — it’s about performance alignment, capacity planning, and giving finance a cost profile they can actually back.
Let’s break down the FinOps KPIs you’ll want on your radar when usage and spend feel out of sync — and you’re ready to tighten the gap with data, not guesswork.
CPU/Memory Utilization Rates
Just because it’s provisioned doesn’t mean it’s earning its keep. CPU/Memory Utilization Rates measure how efficiently your cloud resources are actually used, compared to what’s allocated. VMs, node groups, container clusters — you might’ve spun them up for a spike, a batch job, or just in case. But if they’re sitting idle at 11% CPU and barely touching memory, your forecast is padded with waste.
This KPI shows how much of your compute power is really driving value — and where to scale back without touching performance. It’s one of those metrics that engineering teams respect and finance finally understands.
Technical Account Manager Iurii Khokhriakov:
You’ll want to track this KPI continuously — especially when forecasting long-term workloads, reviewing RI/SP commitments, or preparing budgets by business unit. Low utilization rates often mean the workload’s oversized, poorly scheduled, or overcommitted. This KPI keeps your cost-to-performance ratio honest.
With Cloudaware, it’s all visible. Usage data feeds into utilization dashboards, layered with CMDB context like application, owner, and environment. You can filter by tag, drill into spend vs. usage efficiency, and trigger alerts when thresholds dip below defined policies.
IOPS and storage utilization
This KPI tracks how much of your provisioned storage and throughput you’re actually using — so you’re not forecasting based on capacity that’s just sitting there.
What makes it a must-watch? Because misaligned storage hits hard and hides well. Whether it’s test environments holding SSD volumes or a data pipeline over-indexing on performance, underutilized capacity silently bloats your forecast and buries savings potential.
When you track it, you can right-size confidently — and turn “provisioned” into “optimized.”
Here’s how it works in Cloudaware:
Cloudaware ingests provisioned specs from AWS, Azure, and GCP — block, object, and file storage — then overlays actual usage from telemetry like CloudWatch or Azure Monitor. It connects that to your CMDB: team, app, env, business unit. Everything gets context.
You’ll see utilization like this:
- Storage:
(Used GB / Provisioned GB) × 100 - IOPS:
(Avg. IOPS / Provisioned IOPS) × 100
Track this by region, SKU, tag, or project — and set alerts when efficiency drops below your policy thresholds.
So when your forecast review’s coming up and storage looks off, don’t guess. With Cloudaware, you’ve already got a full view — volumes, throughput, tags, and cost-to-performance ratios in one place. This metric helps you stop overspending on potential and start budgeting for reality.
% of Underutilized Instances
Okay, so you’ve got your budget forecast dialed in, your RIs locked, and the execs are expecting clean numbers. But something still feels… bloated.
You dig into your compute spend, and boom — there they are. Instances coasting at 10% CPU, humming quietly in the background like forgotten smart lights left on in an empty house.
That’s where % of Underutilized Instances saves your forecast (and sanity).
This KPI shows you exactly how much of your compute footprint — EC2s, VMs, node groups — is overprovisioned. It’s the stuff that looks busy in your asset inventory but barely moves the needle on actual usage. Great if you love paying for potential. Not so great if you’re trying to build a budget that doesn’t get laughed out of the room.
These underused resources distort everything — your cost models, your commit planning, your RI/SP coverage logic. Track them, and suddenly you're not just reporting waste. You’re preventing it from becoming someone else's problem down the line.
How Cloudaware does the math:
It collects daily instance metadata from AWS, Azure, and GCP. From there, Cloudaware overlays CMDB context — owner, env, service, commit coverage, even app tier — to surface the stuff that’s oversized for what it’s actually doing.
Here’s the formula (don’t worry, Cloudaware calculates it for you):

You can break it down by tag, region, instance family, business unit — you name it. And yeah, we show you the cost of every zombie VM that’s been running without purpose for months.
Anna, ITAM expert at Cloudaware:
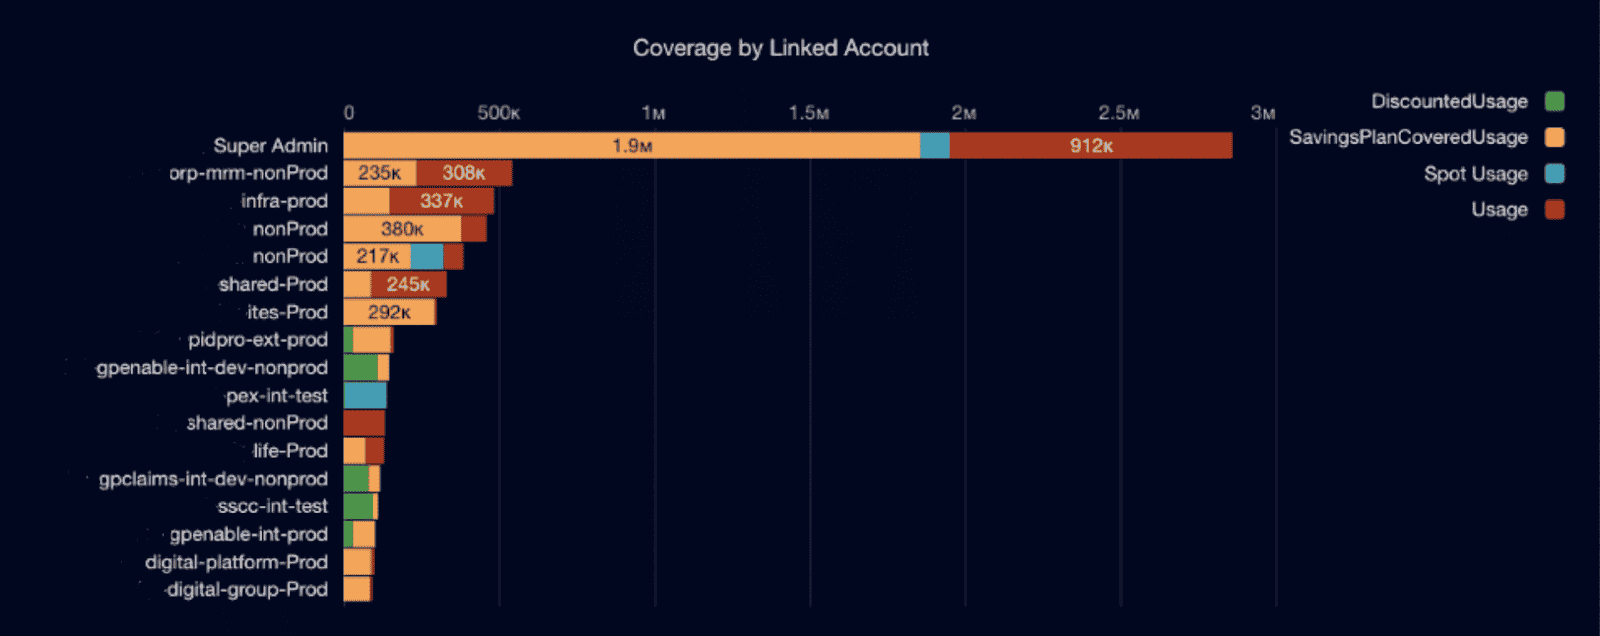
% of Reserved capacity consumed
This is your go-to KPI for checking if your commitments are pulling their weight. It shows how much of your reserved compute capacity — via RIs or SPs — is actually being used.
Not bought.
Not booked.
Used.
This isn’t about deal math. It’s about alignment. Because unused commitments mean money down the drain, while undercommitting means you’re paying more per hour than you should. The real win? Getting this number as close to 100% as possible, without locking in workloads you can’t predict.
Here’s how Cloudaware makes it all click:
It pulls hourly RI/SP utilization data from AWS, overlays that with real-time usage across accounts and instance families, and adds rich CMDB context — env, owner, app, business unit. That’s how you move from “we bought it” to “we’re using it where it counts.”
Cloudaware FinOps dashboard element. Schedule a demo to see it live
% of Non-Compliant Auto-Scaling Configs (optional, advanced)
This KPI measures how many of your auto-scaling configurations are violating predefined policies. Think: missing tags like owner or environment, misaligned thresholds, or stale configs cloned from legacy projects. It shines a light on scaling policies that look fine on paper but silently overrun costs in the background.
And in fast-moving, multi-cloud environments? Those missteps add up. Fast.
Auto-scaling is supposed to align usage with demand. But when the logic behind it goes unchecked — dev teams hardcode min/max values, forget to apply policy-compliant launch templates, or leave scaling rules wide open — you’re left with inflated budgets, skewed forecasts, and zero cost accountability.
How Cloudaware handles it:
Cloudaware scans auto-scaling configurations daily across AWS ASGs, Azure VM Scale Sets, and GCP MIGs. It checks each against your custom logic in the Compliance Engine — like enforcing owner, env, or cost-center tags, validating expected scaling thresholds, and comparing against baseline usage trends pulled from monitoring tools.
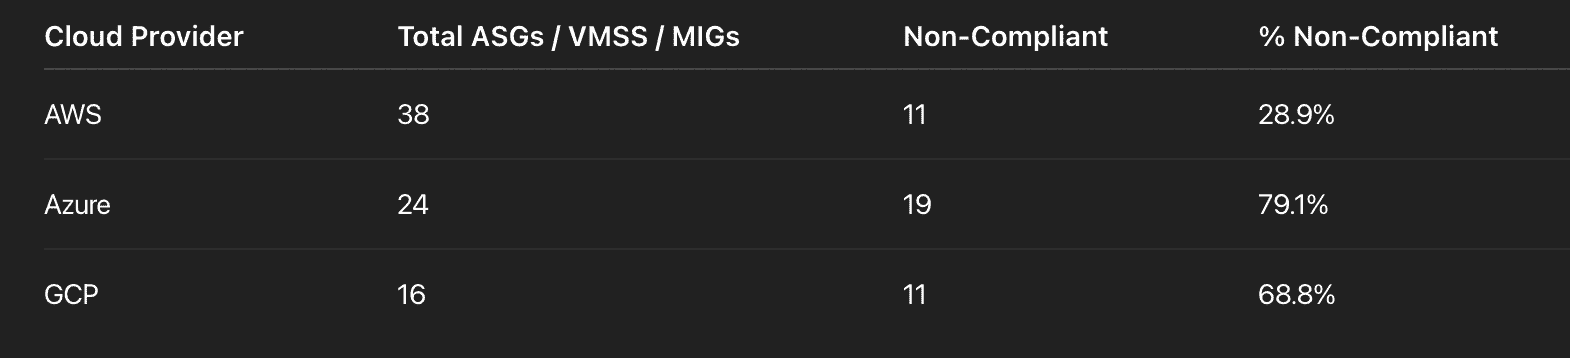
A part of the report on Non-Compliant Auto-Scaling Configs. Schedule a demo to see it live
But it’s not just numbers. You get full visibility: what failed, where, who owns it, and how much it’s costing you.
Anna, ITAM expert at Cloudaware:
Are our people and processes FinOps-ready?
It’s not just about spinning up reports — it’s about people. Do engineers know their cost levers? Are owners tagged? Is your review process more than a calendar reminder?
Let’s dig into the FinOps KPIs that’ll show you if your cloud financial management setup is built to scale — or just held together with duct tape.
Recommended KPIs 👇
% of FinOps personas certified or trained
So, the tagging’s been standardized. The dashboards are live. And yet — you’re still getting “what’s RI coverage?” during a quarterly review.
That’s where % of FinOps Personas Certified or Trained kicks in.
This KPI tracks how many of your key stakeholders — engineers, product owners, finance leads, platform teams — have completed FinOps training or certification that equips them to make smart, real-time decisions about cloud usage and cost.
Because let’s face it: processes don’t run themselves. If your people don’t understand allocation, anomaly detection, or commit strategies, automation becomes noise, not signal. This KPI tells you whether your org has the operational muscle memory to back up your FinOps tooling.
In practice, it’s not about everyone becoming a FinOps pro. It’s about building shared language and minimum viable literacy — so when a dev team sees spend spike, they know whether to check CPU usage, tag coverage, or container scale out. This KPI connects human readiness with system reliability.
% of Costs with ownership tags
It always starts the same way: you’re prepping a monthly cost review, filtering the top 10 line items, and boom — half the spend is tied to null, unknown, or some auto-generated tag that means absolutely nothing to anyone.
That’s why Cloudaware clients track % of Costs with Ownership Tags. This KPI tells you how much of your cloud bill is explicitly linked to someone who’s responsible — through a clean, consistent owner tag or Cloudaware’s mapped attribution logic.
This isn’t about tagging for tagging’s sake. It’s about operational clarity. Because when a resource has an owner, it has a steward — someone to ask before scaling up, someone to alert during anomaly detection, someone who shows up to the QBR with answers. That’s how FinOps becomes a team sport.
And if your ownership tagging is weak? You’re not just losing visibility — you’re handing optimization opportunities to the void.
In Cloudaware, this metric doesn’t rely on perfect tag hygiene. The system pulls cloud billing data and automatically enriches it with CMDB context: linked accounts, IAM users, service hierarchies, even GitHub commits if you’ve integrated that far. Ownership is inferred where it’s missing, and enforced where it matters.
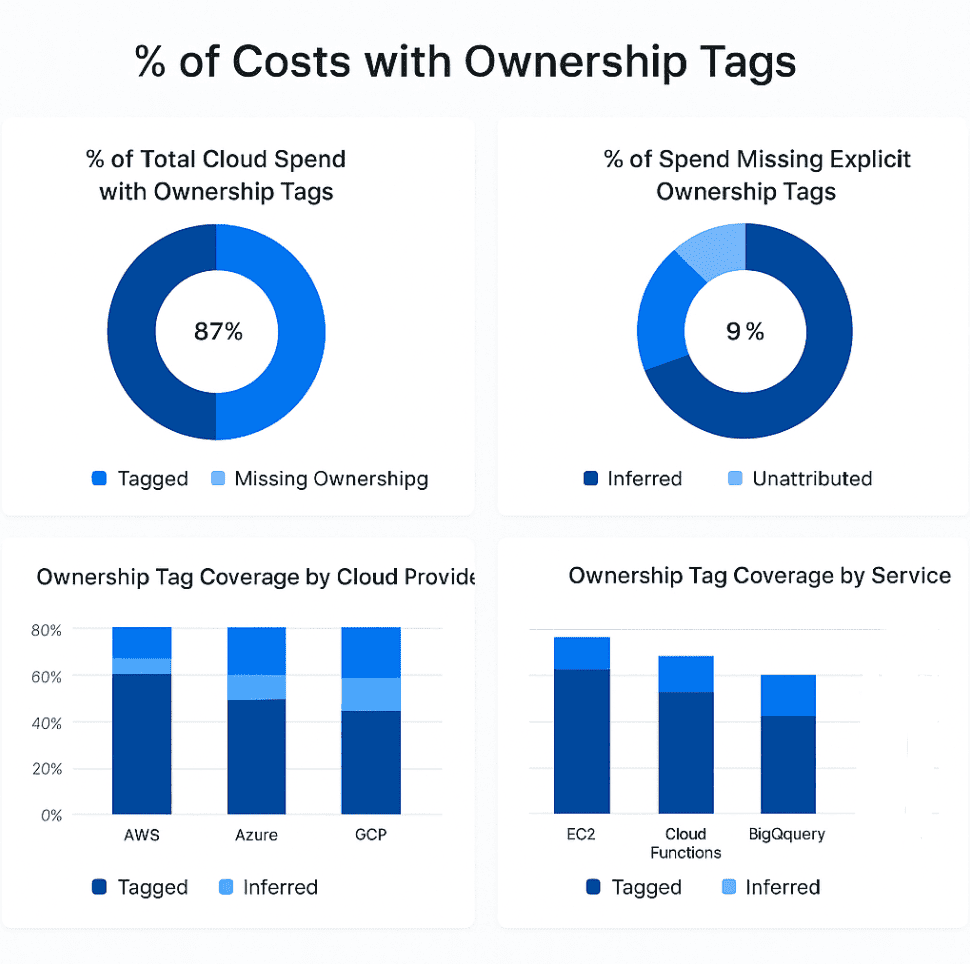
% of Costs with ownership tags report in Cloudaware. Schedule a demo to see it live
You can monitor this per project, environment, or BU, and build alerts when coverage slips. Dashboards show trends, exceptions, and the percentage of spend that still needs a human fingerprint.
Mikhail Malamud Cloudaware GM:
% of Policy compliance (e.g. tagging, scheduling)
This KPI tracks how many of your active cloud resources follow your FinOps policy standards — things like required tagging (owner, application, cost-center), power scheduling for non-prod environments, autoscaling guardrails, or naming conventions for billing clarity.
It’s your reality check. Because even with the right tools in place, if resources are launched without the guardrails, cost control becomes guesswork. High policy compliance means your automation actually works, cost allocation is clean, anomaly detection is traceable, and optimization workflows can run without manual babysitting. This metric shows whether your organization is doing FinOps by design — or hoping it all holds together.
How Cloudaware calculates it:
Cloudaware continuously evaluates every provisioned resource across AWS, Azure, and GCP against the rules defined in your Compliance Engine. These aren’t just basic checks — teams configure detailed logic, from required owner+env tag combinations to allowed instance SKUs by region, or daily power-off requirements tied to environment type.
Compliance dashboard in Cloudaware. Schedule a demo to see it live
Violations are logged per policy, resource type, tag key, or team, then fed into dashboards or sent to remediation workflows. This lets platform teams prioritize what’s broken and where it’s costing you.
Kristina, Seniour ITAM expert at Cloudaware:
Are we getting real savings from cloud migration?
You migrated. The workloads are running. But now leadership wants proof — not estimates, not projections — real, validated financial savings. And suddenly, your cloud bills aren’t matching the business case slide deck. You’ve got unit costs shifting across services, tooling that wasn’t decommissioned, and shared resources no one’s taken ownership of. You know the spend, but do you know the impact?
That’s where the right FinOps KPIs step in. Let’s break down the metrics that tell you — clearly and defensibly — whether your migration delivered actual costs savings and whether your financial management strategy is moving in the right direction.
Total migration cost savings
This one’s for when your CFO raises an eyebrow and says, “So… remind me why we moved that workload to the cloud again?” Enter Total Migration Cost Savings — the KPI that gives you receipts. It tracks how much actual money you’ve saved since moving a workload from your legacy setup into the cloud. Not the fluffy estimated savings. The real stuff. The stuff that shows up on a bill.
What makes it matter? Because cloud migrations look great in pitch decks, but unless you’re measuring FinOps outcomes — before and after — you’re flying blind. This metric helps you prove ROI, validate those early planning assumptions, and know which migration patterns actually paid off.
In Cloudaware, we help you tag workloads by migration phase, capture the pre-cloud cost baselines (think: your monthly infra spend from legacy cost centers), and compare them to actual cloud billing data post-move — pulled from AWS CUR, Azure EA, or GCP billing exports. You can account for RIs, SPs, discounts, and utilization shifts, all in one place.
Here’s the core calculation:

In Cloudaware, you’ll see this per workload, per team, per region — even split by wave if you’re doing phased migrations. You can layer it with utilization data to tell if the savings came from right-sizing or just dropping zombie resources on the way out. And because it’s all integrated into the Cloudaware CMDB, it works with your monitoring, tagging, and cost allocation pipelines.
Daria, ITAM expert at Cloudaware:
Legacy Infra Cost vs. Cloud Cost
This KPI shows how much your cloud cost per unit of usage has changed post-migration or re-architecture — after you account for differences in resource types, scaling behavior, and actual utilization. It’s not about raw cloud bills — it’s about what you're paying for what you're really using.
Why it matters? Because without normalization, that EC2-to-Fargate shift might look like it got more expensive, even if it's performing way better or using fewer resources. This metric clears up that fog and gives you a clean, value-aligned view of your cloud cost trends over time — helping organizations identify where performance and pricing have truly improved.
Here’s how Cloudaware handles it:
You define your “unit of delivery” — vCPU hour, memory GB hour, storage throughput — and Cloudaware tracks historical and current costs linked to actual usage. It pulls from AWS CUR, Azure billing data, or GCP exports, layering in CMDB context like app, team, env, and commit coverage.
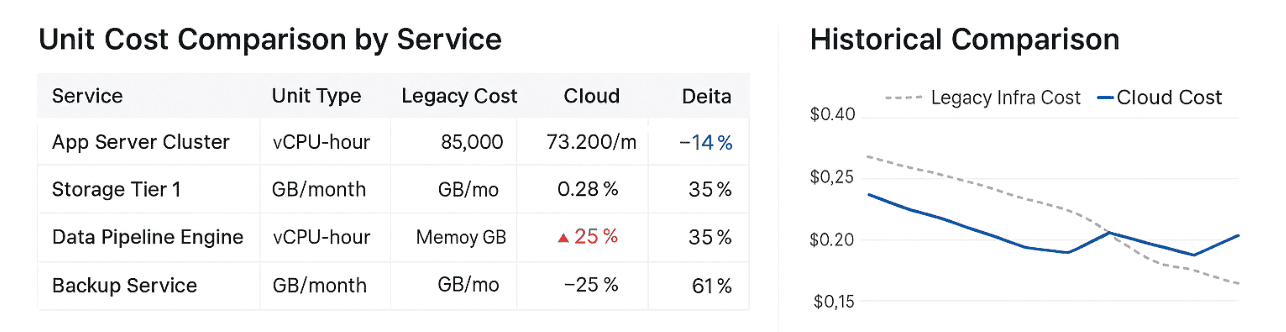
Elements of Cloudaware report on Legacy Infra Cost vs. Cloud Cost
You can scope this per service, cloud, business unit, or environment — and even set it up to flag deltas that exceed a defined variance.
Kristina, Seniour ITAM expert at Cloudaware:
Shared Tooling Cost Reduction Post-Migration
This KPI tracks how much your team has cut spending on shared cloud services and tooling after a migration or architecture shift. That includes CI/CD pipelines, monitoring platforms, logging systems, and other services used across multiple teams or environments.
Post-migration, many of these shared tools become redundant, over-provisioned, or simply forgotten. But the cloud spend stays. This KPI helps you quantify what’s been decommissioned, replaced, or right-sized — and whether platform consolidation is actually saving money.
It’s especially useful in setups where tooling costs are scattered across projects but rarely tied to actual usage. Instead of guessing what’s still needed, you can measure it and clean it up.
Here’s how Cloudaware makes it measurable:
Cloudaware identifies shared services using tags like shared=true, tooling=yes, or platform=core. When tagging isn’t available, it infers shared patterns from deployment scope and CMDB context. It then compares pre- and post-migration cloud spend, aligned to billing periods and usage data.
Formula:

You can filter results by function — monitoring, build, observability — or group by region, environment, or team. Dashboards highlight which services shrank, which remained flat, and which are still flying under the radar.
Anna, ITAM expert at Cloudaware:
What FinOps KPIs need exactly your organization?
Start by zooming in on your active FinOps processes. Are you knee-deep in chargeback friction? Struggling to prove cost efficiency post-migration? Drowning in commit discounts that no one’s tracking? Each of those pain points directly to the KPIs you should care about. If resources are getting spun up with zero attribution, focus on % of Costs with Ownership Tags.
If your financial forecasting is more guesswork than strategy, it’s time to monitor % Variance of Forecasted vs. Actual Spend.
At Cloudaware, we define relevant FinOps KPIs by looking at your current maturity across workflows like allocation, optimization, forecasting, and readiness.
Then we factor in architectural context: managing auto-scaled workloads in GKE? RIs and SPs in AWS? Event-driven APIs in Azure? Your cloud architecture shapes which KPIs actually reflect reality — and which ones just add noise.
Then comes the stakeholder layer. If cost center coverage is weak, chase KPIs that improve visibility. If your dashboards are sharp but shared tooling costs are creeping up, track something like Shared Tooling Cost Reduction Post-Migration.
This isn’t about tracking for the sake of it. It’s about choosing KPIs that help your teams make decisions, not just fill reports. So align them with your cloud financial management goals, your operational blind spots, and how ready your organization really is to act on that data.
Best practices for using FinOps KPIs effectively
Here are some device from my teammates who spent yours in the field 👇
Don’t track everything. Start with 3–5 KPIs that match your biggest challenges
Measuring FinOps isn’t about tracking every metric you can fit into a dashboard. It’s about turning financial signals into decisions that actually shape your cloud reality.
So here’s the move: start with 3 to 5 FinOps metrics that directly map to your current problems. If engineering teams can’t see their spend? Start with % of Cloud Spend Allocated.
If your forecasts are never close? Look at % Variance of Forecasted vs. Actual Spend.
If tagging is chaos? Yep — track % of Costs with Ownership Tags.
Each of these KPIs ties to a workflow — chargeback, budgeting, waste cleanup, team accountability. You’re not just tracking numbers. You’re improving processes. That’s what real financial management in the cloud looks like.
So don’t try to measure it all. Just measure what matters right now. The rest can wait until your dashboards earn their spot in someone’s decision-making loop.
Automate collection and alerts — manual Excel won’t scale
If you're still wrangling FinOps KPIs with color-coded Excel tabs and screenshot-heavy reports, it’s time to upgrade your life. Because in a multi-cloud world, manual KPI tracking breaks the moment your environment scales faster than your spreadsheet formulas.
Cloud costs move daily. So do your environments, usage patterns, and ownership tags. By the time you finish your Excel pivot table, another autoscaling group just spun up 200 instances with zero metadata. That’s not financial management — that’s firefighting blindfolded.
The real flex? Automating KPI collection and alerts. Use a system that pulls fresh billing data, validates tag coverage, maps ownership, and pings you the moment spend drifts off track. Cloudaware does this natively — dashboards update in real time, and alerts fire when thresholds or policies break. So instead of building spreadsheets, you're building guardrails.
Because tracking FinOps KPIs isn’t just about visibility — it’s about velocity. And you can’t move fast if you’re stuck copy-pasting columns.
Read also: Choose an ideal ITAM software: Top 15 asset management tools
Tie KPIs to team goals and outcomes
Here’s the FinOps truth nobody tattoos on a JIRA board — KPIs only matter if they’re tied to actual outcomes. Tracking metrics for the sake of tracking? That’s not strategy, that’s dashboard theater.
If your team’s pushing for cost optimization, then your FinOps KPIs need to reflect that with precision. Don’t just monitor “waste” — tie it to something that gets funded, prioritized, and acted on. Think: “Reduce idle resource spend by 20% by Q3,” or “Increase tagging compliance to 90% across production accounts by end of sprint.” Now that’s a KPI with teeth.
You’re not just surfacing data. You’re driving strategic cost decisions across engineering, finance, and platform ops. So before you add another chart to the dashboard, ask yourself: Is this metric giving someone the insight they need to hit their goal faster, cleaner, or smarter? If not — ditch it or reframe it.
FinOps KPIs are not status checks. They’re levers. Pull the ones that move the business.
Read also: Cloud Cost Optimization Framework - 11 Steps to reducing spend in 2026
Revisit metrics quarterly — as your cloud and org mature, so should your KPIs
Your KPI measures aren’t carved in stone. They’re only as valuable as the context you’re operating in. And that context? It changes fast in the cloud.
New workloads launch. Teams adopt different architectures. Finance shifts how it views cloud expenses. And suddenly, the metrics you picked six months ago? They’re either outdated or missing the real story.
That’s why I always tell my clients: revisit your KPIs quarterly. Seriously — build it into your FinOps rhythm. Ask:
→ Are we still answering the right questions?
→ Are our tags mature enough to support deeper allocation?
→ Have optimization or forecasting goals changed?
As your org levels up — more automation, better tagging, stronger ownership — you unlock space for more advanced KPIs: coverage accuracy, discount waste, shared cost allocation, forecasting confidence.
Your cloud evolves. Your KPIs should, too. Otherwise, you're measuring the past while flying into the future.
Read also: How to use FinOps framework. Top 10 mistakes & their fix
Track your FinOps metrics with Cloudaware platform
If you’ve ever tried measuring FinOps across multiple clouds using five different tools and twenty tabs — welcome to the chaos. When you’ve got AWS, Azure, GCP, OCI, and even VMware Cloud all in play, it’s nearly impossible to get clean visibility into your cloud expenses, let alone make real-time decisions. Every team has their own dashboard, your KPIs don’t align, and finance? They just want answers without decoding raw billing exports.
So here’s the shift: Cloudaware FinOps.
It’s the platform I wish I had when I was knee-deep in disconnected usage reports and budget overruns. With Cloudaware, you’re not juggling tools. You’re running one powerful engine that does real-time discovery, maps usage to financial ownership, and actually makes tracking FinOps feel… well, manageable.
Here’s what makes Cloudaware your FinOps secret weapon:
- ✅ Supports all five clouds: AWS, Azure, GCP, Oracle Cloud (OCI), and VMware Cloud
- ✅ Pulls in billing exports, usage data, tag policies, and more
- ✅ Works seamlessly with native cost tools: AWS CUR, Azure EA, GCP BigQuery exports
- ✅ Runs on real-time CMDB-powered discovery (no stale inventory, ever)
- ✅ Automatically detects missing or inconsistent tags — and can even fix them for you
- ✅ Generates fully scoped reports by team, service, account, or business unit
- ✅ Tracks both blended and unblended costs, commitment discounts, shared services
- ✅ Keeps your KPI measures aligned with your financial management goals
- ✅ Integrates with ITAM records so platform and FinOps teams speak the same language
- ✅ Feeds curated dashboards for execs, engineers, finance, and platform leads
And those dashboards? Absolute gold. Tracking FinOps becomes less about cleaning up messy data and more about acting on insights. Want to report on % of Cloud Spend Allocated, Forecast Accuracy, or Waste by Team? Cloudaware gives you one-click reports, with ITAM context baked in — thanks to that CMDB backbone. No more pinging six people for a cost breakdown.