


You’re hammering out next quarter’s cloud budgets, trying to reconcile GCP’s flaky discounts, Azure EA commitments, and an AWS anomaly that just nuked your forecast — all while engineering’s spinning up untagged resources like popcorn.
Sound familiar?
This isn’t about memorizing some glossy FinOps principles list. It’s about making them work for your environment: your thousands of accounts, daily spend variances, compliance reports that keep security breathing down your neck.
So here’s the gold — we’ll unpack each principle’s nuances straight from Cloudaware experts, built on the hard lessons we’ve learned with multi-cloud clients.
What’s on deck:
- Break Down Silos with Cross-Functional Cloud Ops
- Steer Spend by Business Objectives, Not Just Cost
- Drive Local Accountability for Cloud Usage
- Build on Timely, Granular, Trustworthy Data Streams
- Establish a FinOps Center of Excellence Without Killing Velocity
- Master Cloud’s Variable Cost Model with Commitments & Flexibility
- Automate Allocation, Tagging, and Optimization at Scale
- Balance Speed and Cost — Don’t Hobble Innovation
Key insights on 6 FinOps principles
- Teams need to collaborate. FinOps dies in handoffs. Put finance, engineering, and product on the same loop for spend reviews, tagging gaps, and commitment decisions; otherwise, you get month-end blame instead of mid-week fixes.
- Business value drives technology decisions. Don’t optimize for "cheapest"; optimize for outcomes. Cost per transaction, cost per active user, cost per environment: pick the unit that matches how the business wins, then let teams trade performance vs. spend with eyes open.
- Everyone takes ownership for their technology usage. If only a central team “owns” the bill, engineers keep shipping cost regressions by accident. Increase visibility for those who can change infrastructure today, and ensure ownership is integrated into their normal workflow rather than presented in a quarterly deck.
- Take advantage of the variable cost model of the cloud. Cloud is elastic; your bill should behave like it. Scale patterns, commitment planning, and rightsizing are the same story: match capacity to real demand, then stop paying premium rates for predictable baselines.
- FinOps should be enabled centrally. Central doesn’t mean “centralized approvals.” It means one place defines standards, guardrails, allocation rules, and reporting so teams move faster without reinventing tagging taxonomy or arguing about rate sources every sprint.
- FinOps data should be accessible, timely, and accurate. If your cost data shows up late or can’t be trusted, you’ll spend the meeting debating numbers instead of making decisions. Treat data quality like a production dependency: validate pipelines, reconcile totals, and keep the dataset usable for engineers, not just finance.
Everything below is downstream of collaboration. If the right people don’t share context early, you can have perfect dashboards and still ship waste at scale. Let’s start where the framework starts 👇
1. Teams need to collaborate - Align Finance, Engineering, and Product teams workflow
If there’s one of these FinOps principles that can make or break your entire cost strategy, it’s this one. I’ve seen plenty of large orgs with beautiful dashboards and cost anomaly alerts still get blindsided by six-figure cloud surprises.
Why? Because finance, engineering, and product weren’t really in sync.
In complex multi-cloud setups, collaboration is what keeps your cloud costs, delivery velocity, and business growth moving in the same direction. It’s how you stop finance from forecasting based on last quarter’s steady spend while engineers spin up new ML workloads, and product launches features that double your compute overnight — all without telling anyone.
Here’s how to build serious collaboration muscle using Cloudaware as your FinOps backbone
👉 Establish cross-functional cadences powered by data from Cloudaware
Set up monthly FinOps syncs (or bi-weekly if you’re moving fast). Use Cloudaware’s cross-cloud dashboards to walk finance, engineering, and product through daily spend trends, RI/SP utilization, and upcoming forecast deviations.
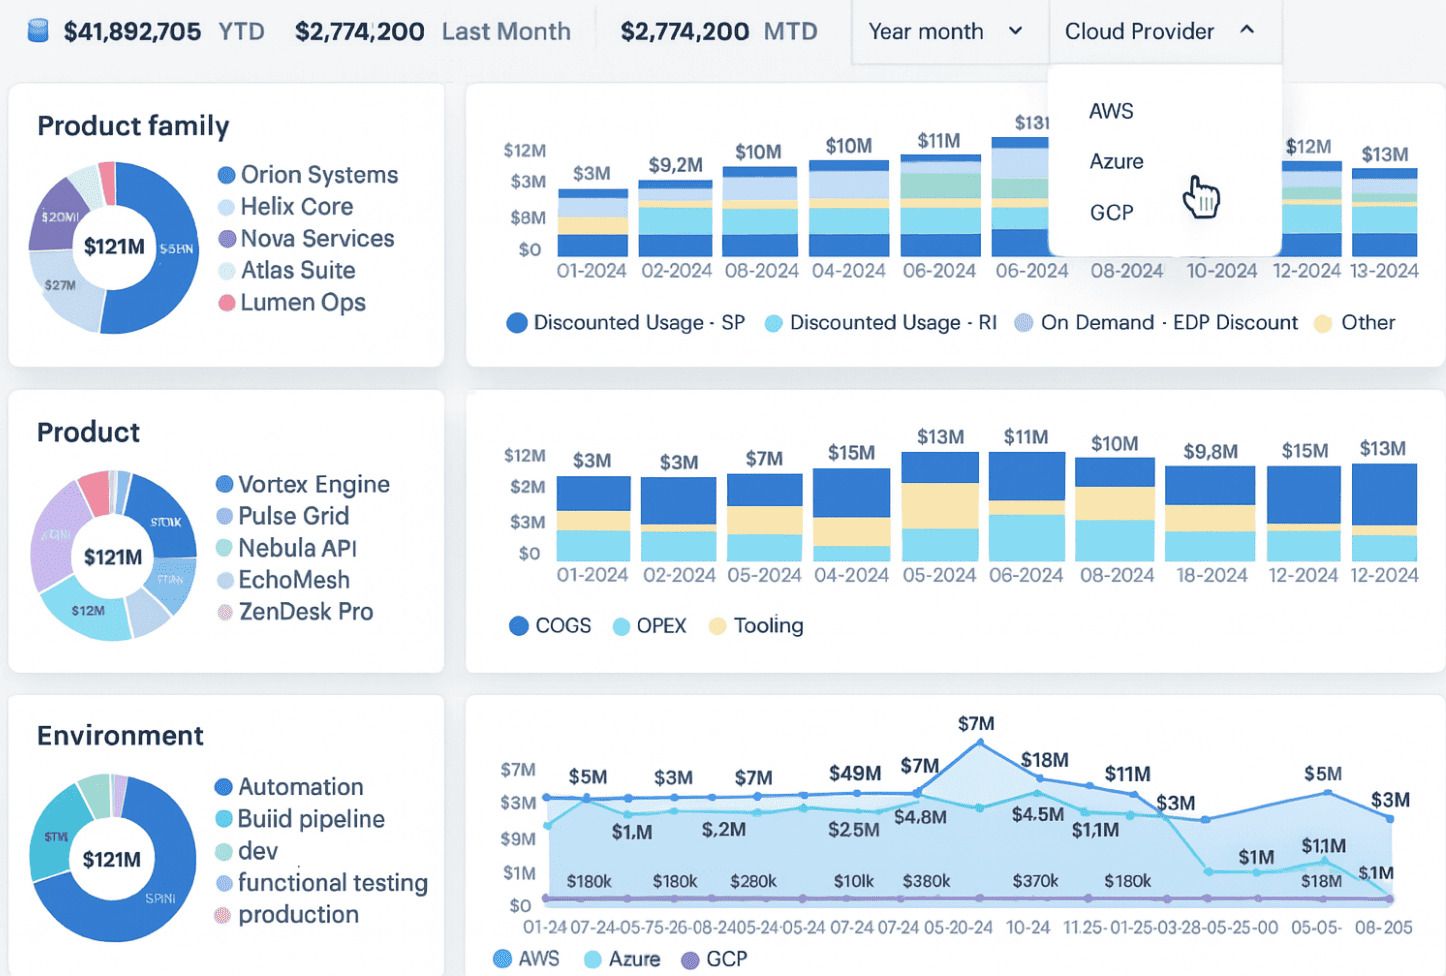
FinOps dashboard in Cloudaware. Schedule a demo to check it live.
Pull “cost by business unit” or “cost by app” slices right out of Cloudaware’s advanced reports so everyone’s looking at the same trusted source of truth.
👉 Enforce tagging completeness with Cloudaware’s CMDB + Compliance Engine
You might not be able to block deploys in CI/CD from Cloudaware itself, but it will catch anything missed immediately after. Set policies in the Compliance Engine to flag resources missing critical tags like BusinessUnit, Environment, or Owner. Cloudaware will generate non-compliance reports — your FinOps team can share these directly with engineering to fix gaps before finance runs allocations.
👉 Use Cloudaware dashboards to hand ownership back to teams
Spin up dashboards by team, app, or environment so owners see their spend, idle resources, and anomalies daily. Schedule automated reports emailed straight to engineering and product leads — no more monthly data chases.
👉 Automate the watchtower work
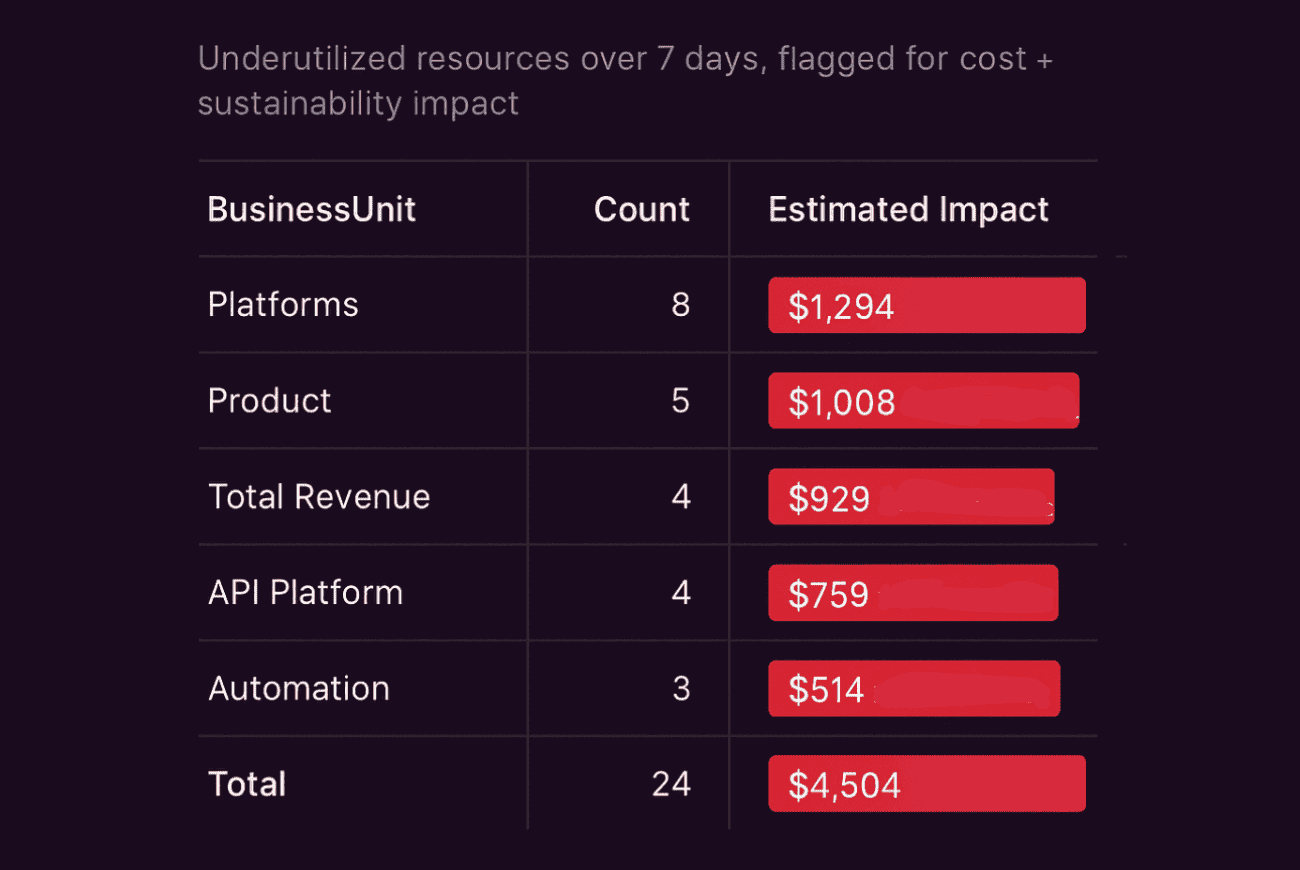
Set up Cloudaware policies to detect idle resources (like EBS volumes unattached for 10+ days), underutilized RIs or Savings Plans, or daily spend anomalies.
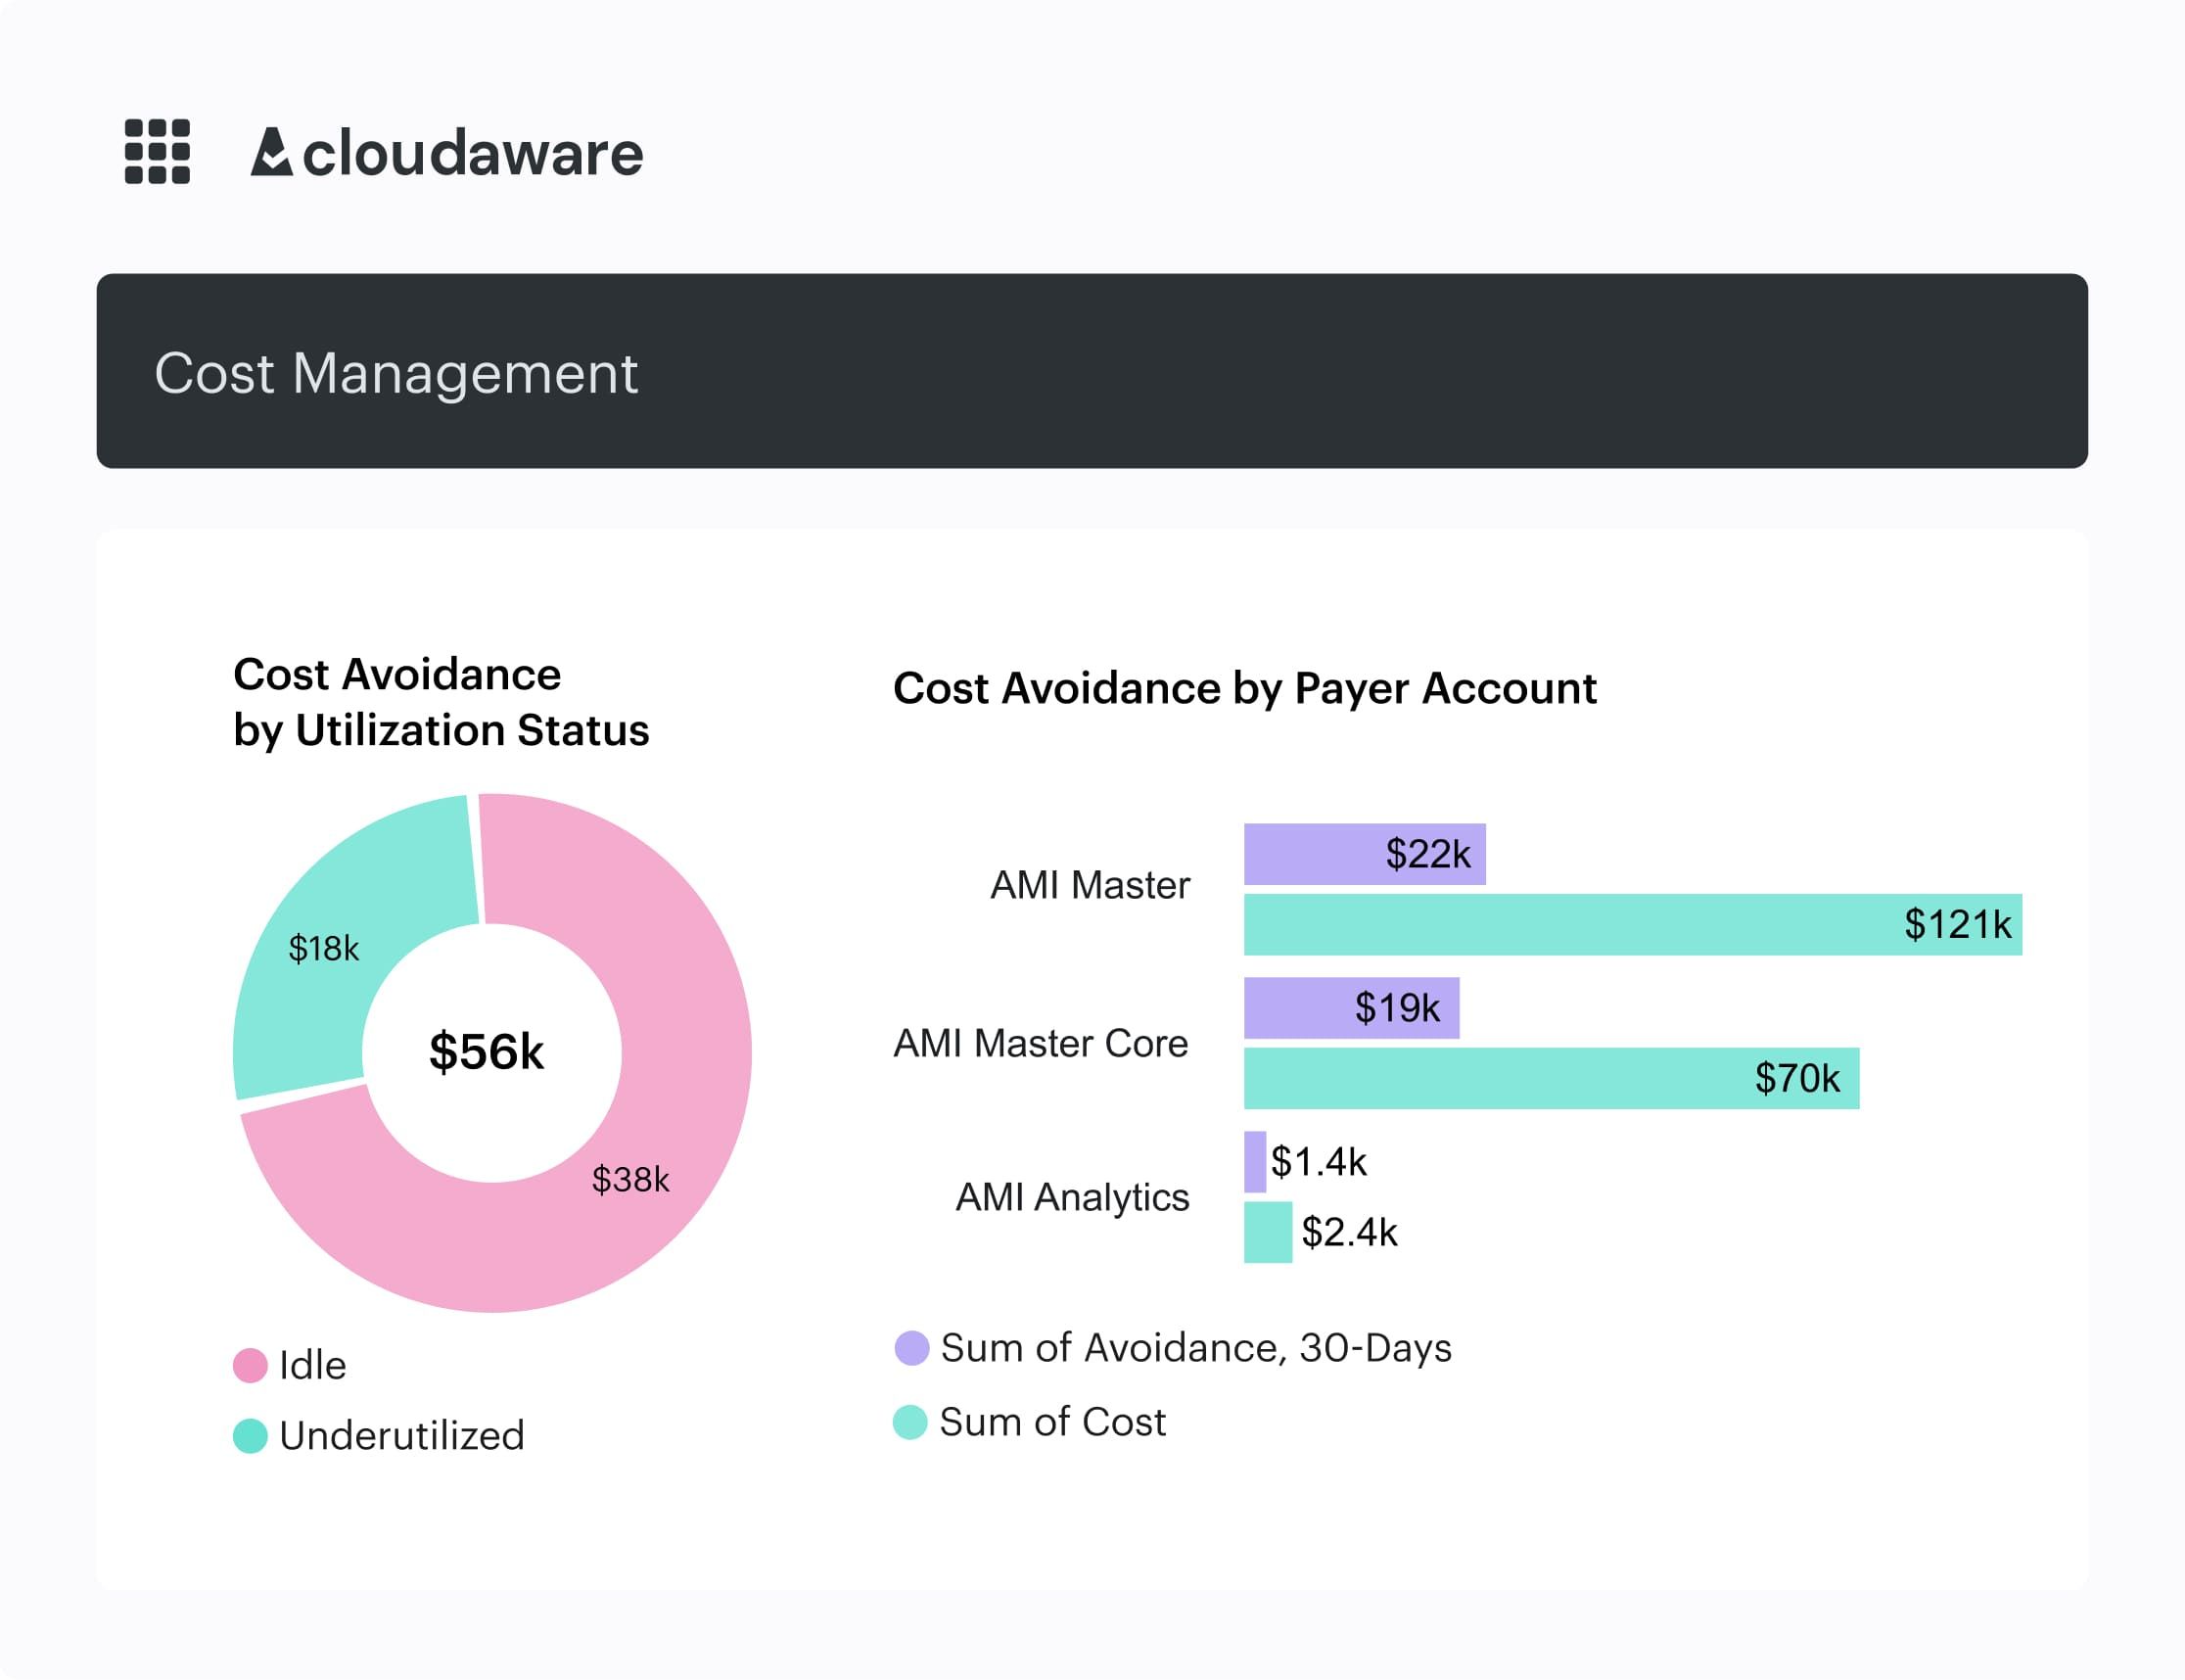
Idle resources dashboard in Cloudaware. Schedule a demo to check it live.
The Compliance Engine can notify the right teams via tickets or emails. This way, your FinOps CoE doesn’t spend cycles policing — they just facilitate and coach.
👉 Run your CoE as a friendly partner, not a blocker
Cloudaware’s central view means your FinOps team can manage RI/SP coverage and utilization across all accounts and clouds. They can surface insights like, “Hey team, we’re at 60% RI coverage this quarter, we can safely lock another $200k in savings.” Use Cloudaware’s historical reports to show how past product launches impacted costs, building smarter forecasts together.
Signals of successful FinOps principle implementation
Here’s how you’ll know your cross-team FinOps groove is actually paying off — not just looking pretty on slides:
- 90%+ of your resources sporting proper tags (checked right in Cloudaware’s CMDB compliance dashboards). Means when your CFO asks, “how much is the new AI initiative costing us?” you can pull it in two clicks — not chase devs for a week.
- Forecast vs actual variance hovering under 10%, even when your product team suddenly ships to three new regions. Cloudaware’s multi-cloud spend tracking keeps the “wait, we blew the budget by 40%?” convos off the table.
- And my personal favorite: engineers proactively tuning scale sets or zapping idle resources after seeing Cloudaware’s daily anomaly or waste alerts — without you having to nag them in Slack. That’s when you know this isn’t just your FinOps team’s crusade anymore; it’s baked into how your org thinks.
When engineering launches crush your forecast — and nobody warned finance
You know how it goes. Engineering’s got a go-live date to hit, product’s jazzed about new features, and suddenly your cloud footprint balloons overnight with beefy compute, regional replicas, or unplanned data transfer.
Meanwhile, finance is still working off the last forecast — blissfully unaware your AWS and Azure invoices are about to spike 25%. By the time it hits, your FinOps team is scrambling to explain why you missed your commitment targets and can’t backfill with RIs or savings plans.
As our Technical Account Manager Iurii Khokhriakov likes to drill into every sprint kickoff:
2. Business value drives technology decisions - Let business goals steer every cloud FinOps decision
This might be my favorite of the FinOps principles, because it’s where the money people, the tech folks, and the product dreamers finally find common ground.
In sprawling cloud estates, with hundreds of teams deploying into AWS, Azure, where Azure FinOps principles often get lost in the shuffle, and GCP, it’s painfully easy to slip into chasing cost optimization for its own sake. But here’s the harsh truth: cutting costs that drive revenue or strategic advantage isn’t smart — it’s sabotage.
This principle forces you to pin every decision back to real business outcomes. It’s how you make sure that tweaking a Kubernetes autoscaler doesn’t accidentally throttle the new customer onboarding flow, or that holding off on reserved instances doesn’t blow up sustainability or gross margin targets.
How to implement it in FinOps
Here's how we keep business objectives firmly at the center of every cloud and cost discussion, without losing our cloud nerd souls. Cloudaware’s a big enabler here — not because it’s magic, but because it stitches multi-cloud spend data, tags, and operational context together into a language the business actually understands.
Tie forecasts directly to business initiatives
Use Cloudaware’s historical cost views sliced by BusinessUnit or ProductLine to back any new roadmap discussion with hard data.
How:
- When product says, “We’re launching feature X across three new regions,” pull Cloudaware reports on how similar past regional expansions impacted compute, egress, and commitments.
- Factor in related RI/SP or CUD utilization. Were we over-committed last time? Did we see sudden traffic spikes that demanded on-demand?
- Build side-by-side views: “here’s what our last rollout did to costs vs forecasts — here’s how we can adjust commitments this round.”
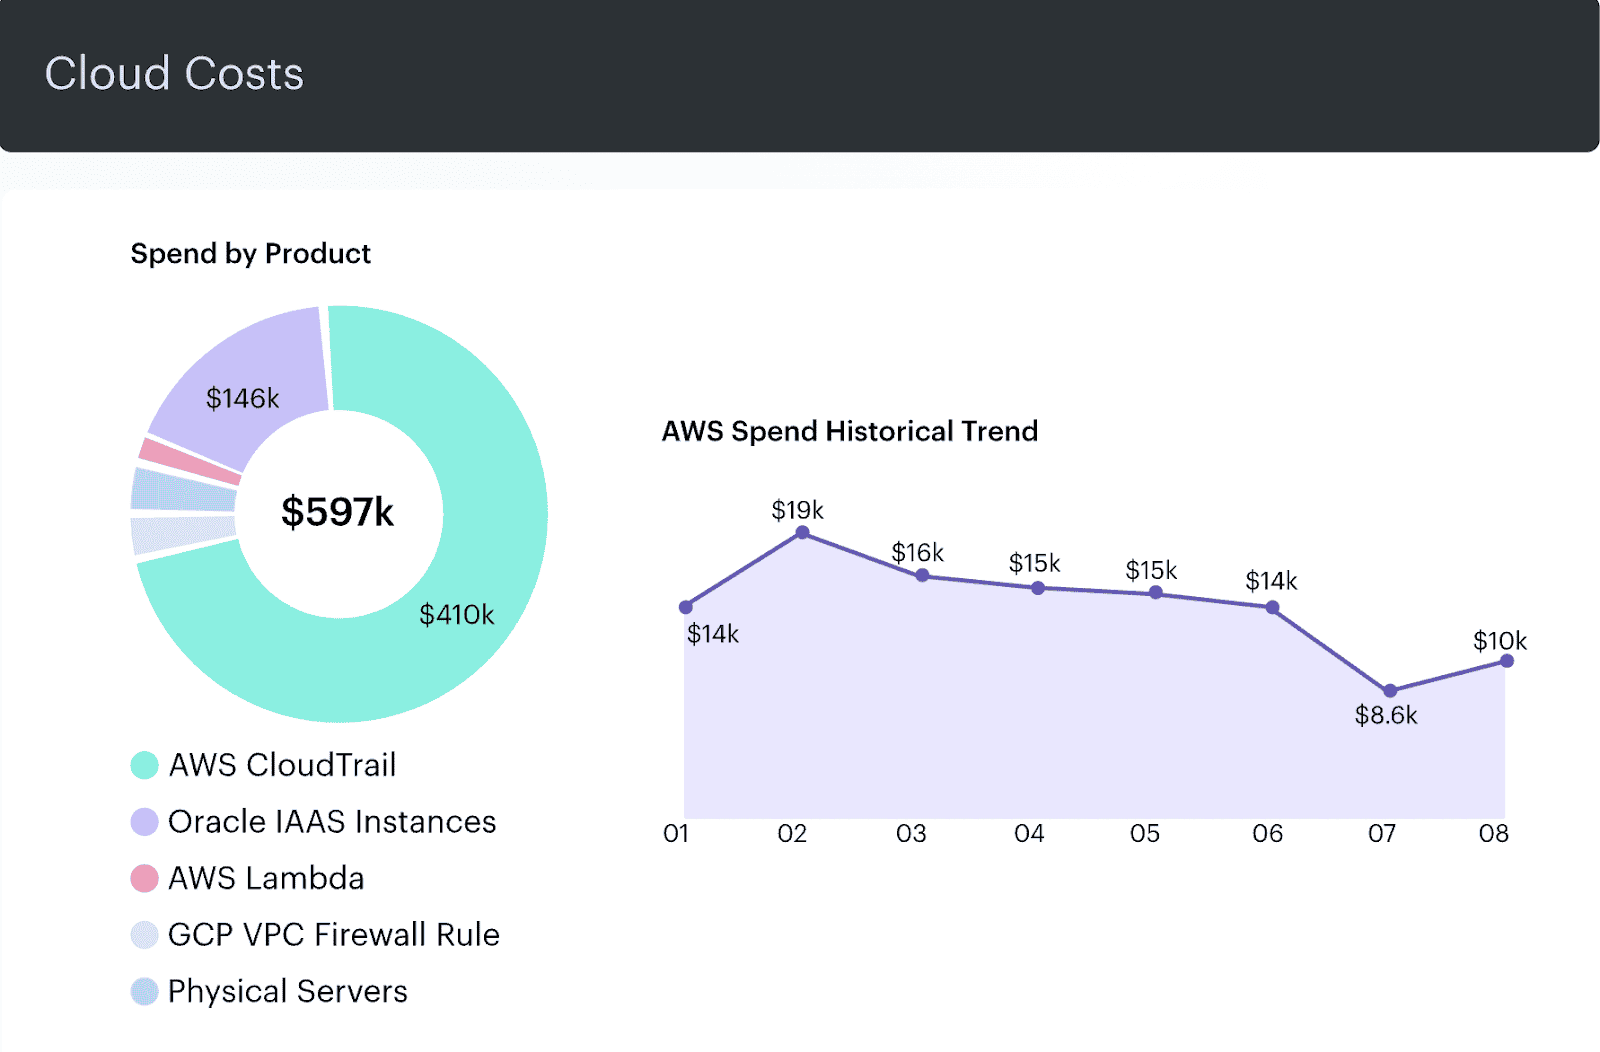
Historical cloud spent dashboard. Schedule a demo to check it live.
This is how you ground capacity planning and forecasts in data, so finance isn’t budgeting on hope and engineering doesn’t get sideswiped by a CFO “hold your spend” email two weeks after launch.
Make dashboards business-native, not tech-centric
So many FinOps teams get stuck building dashboards around EC2 InstanceType or KubernetesClusterName — useful for ops, meaningless to the CFO or product VP.
Instead:
- Use Cloudaware’s tagging enforcement to ensure every resource is labeled with
ProductLine,CustomerSegment,Initiative. - Then build dashboards that roll up spend, reservation coverage, and anomaly trends by these business views.
- Let stakeholders instantly see: “Our top 5 spend drivers are tied to the new premium tier onboarding project — here’s why it’s right that costs rose 20%.”
Multi-cloud dashboard showing cost by ProductLine + top contributors in Cloudaware
This is how you move FinOps from a geeky cost center to a trusted business ally.
Align your FinOps team with revenue & margin targets
It’s tempting to run FinOps purely on savings metrics — “we cut costs by 8% last quarter!” — but without showing how you protected margin or enabled growth, you’re not telling the full story.
So do this:
- Have your FinOps team pull quarterly reports from Cloudaware on the top 10 highest-cost workloads grouped by business initiative.
- Overlay commitment coverage & utilization (RI/SP/CUD). This tells a powerful story: “This AI personalization workload doubled costs, but it’s 85% reserved and tied to $3M in net-new revenue" or, “This marketing analytics cluster is running on on-demand, with 40% idle time — let’s rearchitect or cut.”
This is the data that builds trust across finance, engineering, and product.
Read also: Software Asset Management for Hybrid DevOps Done Right
Bake in sustainability with business-aware optimizations
Cloudaware’s CMDB plus cost views can highlight workloads that are high spend and low utilization — which usually also means higher emissions. That’s a double-whammy: eating margin and hurting sustainability targets.
✅ Your move:
- Use compliance policies to flag resources tied to business units that consistently show low CPU/memory utilization.
- Run a monthly “green + margin impact” review: here’s where you can cut idle costs and hit ESG metrics at the same time.
Element of the FinOps compliance dashboard in Cloudaware. Schedule a demo to check it live.
Let’s get into the real signals that prove you’re steering your FinOps decisions by business value — not just trimming cloud bills for fun.
✅ Unit cost metrics tied to business outcomes
Think cost per transaction, cost per new customer onboarded, or even cost per revenue dollar earned.
- Set it up by enforcing
ProductLineorBusinessUnittags (tracked right in Cloudaware’s CMDB compliance views). - Then benchmark these monthly against your top-line growth.
- If your cost per transaction jumps more than 15% without matching revenue lift, that’s your FinOps bat signal — maybe your scaling efficiency is slipping, or your commitments aren’t right-sized.
✅ Commitment coverage lined up with forecasted scale for your major initiatives
Because no one wants to get grilled for paying on-demand rates when traffic was totally predictable.
- Pull multi-cloud RI/SP or CUD utilization straight from Cloudaware and compare it to your product team’s scale forecasts.
- Your sweet spot? 75–85% coverage on stable workloads.
- Too high? You’re boxed in if demand drops. Too low? You’re bleeding cash.
- Review this every monthly FinOps sync, or every sprint if you’re in heavy launch mode.
✅ Spend on idle or low-value workloads trending down, quarter by quarter
It’s the simplest proof that your cost optimization efforts are hitting both margin and sustainability goals.
- Use Cloudaware’s compliance policies to catch resources with <10% CPU for 30+ days.
- Filter by
BusinessUnitorInitiativeto see if they’re tied to any revenue streams. - If not, queue them for cleanup or re-architecture.
Little secret? We flag it as a problem if idle costs creep past 10% of total cloud spend. That’s our cue to put new commitments on hold and dedicate a sprint to tightening things up.
Quick sanity check: If you can’t answer “which business line or customer segment is this spend supporting?” in under 30 seconds on your dashboards — your data story isn’t strong enough yet. Fix that first.
🚩 When “save at all costs” undercuts the business
If there’s one sure way to make product and engineering roll their eyes at FinOps, it’s slamming the brakes on cloud costs without asking what that workload’s actually powering. Happens more often than we’d like to admit: finance hits with a blanket “cut spend by 15% this quarter,” so engineers hold off scaling or kill headroom buffers, and before you know it your flagship app stalls under a traffic spike.
Revenue takes a hit, customers churn, and suddenly cloud savings look pretty damn expensive.
As our ITAM expert Alla L loves to say when she’s schooling a room full of execs (and trust me, she’s earned it):
3. Everyone takes ownership for their technology usage
This FinOps principle is your electric fence against runaway costs. The stuff that sneaks in when auto-scalers spit out thousands of ephemeral instances. Or when data teams fire up massive Spark runs “just for a quick model test” — and forget about them.
Finance then scrambles to piece together invoices across all your consolidated accounts. Engineering zeroes in on uptime. Product’s busy driving feature launches and growth. None of it connects back to budgets or business goals.
Ownership changes that. It pins usage to the people spinning it up. They keep it aligned to outcomes that matter. That’s how you stop costs from drifting off on their own.
How to implement it
✅ Tag every resource with ownership. This is your baseline. Without it, everything else is just theater. Cloudaware makes it ridiculously clear who’s responsible. Set policies that demand Owner, BusinessUnit, ProductLine, and Environment tags before a resource is even spun up. No tag, it gets flagged instantly.
Pro tip: auto-assign partial tags from your CI/CD. Like pre-filling BusinessUnit from the repo path so devs can’t mess it up. Then push weekly tagging gap reports straight into team Slack channels. Trust me, nothing gets a dev’s attention like seeing their name on a “missing owner tag” list in front of their whole squad.
✅ Put spend in front of teams — daily. Forget month-end chargeback decks. Too late. In Cloudaware, build live dashboards by team or initiative. Let marketing see their pipeline costs creeping daily vs forecasts. Show data science exactly how much that experimental GPU fleet is burning.
Lifehack: add commitment coverage overlays. So they don’t just see “you spent $30k,” but also “15% of that was on on-demand — we could be saving here.” That way teams start chasing cost optimization themselves, not because finance told them to.
✅ Push fixes to the edges. Cloudaware’s Compliance Engine is your silent enforcer. Set rules for idle volumes, underused reservations, or spend spikes. It’ll ping the owning team — not your FinOps inbox.
One of our clients sets it to auto-create a Jira ticket when idle EBS hits 7 days. Their SREs pick it up like any other bug. Keeps FinOps out of Slack “hey… could you…” purgatory.
✅ Make cost part of delivery, not an afterthought. Bring these dashboards right into sprint demos. “Here’s our app’s usage. Still tracking with expected customer load? Great. If not, what do we tweak?”
Quarterly, zoom out. Overlay business KPIs like new signups or conversions. If spend doubled but user growth didn’t? That’s your clue to recheck scaling policies or reservation plans.
Metics to track in the process
So how do you actually know if pushing ownership is working — not just in a pretty dashboard, but on the ground where your cloud bills live? Here’s what I’ve learned slicing through thousands of accounts with clients:
✅ 90%+ of resources tagged with owner, business context, and environment. Because without that? Everything else falls apart. You can’t show costs by product line or team, can’t split shared spend, can’t prove to finance that a spike ties back to new customer demand.
Set up Cloudaware compliance policies that run daily checks. Push out monthly rollups so teams see exactly where they stand. I’ve watched this alone improve tagging hygiene by 30% — no big governance meeting needed.
✅ Faster time to resolve idle or anomaly alerts. Idle resources used to sit there for weeks, burning dollars. Now with direct team alerts from Cloudaware (or your integrated workflow), they’re typically cleaned up in under 72 hours. That’s your benchmark. Over that? Time to tighten ownership.
Monitor the average time from first idle alert to resolution. Drop it into your FinOps dashboard so your leads see it on their next call.
✅ Higher team-level RI / Savings Plan coverage. When teams own their spend, they’re not defaulting to on-demand “just to be safe.” They’re planning for steady workloads. I look for 80-90% RI/SP coverage on predictable apps. Less? That’s money leaking out of your margins.
Cloudaware’s advanced RI/SP utilization reports break it down by tags like:
Overlay that on your team dashboards so owners see exactly how much of their infra is covered.
Because this is where FinOps stops being a nagging afterthought. When teams see their name on idle reports, or their app’s on-demand exposure vs a 3-year commitment — they fix it fast.
Read also: What Is FinOps? Framework, Roles, Strategy & Tools in 2026
When no one owns the bill, costs go wherever they want
This is how cloud budgets unravel. QA environments that should auto-destroy after 24 hours stay alive for six months. Data teams scale GPU fleets for one quick run — then never shut them down. Finance sees it later, when it’s way too late to optimize.
Anna, ITAM expert on our FinOps team, has this down cold:
4. FinOps data should be accessible, timely, and accurate
This FinOps principle is your insurance policy against that 7 AM Slack ping from finance. The one where they’re freaking out because costs jumped 40% overnight — and no one knows why.
In big multi-cloud setups, costs flow across thousands of workloads, managed by dozens of teams. If your data’s a week old? Or stuck in some static invoice CSV? You’re already behind.
Real-time, detailed, reliable data lets everyone — from engineering to finance to product — make decisions fast. It’s how you stop nasty budget surprises, keep usage tied to real business demand, and protect that all-important sustainability narrative.
How to implement it in FinOps
✅ Pull all your cloud costs into one clean stream — every day. Cloudaware grabs your AWS CUR, Azure EA, and GCP billing exports nightly — ensuring even Azure FinOps principles like EA visibility, tagging, and commitment tracking are covered end-to-end. It stitches them together so you’ve got one truth, not three CSV headaches.
Pro move:
- Time your ingest for 3-5 AM local. Dashboards are fresh by morning standups.
- Always sanity-check: does today’s total look sane vs yesterday? You’d be shocked how often billing feeds glitch.
✅ Tag like your forecasts depend on it — because they do. Cloudaware’s compliance engine is your friendly tag cop. Lock in Owner, BusinessUnit, ProductLine, and Environment on any resource that matters.
Deep expert tip:
- Start with your top 20% biggest spenders. That’s where 80% of awkward finance calls come from anyway.
- Use Cloudaware to track “time to tag compliance” — see how many days it takes teams to clean up missing tags after they get flagged. That’s your silent maturity metric.
Catch spend blow-ups before they hit your CFO’s desk. Set Cloudaware to flag:
- Idle resources hanging out >48 hours.
- RI or Savings Plan utilization dropping under 70%.
- Any day-over-day spend bump over 15%.
Pro play:
- Auto-generate compliance tasks, email ‘em to team leads.
- Next level? Pipe Cloudaware’s compliance JSON into a tiny Lambda that drops alerts right in Slack. Devs fix stuff way faster when it lands next to their deploy bot.
✅ Make every dollar tell a business story. In Cloudaware, slice dashboards by ProductLine, BusinessUnit, or environment tags like Dev, QA, and Prod. Show product teams exactly what that new feature cost yesterday. Let finance break down costs by unit economics — instantly, without waiting for someone to run a report.
Extra slick: Export tagged, normalized costs to Snowflake or Looker. Overlay revenue or user growth. Now your cloud spend’s not scary — it’s clearly tied to goals.
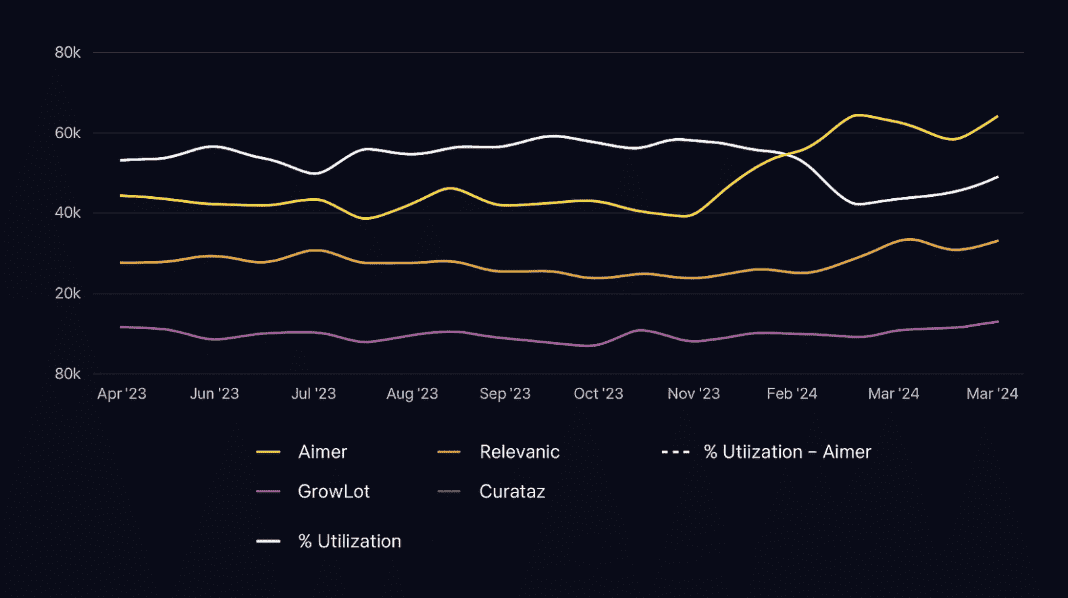
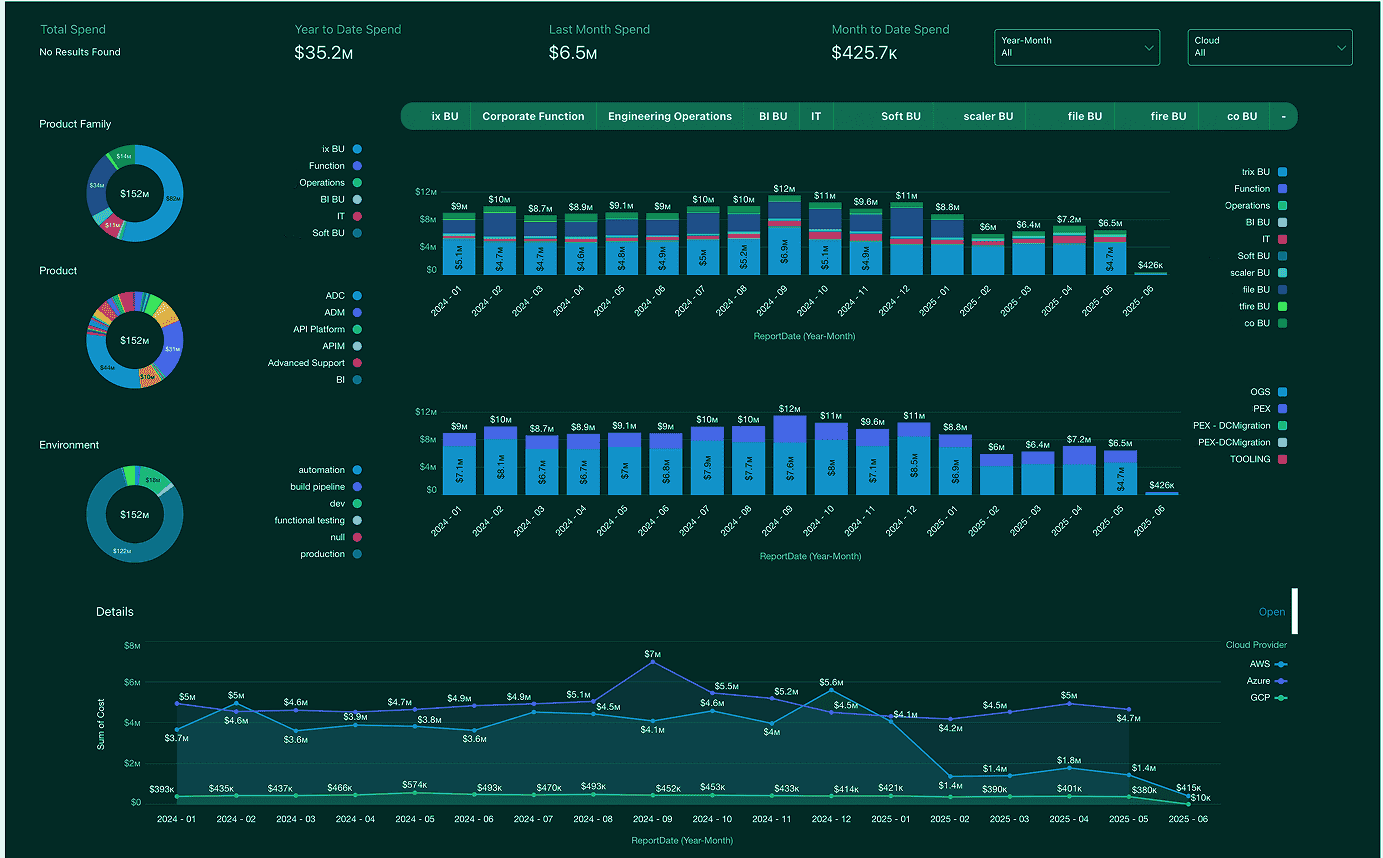
Element of the report on cost by ProductLine line chart with utilization overlays. Schedule a demo to check it live.
Metrics / signals of success
- <24h data freshness. Anything older? You’re catching problems after they’ve already dented your budget. Your teams need to see cost shifts the next day, so they can course-correct before it hits the invoice.
- 90%+ tag coverage on your top workloads. If you can’t tag it, you can’t slice it by business driver. This is how you answer that exec “what did this spike actually pay for?” without sweating.
- Under 10% variance on forecast vs actual by product line. Tight forecasts keep finance calm. Wide gaps? That’s where CFOs start pushing hard on blanket cost cuts — which usually wreck your real business goals.
✅ How to actually track this: Watch Cloudaware’s compliance trend graphs for tag coverage. Make sure it’s climbing — or at least staying high. Pull daily anomaly diffs and see how many flags clear within 72 hours. If stuff’s still unresolved days later, that’s your clue your “fast data” isn’t actionable yet, or teams aren’t owning it.
🚩 Running on old data? Watch your budgets detonate
Seen this play out too many times: product launches a big feature, spins up extra regions to support it. Your data pipeline lags by two weeks. By the time the spike shows up, the invoice’s locked — and finance is dialing in “emergency cost optimization.” Which usually means slashing budgets for something else that was actually planned.
Mikhail Malamud Cloudaware GM on our FinOps crew? He’s ruthless about catching this early:
"We run nightly multi-cloud scans for our clients — pulling in AWS CUR, Azure EA, and GCP billing. We’ve set up policies to flag anything missing critical tags, idle compute that’s been over 48 hours untouched, reservation utilization that dips under 70%, plus any spend anomalies above 15% of baseline.
Each of these checks ties right back to the client’s BusinessUnit tag. Then we compile JSON summaries by team and feed them through a lightweight Lambda that posts directly into their Slack channels before 7 AM. So by the time standup hits, engineering leads already know which resources blew up costs, missed tags, or underused RIs.
That’s exactly how we helped one client spot an ML pipeline in us-east-1 scaling out of control. Would’ve burned an extra $60K that month — we caught it on day two, kept their forecast on track, and avoided a messy CFO panic."
5. FinOps should be enabled centrally
When your teams are spread across AWS, Azure, and GCP — each with their own quirks (hello, Azure FinOps principles around EA, commitment discounts, and subscription scoping) projects, testing edge cases, running sudden data pipelines — costs multiply faster than anyone can manually track.
You’ve seen it: finance tries to forecast next quarter off last month’s static billing files, engineers deploy workloads that double traffic overnight, product celebrates growth. Meanwhile, your numbers are days (or weeks) behind reality. That’s exactly how budgets slip, RIs get misaligned, and you end up with finance, engineering, and product all blaming each other.
Having fresh, granular, and bulletproof data closes that trust gap. It’s what lets everyone act with the same facts, in real time, so decisions actually line up with business goals — not with outdated guesses.
How to implement it in FinOps
✅ Get your multi-cloud house in order
Stop bouncing between AWS, Azure, and GCP portals. Your billing data’s way too scattered for that. By funneling everything into a single normalized pipeline, you see spend across providers in one dashboard.
Set it to ingest daily by 5 AM. Have a simple auto-check that pings your ops channel if day-over-day totals swing >5%. That way by standup, you’re not catching surprises — you’re steering around them.
✅ Make sure your tags do the heavy lifting
It’s easy to say “everything needs an Owner tag.” But smart FinOps teams zero in on where it matters most: your top 30% spend. That’s where tag gaps blow up forecasts and break showback.
Run nightly compliance checks that rank tag violations by total dollar impact. A missing tag on a $20K machine-learning cluster should hit the top of every report. This isn’t about policing every $3 Lambda — it’s protecting your biggest risks.
✅ Build dashboards that look like your business, not just your infra
Forget generic compute cost charts. Slice your views by ProductLine, CustomerTier, or Region — whatever mirrors your internal P&L. That’s how marketing sees campaign costs, and finance can break down spend by margin driver.
Little expert flex: Layer in commitment overlays right next to total costs. A $50K workload is fine if it’s 85% covered by RIs. Seeing that side by side calms CFO nerves fast.
✅ Flag problems while they’re still cheap to fix
Don’t wait for invoices to hunt for anomalies. Let your rules catch idle resources sitting for 48 hours, reservation coverage dipping below 70%, or daily spikes tied to a single owner that jump >20%.
Our favorite hack: Set up compliance tasks to generate every morning. A lightweight Lambda grabs them, formats the JSON, and posts it straight into the same Slack channel your deploy notifications land. It’s right there in the daily noise, so your devs fix it before finance ever sends a “hey, what happened here?”
Read also: From Tag Spaghetti To Clean Inventory: Automated Asset Management
Metrics/signals of success
- Data fresh within 24 hours — non-negotiable. If your dashboards still show numbers from last Thursday, you’re not managing spend — you’re doing post-mortems. In healthy setups, we see teams pulling daily updates before standup.
T_arget:_ costs <24h old across AWS, Azure, GCP by 7 AM. That’s how you steer around fires, not just sift through ashes. - 90%+ tag compliance on your top 30% of spend. This is where most of your surprises lurk. One missed
ProductLineorOwnertag on a $25K GPU cluster? Suddenly your entire showback breaks.
Split your tag compliance audits. Run separate checks on your top quartile workloads vs the long tail. Keep your crown jewels above 90% at all times — the rest can catch up later. - Forecast vs actual variance <10% on critical workloads. When forecasts miss by more than 10%, that’s your CFO’s cue to clamp down. Tight variance tells finance your data’s solid, your FinOps practice is in control, and nobody needs to knee-jerk with sweeping cuts.
W_atch it like a hawk:_ trend this monthly by BusinessUnit or ProductLine. If you see variance creeping up, dig in immediately — often it’s a single workload that exploded quietly.
When stale data throws your teams under the bus
The classic meltdown? Engineering launches a massive user acquisition experiment, ramps infra by 2x, and you only see it three weeks later on a bloated invoice. By then, finance is reforecasting, slashing elsewhere, product’s shocked, and your FinOps team is stuck playing referee.
Kristina, Seniour ITAM expert on our team always puts it best when we’re setting up new clients:
6. Take advantage of the variable cost model of the cloud
When you’re running multi-cloud with thousands of workloads across hundreds of services, the only way to keep cloud costs aligned with business growth is to use the cloud’s own tools: reservations for predictability, spot for cheap scale, autoscaling for dynamic load.
Otherwise, you’re stuck over-provisioning to stay safe — or under-provisioning and killing performance. This principle is what balances it. It’s the lever that makes your FinOps story go from “yeah, costs are rising because we’re growing” to “we’re growing and still driving cost efficiency, even at scale.”
How to implement it in FinOps
✅ Build forecasts tied to reality, not hope
Use Cloudaware to slice historical spend by ProductLine or BusinessUnit. When marketing pitches that big onboarding rollout, you’re already prepped:
- What did a similar launch cost last time?
- How fast did we scale out?
- Where did we blow our commitments?
Advanced move: Run multi-scenario forecasts. Model what happens if you lock 50% vs 80% in RIs or SPs — then show the impact if growth stalls. Finance loves seeing “worst case,” and engineering gets clarity on where the real risk sits.
✅ Target reservation strategies like a sniper, not a shotgun
Don’t just blanket everything with 1-year RIs. Use Cloudaware dashboards to zero in on workloads that never dip — your customer auth services, transaction gateways, core APIs.
Field trick: Set up compliance rules that flag any business unit with reservation coverage <70% on steady workloads. The best FinOps teams we work with set separate thresholds by workload type — maybe 85% for core services, 60% for internal apps. That’s how you lock savings before on-demand bites.
✅ Let autoscaling and spot pick up the rest — but stay on a leash
For non-critical data jobs, CI/CD, marketing analytics? Spot fleets and preemptible nodes keep costs lean.
In Cloudaware, set anomaly rules to trip if your spot spend doubles overnight. That’s usually the first warning your pool is drying up. Move those workloads or rebalance to avoid a surprise bill or a capacity failure mid-campaign.
✅ Keep every decision tied to owners
Your whole play here falls apart without tagging. Every reserved instance, spot burst, autoscaler needs an Owner and BusinessUnit. Cloudaware’s nightly compliance runs catch gaps.
Lifehack: Separate your compliance reports by top 25% spend first. If tagging’s wrong there, you’ll feel it fastest in margin. Once that’s locked down, tackle the long tail.
Metrics / signals of success
✅ >80% reservation coverage on steady workloads. If it’s predictable — your customer auth service, main API clusters — it should be locked in. Benchmarks we see across mature FinOps orgs? 80-90% reservation coverage on core workloads, sliced by ProductLine or Environment.
Why? If you’re seeing <70%, that’s cash leaking straight to on-demand premiums.
✅ Spot ratios tailored to risk. For CI/CD, Prod analytics, internal QA? You want 60-75% on spot, easy. If it’s under 30%, you’re overpaying. If it’s over 90%, you’re flirting with sudden scale-outs failing when spot dries up.
If your spot % flips overnight, that’s a red flag to rebalance — before it nails performance or blows your forecast.
✅ Cost per transaction or per customer trending down. This is the golden metric. As usage grows, your cloud cost per unit should hold or drop. We track this quarterly by BusinessUnit — top performers show stable or even shrinking cost curves even as traffic doubles.
If it creeps up? Usually idle commitments, untagged zombie clusters, or spot pools getting squeezed. Fix it before it becomes a QBR issue with finance.
The classic slip: ignoring workloads until invoices scream
Happens all the time. A team rolls out a new service, traffic spikes, and everyone decides to “wait and see if it stabilizes before locking in reservations.” Six months later, they’ve paid full on-demand rates the whole time — flushing thousands they’ll never get back.
Or they lean too hard on spot for anything they can, chasing rock-bottom prices. Then spot capacity dries up. Costs jump or workloads stall. Now engineering’s fighting fires and finance is stuck explaining why margins just slipped.
As Iurii Khokhriakov, Technical Account Manager at Cloudaware, loves pointing out when he’s guiding clients through this:
What strong teams add on top: Automate to scale
When your cloud estate stretches across thousands of cloud resources — stacks upon stacks of microservices, batch jobs, ephemeral data bursts — manual tracking or “gentle reminders” to engineers just doesn’t cut it.
You can’t rely on spreadsheet audits to keep costs aligned to business outcomes. Or hope someone remembers to right-size a workload after launch. Automation turns all those fragile checks into rock-solid daily controls. That’s what gives your org the freedom to grow fast — without your cloud usage quietly wrecking forecasts, margins, or sustainability goals.
How to implement it in FinOps
✅ Automate tagging compliance so nothing slips
The system should enforce it, not Slack messages. Use Cloudaware’s compliance engine to run nightly scans across every environment. Flag any resource missing critical tags like Owner, BusinessUnit, or ProductLine.
Expert tip:
- Sort compliance by total monthly cost. Triage top spenders first — that’s where bad tagging causes the biggest headaches in allocation and forecasting.
- Track MTTR (mean time to remediate) on missing tags. If it’s creeping past 72 hours, you’ve got a maturity gap.
✅ Automate allocation reporting to crush month-end chaos
Manual cost allocation? Not in serious FinOps. Pull multi-cloud billing into Cloudaware, let it break costs down automatically by ProductLine and BusinessUnit using your enforced tags.
- Run weekly allocation checks so finance sees deviations long before the invoice.
- Set a policy to highlight when a business line’s allocation shifts more than 10% week over week. That’s usually a rogue workload or a fast-scaling product that needs a commitment strategy — or a green light from finance.
✅ Automate optimization so teams stay ahead
Use Cloudaware to watch for idle cloud resources beyond your comfort threshold — EBS volumes older than 7 days untouched, underutilized RIs, daily cost jumps on reserved services.
Have Cloudaware generate compliance tasks daily. Then pipe them via API or script into your team’s existing Slack or Jira flows. They’ll see idle cleanups and missed RI coverage the same place they see deployment tickets — which means it actually gets fixed.
Smart overlay: In Cloudaware, layer sustainability data on your biggest spenders. Automate compliance flags on low-utilization workloads tied to carbon-heavy resources. That’s how you keep your green metrics intact while hunting cost efficiency.
Metrics / signals of success
- <3 days average to resolve compliance tasks tied to high-cost resources. If idle or under-tagged workloads get flagged, they shouldn’t sit. Best-run setups we see in Cloudaware push these to teams’ Slack or Jira, and track MTTR (mean time to remediate). Under 72 hours? That’s a finely tuned machine. More than a week? Expect your variance or carbon numbers to get ugly.
- Less than 5% drift in RI/SP utilization targets by business unit. You want reservation usage steady. If a unit’s running 80% coverage for predictable workloads, they shouldn’t slide to 70% next month without a clear business shift. Watching drift by BU is where serious FinOps shops catch gaps long before they bleed real money.
- Daily compliance audit success rates trending up over 3 months. Not just a static “we’re 90% compliant,” but improving. The top clients track percentage of resources fully tagged, allocated, and clean (no idle or anomalous). Climbing numbers prove your automation’s locking in — not relying on a one-time clean sweep that slowly decays.
The trap: trying to scale by chasing engineers manually
Most organizations trip here. They scale fast — more cloud services, more business-critical deployments, more sprawling cost centers — but keep managing spend with manual back-and-forth. You’ll see it everywhere: FinOps or finance folks dropping Slack pings to chase down missing tags. Or hacking together last-minute Excel pivots to split cloud costs by product line for end-of-month.
By the time the invoice locks, forecasts are off by 20% or more. Finance is stuck explaining variances to the CFO. Meanwhile, idle heavy data services — clusters, long-lived volumes — quietly keep running, driving up costs and missing your sustainability commitments.
Daria, ITAM expert on our team, sees this with nearly every new client before we dial it in:
Cloudaware handles this by automatically scanning multi-cloud usage daily. It flags idle clusters, low RI coverage, or sudden spend anomalies, all tied back to Owner and ProductLine. The system generates structured outputs — JSON or CSV — that teams drop into a tiny script to feed Slack or Jira.
That’s how one client cleaned up $80K of idle GPU workloads last quarter. Not because someone from FinOps nagged them. It landed right in their sprint board, alongside feature tickets.
They closed it like any other task, avoided a surprise finance review, and tightened their emissions targets without even thinking about it.
FinOps principles on Azure: what changes in practice
Azure doesn’t give you new principles. Same six. What changes is the plumbing: scopes, exports, and how commitments show up in cost data. Get those wrong and you will “do FinOps” all quarter while your numbers keep refusing to reconcile.
1. Teams need to collaborate
In Azure, collaboration breaks first at the scope boundary. Finance lives at billing scopes, engineering lives at subscriptions and resource groups, and they can literally be looking at different totals.
Pick the scope that matches the question. Management groups roll up usage-based spend, but they don’t include purchases like reservations and Marketplace items, so totals can differ from billing views.
Give engineers cost visibility where they operate. If they only see monthly invoices, you get reactive cleanup. Grant access and make weekly deltas part of the same channel where deploy decisions happen.
2. Business value drives technology decisions
Azure’s “value conversation” gets real when you stop talking in service names and start talking in units.
Export data that lets you compute unit economics. Cost Management exports can include actual, amortized, or FOCUS cost datasets, which helps you tie spend back to products, apps, or environments consistently.
Use the pricing model that matches the decision. For week-to-week engineering choices, amortized views often tell a truer story once commitments are involved.
3. Everyone takes ownership for their technology usage
Azure won’t magically “inherit” ownership metadata for you. If you skip governance, you end up with anonymous resources and un-allocatable spend. Treat tagging like a control, not a suggestion. Azure Policy can enforce required tags and even apply them automatically with the Modify effect plus remediation for existing resources.
Budget to the team boundary, not just the month. Budgets can be created at subscription or resource group scope and can trigger action groups when thresholds are hit.
4. Take advantage of the variable cost model of the cloud
Azure gives you two big “variable cost” levers that show up everywhere: autoscaling patterns and commitment mechanics.
Commitments are explicit and measurable. Azure reservations can reduce costs by up to 72% versus pay as you go, but only if utilization stays healthy. Savings plans behave differently than reservations. A compute savings plan is an hourly spend commitment, billed every hour, and it can reduce eligible compute costs by up to 65% off list pay as you go rates.
Make the discount visible to the owners. Savings plan and reservation costs show up in separate actual vs amortized datasets, so your showback model needs to pick and stick to one.
5. FinOps should be enabled centrally
Central enablement in Azure is basically “set the rules once, enforce them everywhere,” without turning it into a bureaucracy.
Standardize hierarchy and access. Cost Management scopes include billing scopes like EA and MCA billing profiles, plus Azure RBAC scopes like subscriptions, resource groups, and management groups. Build your reporting and permissions around that reality.
Ship guardrails as code. Tag policies, budget templates, and alert rules belong in the same repo mindset as IaC, because drift happens fast in cloud. The platform team owns the baseline, product teams own the spend decisions.
6. FinOps data should be accessible, timely, and accurate
Azure can absolutely give you trustworthy data. It just expects you to choose the right feed and route it to the right humans.
- Automate exports instead of scraping dashboards. Cost Management exports support actual, amortized, and FOCUS formats so you can feed a cost lake, a data warehouse, or your FinOps tooling without manual work.
- Detect “weird” spend, not just “over budget” spend. Azure supports anomaly alert rules in Cost Management so you can catch unexpected changes early, not after the invoice lands.
- Use native recommendation signals, but validate them. Azure Advisor publishes cost recommendations including right-sizing guidance and reservation recommendations, which is a solid starting queue for weekly optimization.
So yeah, Azure changes the mechanics, but the game stays the same. If Finance can’t reconcile what Engineering is seeing, the weekly review becomes a debate club.
Quick way to make the principles operational
Tie each one to a metric you can track weekly. If a principle doesn’t have a number attached, it turns into vibes and nobody changes behavior. The wording below is the FinOps Foundation’s canonical language.
| FinOps principle (canonical) | One metric that proves it’s happening |
|---|---|
| Teams need to collaborate | Time-to-owner for cost anomalies (median minutes from detection to assigned owner in Jira/Slack). If it’s hours, the loop isn’t collaborative, it’s forensic. |
| Business value drives technology decisions | Unit cost trend (cost per transaction, per active user, per API call, pick one). Track WoW change and correlate spikes to releases or traffic, not feelings. |
| Everyone takes ownership for their technology usage | Allocation coverage (% of spend mapped to app, team, env via tags, accounts, subscriptions, projects). Target is “almost everything,” because unknown spend can’t be owned. |
| Take advantage of the variable cost model of the cloud | Commitment utilization (RI/SP/Savings Plans utilization %). Low utilization means you prepaid for capacity you didn’t use. |
| FinOps should be enabled centrally | Policy compliance rate (% of resources meeting required tagging and budget guardrails). Central enablement shows up as fewer exceptions, not more meetings. |
| FinOps data should be accessible, timely, and accurate | Data freshness + reconciliation variance (hours of lag from provider to dataset, and % delta vs invoice). If trust is shaky, decisions slow down. |
Last updated: February 20, 2026