


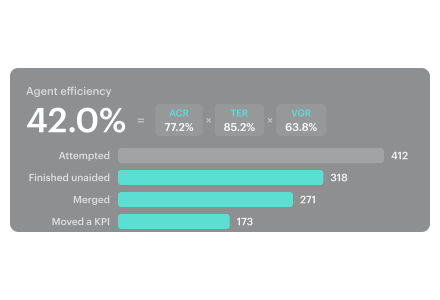
FinOps for AI now has a working framework for agent efficiency and a missing input. Gareth Bland, chief data scientist at Microsoft Frontier Company, presented three ratios for agentic work at Tokenomicon + FinOps X in Amsterdam in September 2026: autonomous completion rate, token efficiency ratio and value generation ratio, multiplied together into an overall agent efficiency score.
Each of the three divides something achieved by the tokens spent achieving it. Numerators come from the systems where agents work: run records, source control, evals. Denominators come from a bill, and on a bill the tokens one work item consumed are spread across accounts, model vendors and dozens of calls, none of which carries anything that names the work. The FinOps discipline arrives at AI spend with its allocation machinery intact and its grain wrong, and the framework assumes that attribution has already happened.
TL;DR
The three ratios are sound. The denominator under them is missing, because a provider bill is keyed to calls and API keys while every ratio compares work items.
- Three ratios, one score. Autonomous completion rate, token efficiency ratio and value generation ratio measure the inner loop, the outer loop and the business result. Their product is the overall agent efficiency score.
- Every ratio divides by spend on one unit of work. A multi-agent harness fans a single work item across several agent classes, retries and providers, so the denominator is a sum that no billing line is keyed to.
- Telemetry records the run, not the owner. The OpenTelemetry GenAI attribute registry defines model, operation, token counts and agent identity, and no attribute for application, team, cost center or budget.
- Unattributed AI spend is the first number to report. It bounds every ratio built on top of it, and the FinOps Framework already asks for the same reading on cloud cost.
- Billing data supplies one side of each ratio. Autonomous completion needs agent run telemetry and token efficiency needs source control. Neither is in a provider bill.
- For the layer model of AI cost, from provider discounts up to business unit cost, see AI unit economics. For the KPI catalog around it, see 27 FinOps KPIs.
Three ratios turn an AI bill into a question about yield
Bland's framework takes a backlog of work items and down-selects it three times. Each down-select is a ratio, each ratio has a different owner, and the three multiply into one top-level score. The structure matters more than the arithmetic: a single blended efficiency number cannot say which stage lost the work.
The starting point is the shape of an agent bill. Bland puts user messages at a 1x baseline and reasoning plus output tokens at five times that, because the agentic looping and the tool selection land on the output side of the invoice. That ratio is visible in published list prices: Anthropic prices output at five times input across the Claude line, from $1 and $5 per million tokens on Claude Haiku 4.5 to $10 and $50 on Claude Fable 5.1 (read 5 October 2026).
AI agent cost is then per-call cost multiplied by iterations, and a multi-agent graph fans one request out to several agent classes, so the figure that matters is the cumulative cost across the whole harness rather than the price of any single call. That is a different arithmetic from the per-resource cloud cost optimization metrics a FinOps team already runs, where one resource produces one meter.
Bland's first closing instruction is to stop treating that bill as one question:
The cost per token and token yield are completely different questions. You need to be tracking them with different metrics and understand that you have different levers in order to improve them.
Cost per token is an attribute of a call. Token yield is an attribute of a work item. The levers differ because the owners differ: an engineer changes cost per token by routing to a smaller model or caching a prefix, and a product owner changes yield by choosing different work.
| Ratio | What it asks | Loop | Where the numerator lives |
|---|---|---|---|
| Autonomous completion rate | Did the agent finish, or fail and escalate to a person? | Inner loop | The agent harness's own run records |
| Token efficiency ratio | Did the work survive commit, review and merge? | Outer loop | Source control and the review process |
| Value generation ratio | Did the shipped work move a KPI or an OKR? | Business | Evals coupled to KPIs and OKRs |
| Overall agent efficiency score | The product of the three | All | Nowhere. It is computed, not observed |
Autonomous completion rate measures the inner loop
Autonomous completion rate is the share of attempted work items the agent finished without handing the task to a person. It is the first down-select, and it is the ratio engineering teams feel first, because an escalation shows up as a human on the critical path rather than as a line on an invoice.
The failure mode Bland names for this ratio is specific: a misunderstood API, or a task the agent could not complete. Both are engineering defects with an owner, which is why the ratio belongs to whoever runs the harness.
Token efficiency ratio measures the outer loop
Token efficiency ratio applies where the agent produces code. The test is whether the output cleared commit, pull request and merge, which makes the ratio a measure of whether generated work met the standards of the receiving codebase. A drop here means merge standards were not met, not that the agent burned more tokens.
For workloads that do not produce code, the equivalent is whatever review gate the output has to clear before it reaches the product, such as an approval queue or a quality threshold on a processed document.
Value generation ratio measures the business result
Value generation ratio asks how much of the merged work moved something the business measures. Bland is explicit that this requires evals coupled directly to KPIs and OKRs, and that the ratio falls for reasons that have nothing to do with token spend. His example is a user stuck in a retry loop in the shipped feature.
His second closing instruction states the consequence plainly: "A completed task is not a valuable one." A high autonomous completion rate on work nobody needed measures throughput rather than return.
The product of the three telescopes into one fraction
Written out with counts, the three ratios share their boundaries. Completed divided by attempted, multiplied by merged divided by completed, multiplied by KPI-moving divided by merged, equals KPI-moving divided by attempted. The overall agent efficiency score is arithmetically just the share of attempted work items that moved a KPI.
The telescoping is the reason to keep the three ratios reported separately rather than to drop any of them. The score tells a product owner how much of the work paid off. The three components tell an engineering lead which stage lost it. Merge standards slipping, users abandoning a shipped feature and an agent failing to read an API all move the same number by the same amount, and each one needs a different team to fix it.
Every ratio divides by the tokens spent on one unit of work
The denominator of each ratio is the token spend attributable to the work items in it. For a single agent calling one model under one API key, that is a straightforward read. For the multi-agent harness Bland describes, the denominator for one work item is a sum across every agent class that touched it, every retry, every tool call and every provider involved, and nothing in the billing record identifies the work item that caused any of it.
Consider what the three main billing routes actually key on. A managed model service such as Amazon Bedrock, Vertex AI or Microsoft Foundry bills into a cloud account, where cost allocation tags and application inference profiles can attach an application to the spend. A model vendor billed directly, such as Anthropic, OpenAI or OpenRouter, bills against the API key it issued. Self-hosted models bill as GPU capacity. The finest grain any of those routes offers is the application, and in the direct-vendor case it is often a single key shared by a planner, a retriever and a reviewer.
An application-level key is enough to compute a blended cost per million tokens, which is the bridge metric in the layer model of AI unit economics. It is not enough for any of the three ratios, because all three compare work items with each other. Moving from an application denominator to a work-item denominator is the work that turns a cost report into an efficiency score.
The practical test before defining any ratio: name the identifier that would carry the work item from the backlog through every call path in the harness, then check whether every path sets it, including retries, sub-agents and the fallback model. If the answer is no for any path, the ratio will be computed on a partial denominator and will move when routing changes rather than when efficiency changes.
Agent telemetry stops at the run
Agent observability records what the model did. It does not record whose application the run served, which team owns it, or which budget it draws on, because the conventions that standardize agent telemetry carry no attribute for any of those.
The evidence is in the specification. The OpenTelemetry GenAI attribute registry defines gen_ai.request.model and gen_ai.response.model, gen_ai.operation.name, gen_ai.usage.input_tokens and gen_ai.usage.output_tokens, gen_ai.token.type, gen_ai.agent.id, gen_ai.agent.name and gen_ai.conversation.id. There is no attribute for application, owner, team, cost center, business unit or budget, and the conventions are still moving: they now live in their own semantic-conventions repository (read 5 October 2026). The provider side is the same shape. Amazon Bedrock model invocation logging captures the request, the response and the token counts for each invocation, which is a complete record of a call and silent on accountability for it.
Bland treats measurement as the part of the problem already handled, because platforms now track token spend "through telemetry, traceability, observability, understanding how we're spending tokens and tying that back into your FinOps practice", and he moves on to his real interest, which is prediction.
Four of the five items in that list are instrumentation of the run, and the industry has them. The fifth is a join between two systems that share no key. Observability knows that an agent ran, which model it called and how many tokens it burned. The billing dataset knows what the tokens cost and which account or key paid. Neither one knows which work item was being attempted, so the tie-back is an allocation problem. Instrumenting the harness more thoroughly does not produce it.
Where this does not apply: an organization whose harness, models and budget all sit inside one platform can carry its own internal identifier end to end and never meet the gap. It appears when the harness, several model vendors and the budget live in three different systems, which is the normal case once Bedrock, Vertex AI and a direct vendor API are all in use.
Billing data supplies the denominator only
Each ratio is a fraction whose two halves are produced by different teams in different systems. Stating that division of labor first is what keeps an efficiency program from stalling on an argument about tooling.
| Ratio | Numerator source | Denominator source | Who owns the numerator |
|---|---|---|---|
| Autonomous completion rate | Agent run telemetry: finished unaided against escalated | Token spend on every call made for those work items | Platform or engineering team running the harness |
| Token efficiency ratio | Source control: commits that cleared review and merge | Token spend on the work items that produced the code | Engineering organization |
| Value generation ratio | Evals coupled to KPIs and OKRs | Token spend on the merged work items | Product and business owners |
| Unattributed AI spend | None. It is a property of the denominator itself | Total AI cost in the period | FinOps, with the application owners |
Diagram of where each half of each ratio comes from: agent run telemetry, source control and KPI-coupled evals on the numerator side, one AI billing dataset on the denominator side, and the work-item identifier that would join them.
Read the table by column rather than by row. The right-hand column is one dataset and one discipline. The left-hand column is three different systems with three different owners, and a FinOps platform that reads billing data does not produce any of them. Autonomous completion rate needs the harness's run records. Token efficiency ratio needs source control. Value generation ratio needs evals that someone has already agreed to couple to a KPI.
That limit is worth saying out loud, because the alternative is a measurement program that waits for one of the FinOps tools to deliver an engineering metric. What the cost side can supply is the denominator for all three ratios and the record the numerators attach to: an application, with its owner, its team, its budget and the spend that landed on it. The numerators attach to that record or they attach to nothing.
Unattributed AI spend bounds every ratio built on top of it
Unattributed AI spend is the share of AI cost in a period that no rule can assign to an application, a team or an owner. It is the first number to report in any FinOps for AI program, because it bounds every ratio computed on top of it. An agent efficiency score calculated on 60% of the spend is a score with an unstated denominator, and it will move whenever the unattributed share moves.
This is not a new metric. The FinOps Framework's Allocation capability already asks for the "ability to surface the percentage of cost that cannot be categorized and allocated directly, and which must be investigated", and it treats the reading as an indicator of allocation maturity in service of the FinOps principle that everyone takes ownership of their technology usage. Applying that reading to AI cost attribution is the existing discipline meeting a new billing surface. The method is unchanged apart from the metering source. The FinOps for AI working group frames the problem the same way.
The calculation is deliberately dull. Divide AI cost with no allocation key by total AI cost for the period, then report the numerator broken out by AWS account, Azure subscription and GCP project, plus one line per directly billed vendor key. The breakdown is the part that matters, because a percentage names the size of the problem and the account, subscription or project names its address. The rule-writing itself is ordinary cost allocation work applied to a new set of billing sources.
| Reading | Most likely cause | Next action |
|---|---|---|
| High, concentrated in one account, subscription or project | An unregistered application, or one key shared by several agents | Find the key's owner, register the application, split the key by a usage signal |
| High, spread evenly across providers | No allocation rule exists for a vendor billed directly | Bring the vendor's metering data into the dataset, then write the rule |
| Low but rising week on week | A new agent or harness deployed without the allocation key set | Find the change, set the key at the call path rather than in the report |
| Low and flat, and the ratios still cannot be computed | Spend lands on applications but not on work items | The missing key is the work-item identifier, not the application tag |
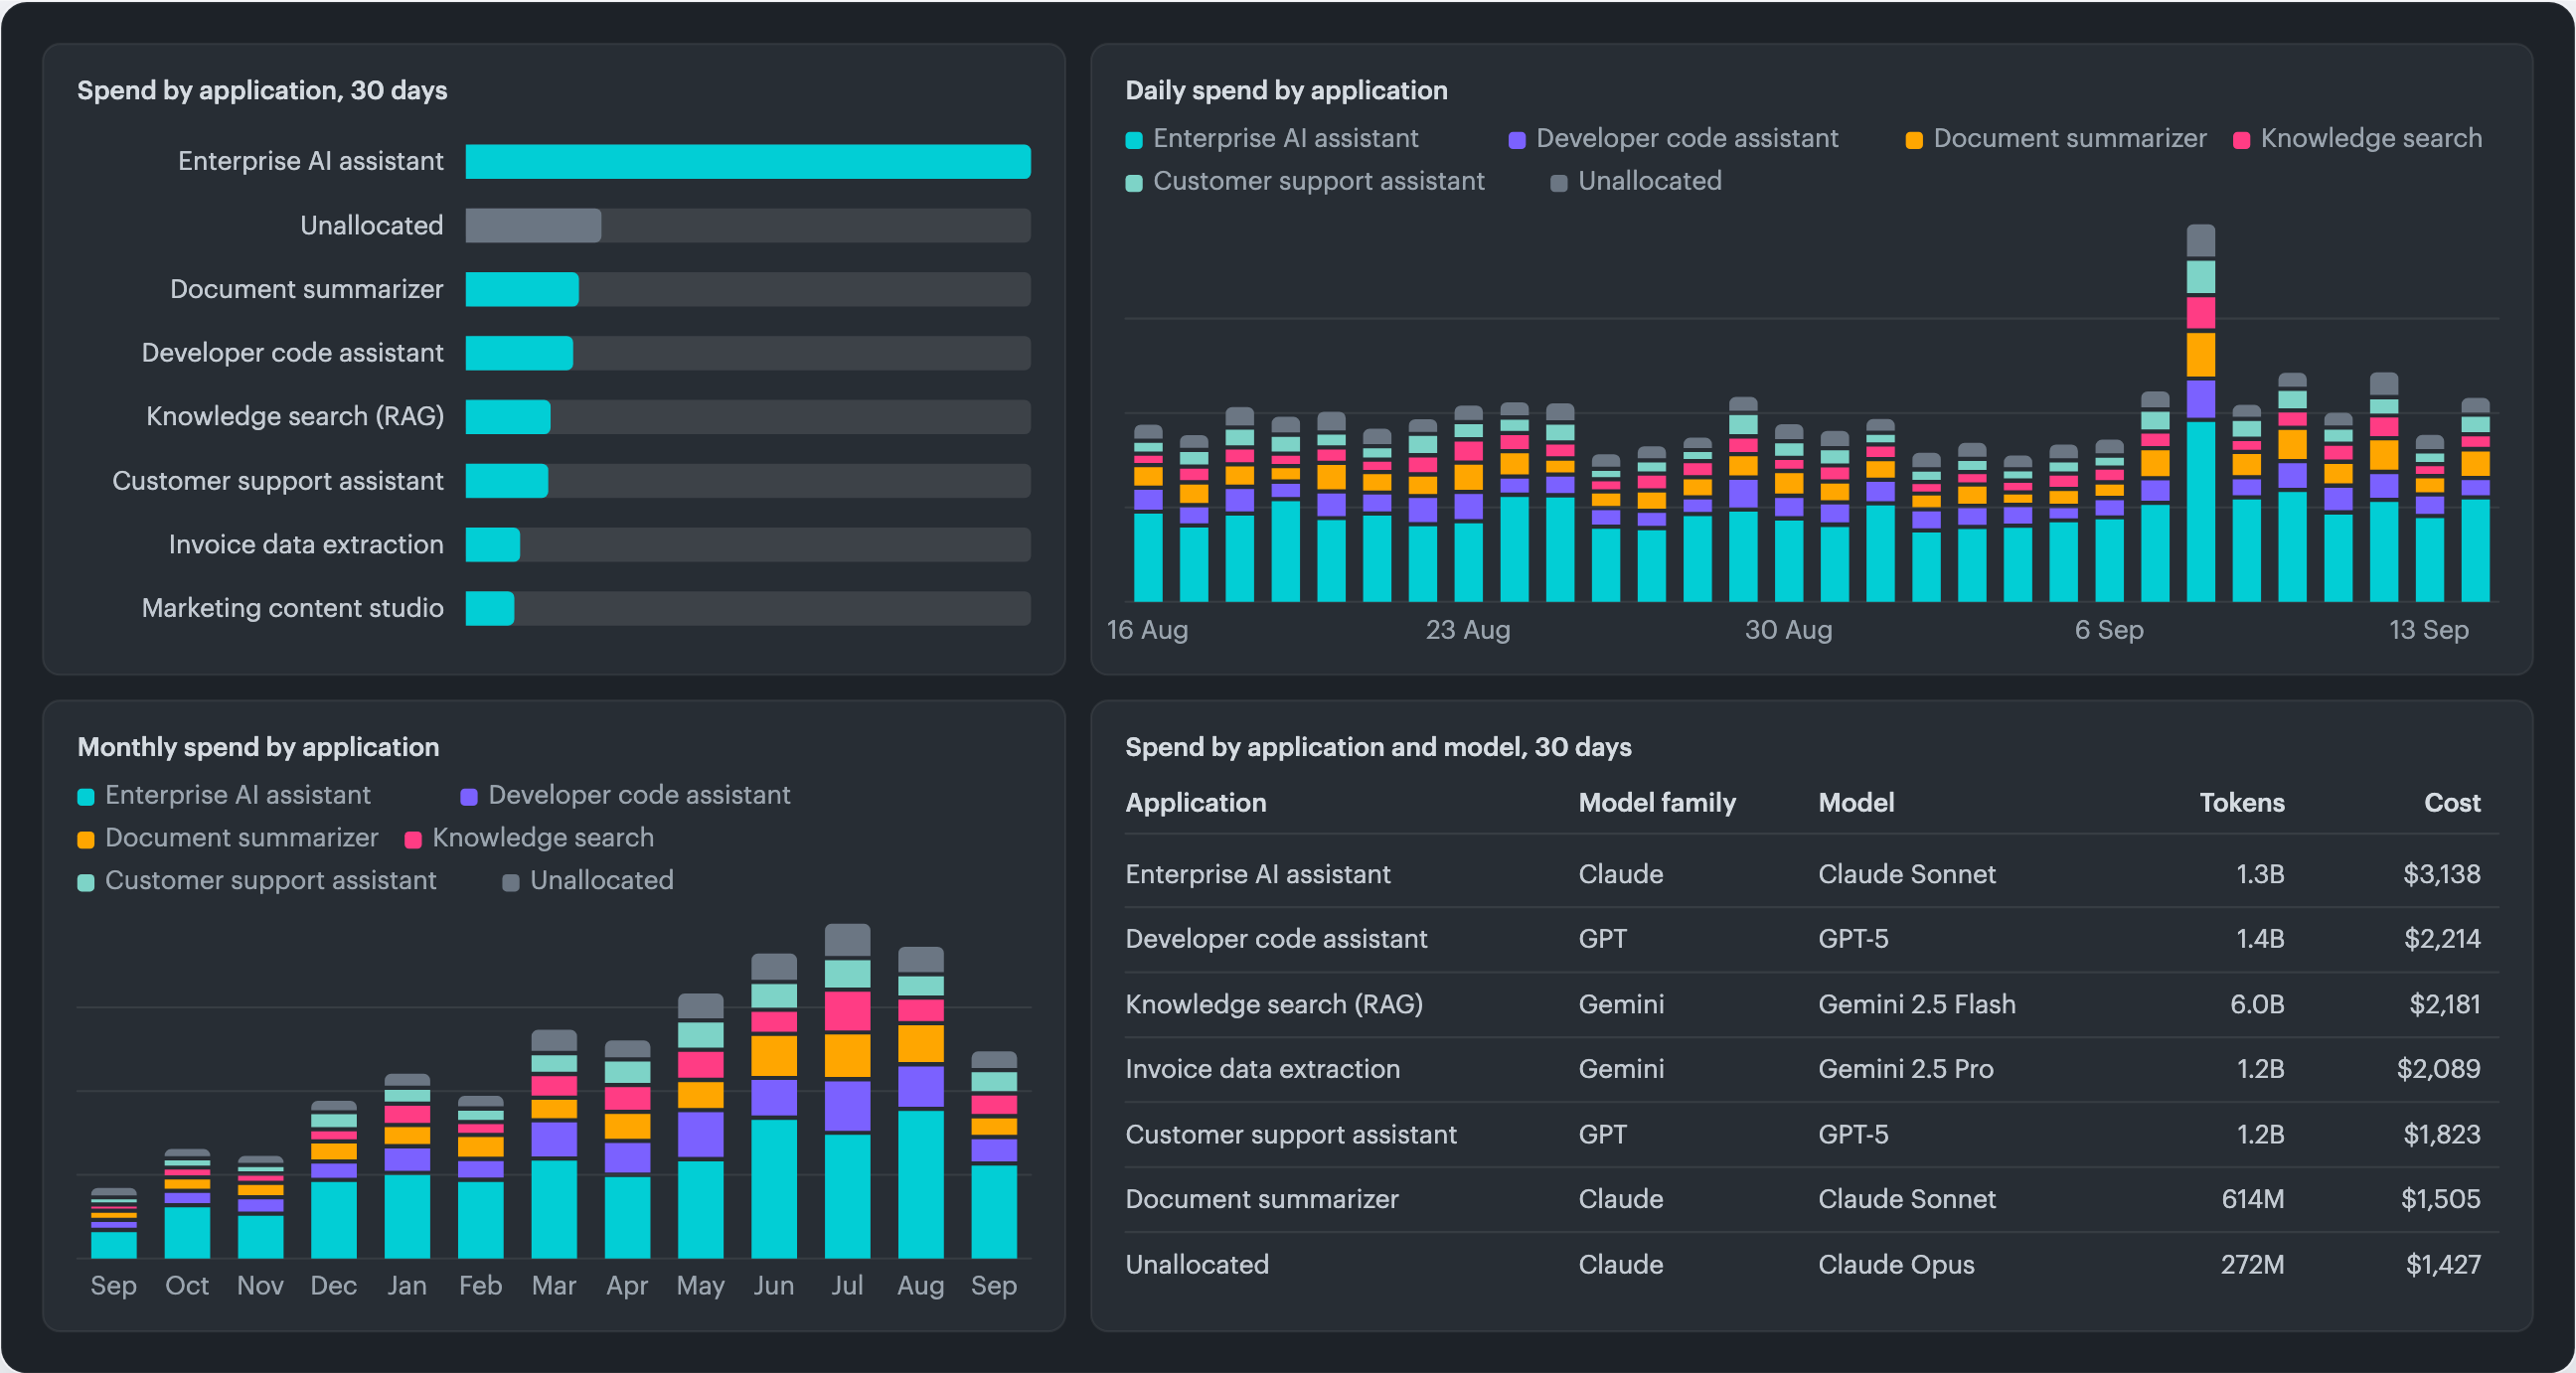
Illustration of AI model spend by consuming application, daily and monthly, with the unallocated share shown as its own line rather than spread across the applications around it.
The last row is the one that surprises teams with mature cloud cost allocation. Tagging discipline that is good enough for chargeback is not automatically good enough for agent efficiency, because chargeback needs a cost attributed to an owner and a ratio needs a cost attributed to a task. Reporting unattributed AI spend at both grains, by application and by work item, separates a tagging problem from an instrumentation problem before anyone argues about which team is at fault.
The framework requires a priced work item
To compute the three ratios per work item, the work item has to become a cost object: an identifier every provider call carries, with the tokens and the human minutes spent on it priced together. No AI billing dataset ships that object today. Cloudaware does not ship it either, and the screen below is a mock-up of the idea rather than a product capability.
Four things have to exist before the object does.
- A work-item identifier set at every call path. Taken from the backlog, propagated through planners, sub-agents, tool calls, retries and fallback models, so that a single identifier covers the whole fan-out.
- The identifier visible to the billing dataset. Either in the metering record itself or in a usage signal the application emits, because a billing dataset can only join on a field it receives.
- An escalation record with a rate. When the agent failed and a person finished the task, the minutes and the hourly rate, so an escalation stops being free.
- An outcome state per work item. Completed unaided, merged, or moved a KPI, which are the three numerators the ratios need.
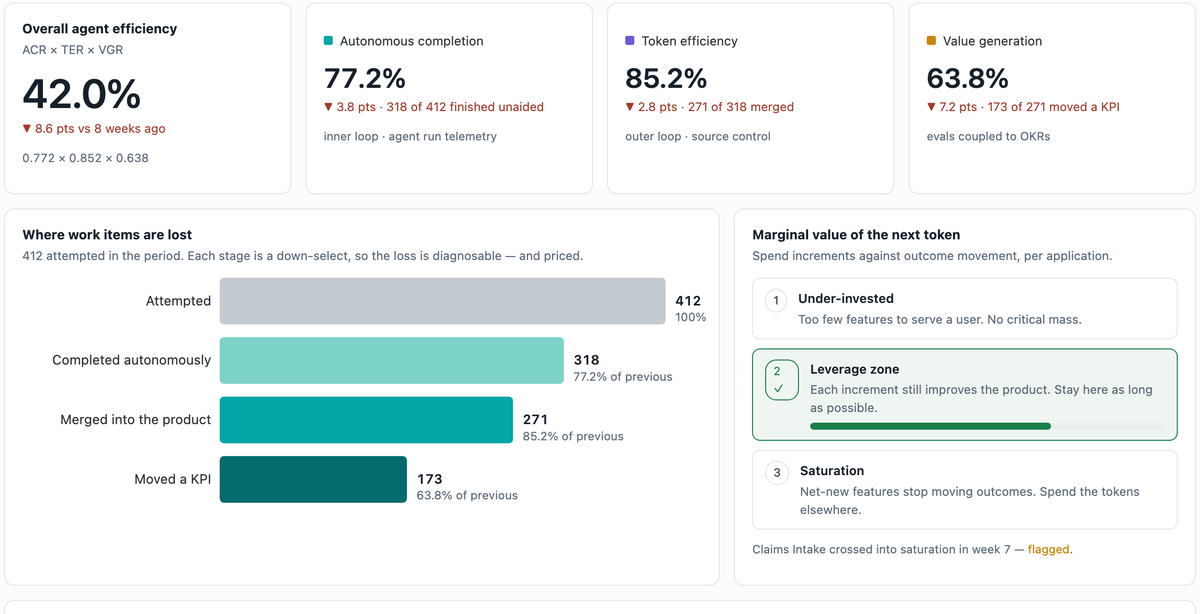
Illustrative mock-up, built 5 October 2026 against Bland's framework, of the proposed work-item cost object. Every figure in it is illustrative. Notice the bottom-right tile: AI spend not attributable to a work item is reported next to the ratios rather than underneath them.
The table below is the detail view from that mock-up: seven work items, their token cost, the human time an escalation consumed at an illustrative $95 an hour, and the blended cost of each. Every value is illustrative.
| Work item | Application | Tokens | Token cost | Human time | Blended cost | Outcome |
|---|---|---|---|---|---|---|
| CLM-4182 duplicate-claim detector | Claims Intake | 4.12M | $96.40 | none | $96.40 | KPI moved |
| BRK-0914 broker onboarding summarizer | Broker Portal | 2.87M | $67.10 | 45 min | $138.35 | KPI moved |
| FRD-2201 fraud narrative drafting | Fraud Review | 9.64M | $225.40 | 20 min | $257.07 | Merged, no KPI |
| CLM-4190 policy-clause extraction | Claims Intake | 14.80M | $346.00 | 2 h 10 min | $551.83 | Escalated |
| BRK-0921 quote comparison table | Broker Portal | 1.94M | $45.30 | none | $45.30 | KPI moved |
| CLM-4205 adjuster note normalizer | Claims Intake | 6.33M | $148.00 | 35 min | $203.42 | Merged, no KPI |
| FRD-2214 ring-detection retriever | Fraud Review | 22.40M | $523.80 | 4 h 05 min | $911.72 | Escalated |
Read down the two cost columns. Token cost across the seven items is $1,452 and human time adds $752, so a third of their blended cost is time people spent finishing what the agents handed over. The effect is uneven. FRD-2214 rises 74%, from $523.80 to $911.72. CLM-4190 rises 59%. The two items that completed unaided do not rise at all. A denominator built from tokens alone drops that third, and it drops it on exactly the work items autonomous completion rate is already counting as failures, so the ratio and the cost understate the same rows.
Including the human review in the price of a completed task is not an idiosyncratic choice. Agent-evaluation practice does the same thing: Arize defines cost per resolution as "the full price of a completed task across the agent path", counting prompts, retrieved context, tool calls, retries, handoffs and human review, then dividing total agent cost by successful resolutions. The cost object described here is that definition with an identifier attached, so the division can be done from a billing dataset rather than by hand.
The mock-up's headline figures follow from the same object. An overall score of 42.0% decomposes as 0.772 times 0.852 times 0.638, which is 318 of 412 work items finished unaided, 271 of those merged, and 173 of those moving a KPI. Cost per completed task reads $241 and cost per KPI-moving task reads $443. Both divide the same blended cost by a different count, so the gap between them is the price of the 145 completed work items that moved nothing: 47 that never cleared review and 98 that merged and changed no measure. That gap is the yield number, and it is invisible in any report keyed to a model or an account.
What is available before the object exists: where an application already emits a completion signal, that signal can serve as an allocation key, which gives cost per completed task without a work-item identifier. Cloudaware's unit economics capability ingests a signal of that kind through a Data Manager recipe and uses it as the allocation key, so completed tasks, documents processed or conversations handled become the divisor on the allocated AI spend. The priced work item, with human escalation minutes in the same object, is a proposal and not a feature.
The three investment zones turn a ratio into a spending decision
Bland's second structure converts the score into a spending decision: which of three zones a workload occupies, and therefore whether the next increment of tokens will still move the product. A workload occupies one zone at a time and moves between them, which is why Bland puts the question at every point rather than once.
| Zone | How the ratios read | The decision |
|---|---|---|
| Under-invested | Features exist but do not compose into anything a user can finish, so value generation is low for reasons unrelated to the agent | Keep spending to reach critical mass. Do not read value generation as a verdict on the agent yet |
| Leverage | Each increment still improves the product, and all three ratios respond to engineering work | Stay here as long as possible. Use completion and token efficiency to locate the engineering defect |
| Saturation | Value generation falls while completion and token efficiency hold | Move the tokens to another application. Net-new features have stopped paying |
The question Bland wants attached to every work item is short: "what is the next token worth right now?" Answering it needs the ratios computed per work item rather than per account, because the comparison is between candidate pieces of work, not between months.
His own worked timeline shows why the three have to stay separate. A score starts healthy; then autonomous completion drops because of an idiosyncrasy in how an API was constructed; then token efficiency drops because merge standards were not met; the engineering problems get worked out and the score climbs; and then value generation drops because a user hit a retry loop in the shipped feature. Those are four different causes behind one line on a chart. Reading that line without the components tells a team that something is wrong and nothing about which system to open.
The boundary on the zones: zone placement is a judgment about the product, not a reading from the dataset. Nothing in a billing dataset says whether a feature is gold plating, and Bland's own example of saturation is adding dark mode. The ratios narrow the argument. The product owner still makes the call. For how that responsibility usually splits between FinOps, engineering and product, see FinOps personas.
Agentic unit economics names the capability without coining a metric
This measurement does not need a new metric name. At least six are already in circulation, and adding another would cost every practitioner a translation step for nothing.
| Name already in use | Where it comes from | What it measures |
|---|---|---|
| Cost to serve, for the TCO of AI | The Tokenomics Foundation's published roadmap, under the Linux Foundation | "the whole bill of materials, expressed as cost per call rather than cost per token" |
| Cost per outcome | FinOps Foundation token-economics writing | "cost per outcome, traced through to cost per inference, traced through to cost per token" |
| Cost per inference and cost per API call | The FinOps for AI working group's KPI list | The cost of a single inference, and the average cost of an API call to an AI service |
| Cognitive efficiency score | A compendium of agent criteria, metrics and benchmarks | Tokens plus tool-call equivalents, divided by successfully completed tasks |
| Cost per resolution | Agent-evaluation practice, under cost metrics for agent efficiency | The full price of a completed task across the agent path, human review included |
| Overall agent efficiency score | Bland's talk | The product of the three ratios above |
The useful label for the capability is agentic unit economics, because Unit Economics is already a named capability in the FinOps Framework and this is that capability with a unit of agent work as the denominator. Nothing new has to be defined for a FinOps practitioner to recognize the discipline, which matters when the work has to be funded by someone who read the Framework first. For the Framework's own structure, see FinOps domains and the FinOps framework guide.
What no framework currently reports is the share of AI spend that cannot be attached to any of those denominators. That is the term worth owning: unattributed AI spend. It is the honest adoption metric for an agent program, it is computable from billing data alone, and its value determines whether the other numbers on the page mean anything.
Four steps to make agent efficiency computable
Each step produces an input the next one needs, and the first two are prerequisites rather than improvements: a ratio computed before them will be wrong in a direction nobody can estimate.
- Report unattributed AI spend before any ratio. One percentage and one breakdown by AWS account, Azure subscription and GCP project, plus a line for each directly billed vendor key. Publish it at the same cadence as the cloud cost anomaly and budget review, so the trend is visible rather than negotiated. In FinOps lifecycle terms this is Inform work, and nothing in Optimize or Operate stands up without it.
- Choose the identifier the work item will carry, then set it at every call path. The backlog already has one. The work is propagating it through planners, sub-agents, tool calls, retries and fallback models, and verifying each path rather than assuming it. A path that drops the identifier does not produce an error; it produces a quietly smaller denominator.
- Compute each ratio on its own attributed denominator and keep the three apart. The product is useful to a product owner and useless to an engineer. Report autonomous completion rate with the escalated count beside it, token efficiency ratio with the rejected count, and value generation ratio with the shipped-but-flat count. Putting all three on the monthly FinOps review is what turns them into triggers for an investigation rather than lines in a deck.
- Price the escalation. Record the minutes a person spent finishing what the agent handed over, at a rate the organization agrees once. Without it, the recorded cost of a work item stops at the moment the agent handed over, and nobody sees what the handover cost.
Bland's own ambition sits one step past this. He wants the whole thing treated as a control problem: "I want us to start thinking of this as a closed control problem", with predictive models that recommend the cheapest decomposition of a goal into tasks. That is the ambition behind augmented FinOps generally, and it carries the same prerequisite. A controller needs a measured variable. Every variable in that loop is a ratio over attributed spend, which puts attribution on the critical path to the prediction rather than beside it.
Organizations running agents across several clouds and direct vendor APIs need the attribution before the ratios, on a dataset that spans every provider the agents call.
Attribute AI spend to the work it was spent on with Cloudaware
Cloudaware attaches every line of AI spend to the application, team and owner consuming it, inside the FinOps platform that already governs cloud spend. It consumes billing data from Amazon Bedrock, Vertex AI, Microsoft Foundry, OpenRouter, Anthropic and OpenAI, generates a dataset in the FinOps Foundation's FOCUS format from their metering data, and delivers cost allocation, optimization, forecasting, unit economics, budgeting and anomaly management on that one dataset. That is the denominator side of all three ratios, kept current as models, prices and applications change.
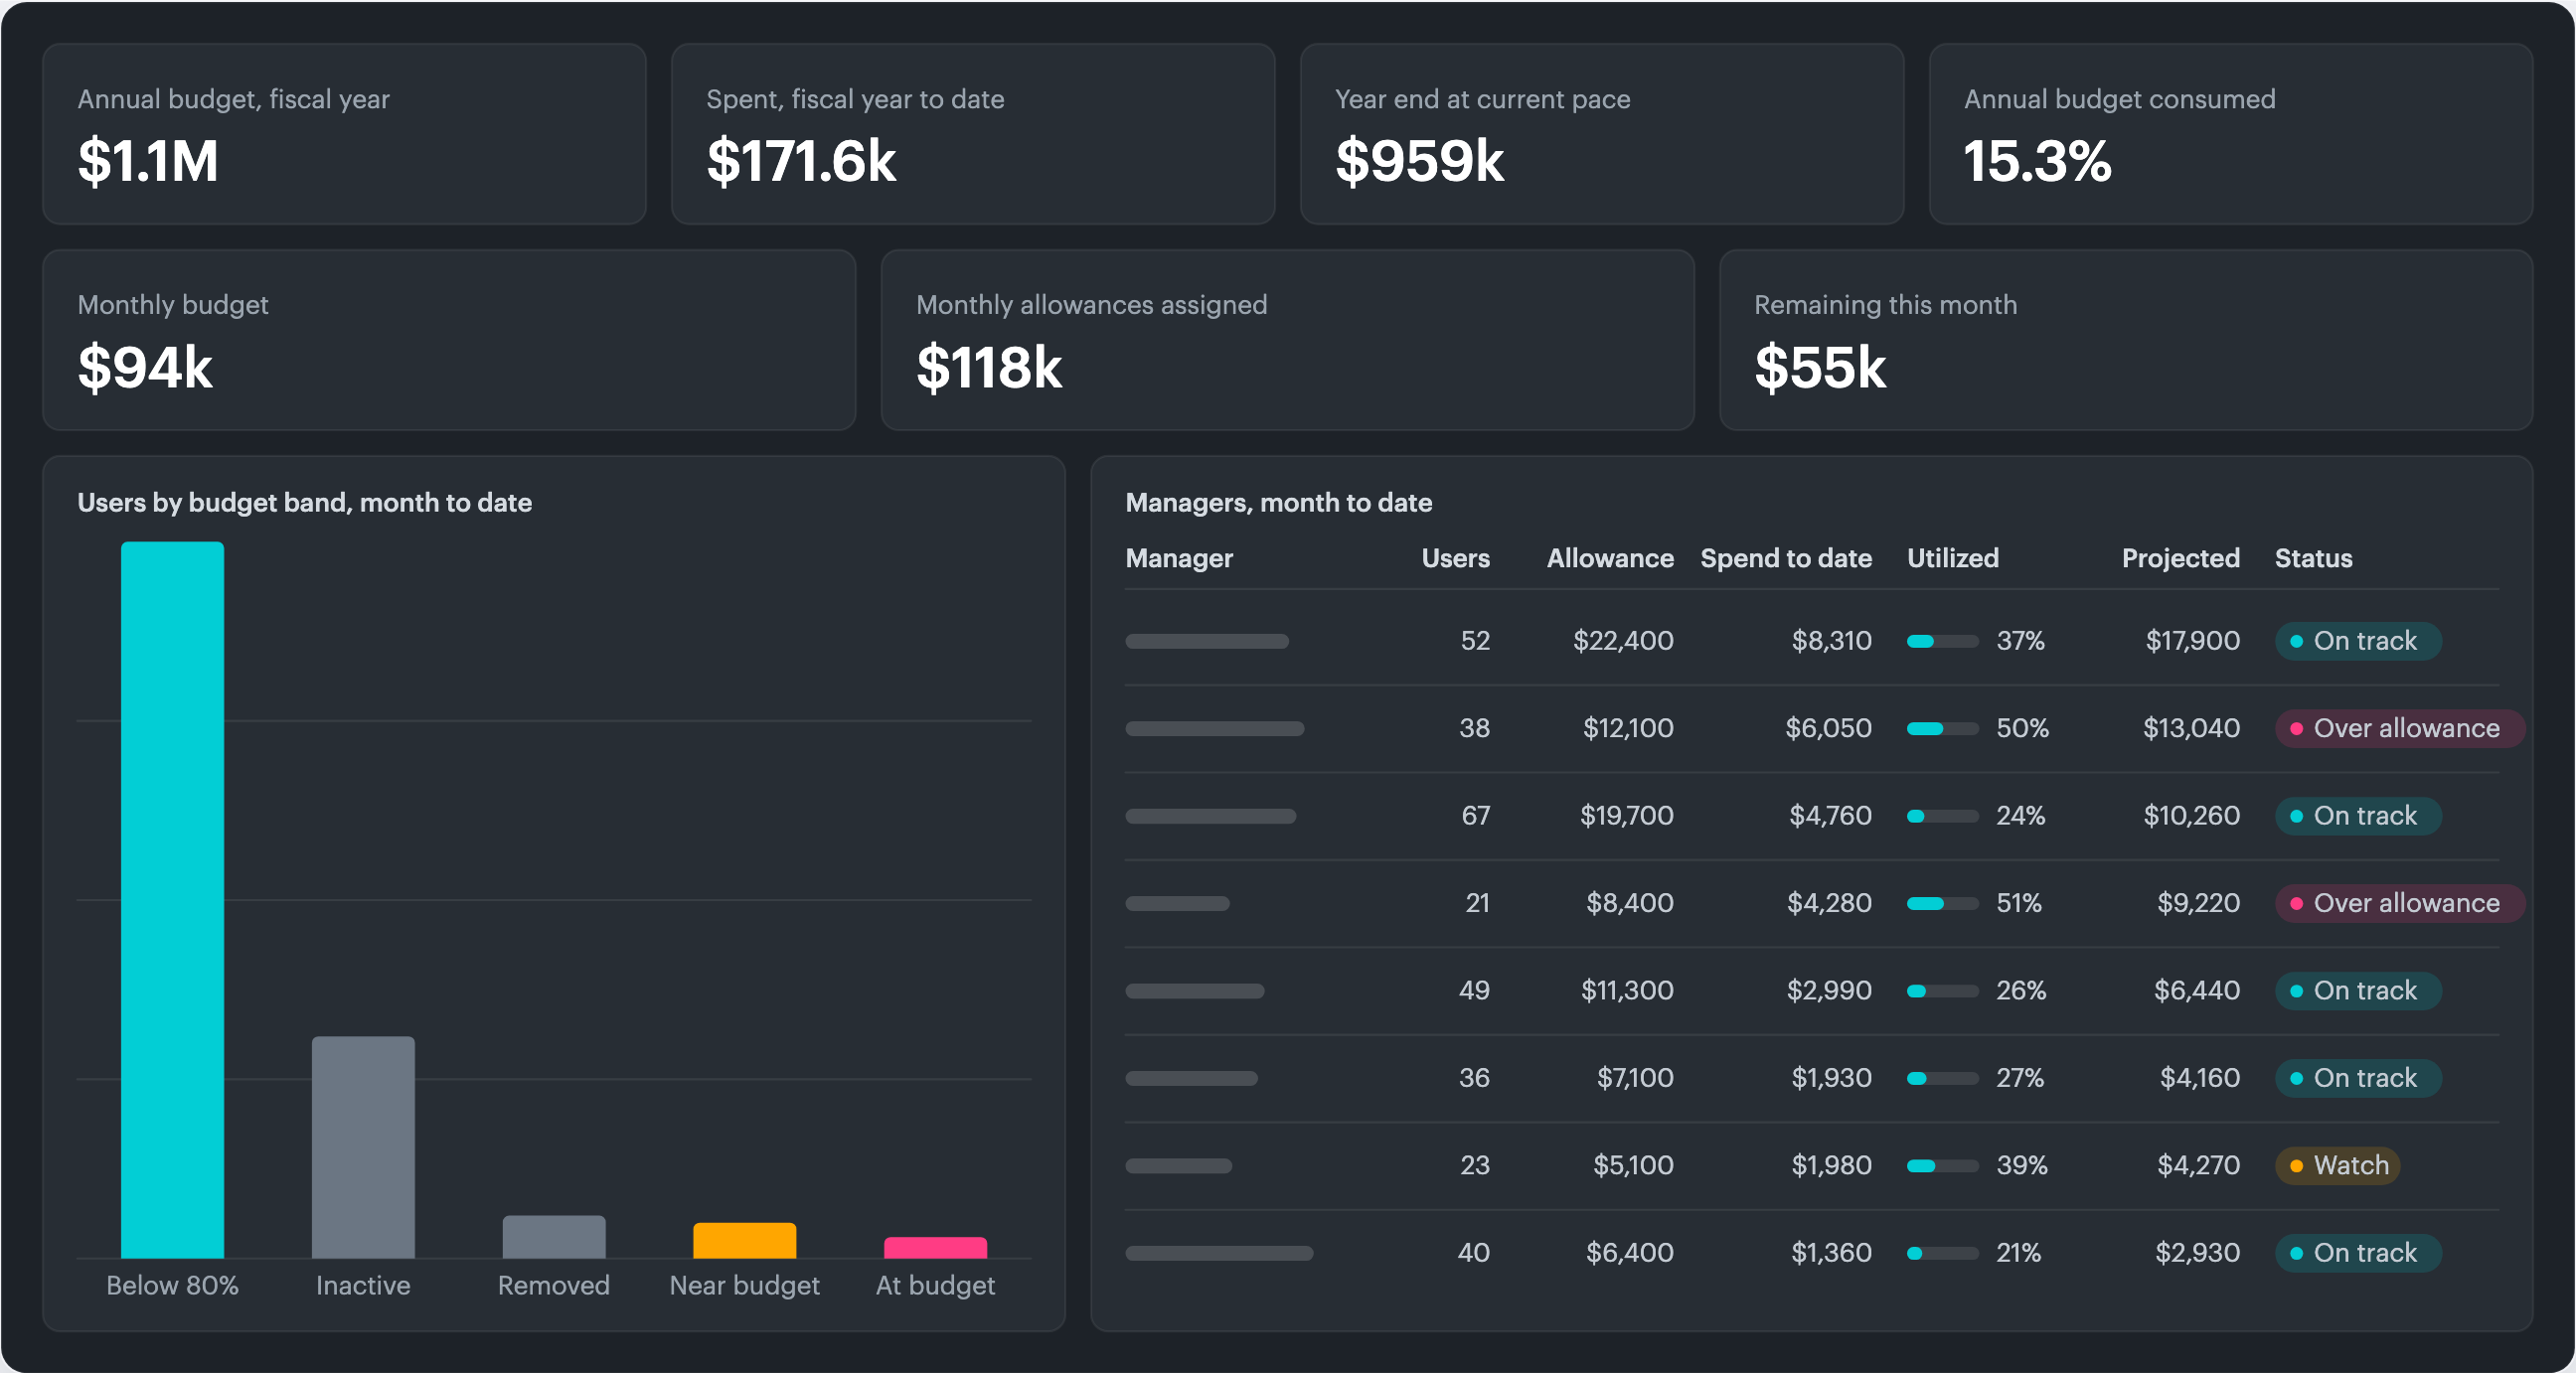
Illustration of the budget and allocation view of the AI FinOps Command Center in Cloudaware: annual and monthly budget against actual spend, users grouped by budget band, and the allowance of every manager and user.
Core capabilities:
- AI cost allocation: every line of AI spend attributed to the application, team and owner that consumed it, through the service catalog and multi-signal mapping rather than tags alone, so spend lands on an application even where tagging is incomplete.
- Unattributed AI spend as a reported line: spend no rule can attribute stays visible by account, subscription and project instead of being spread across the applications around it, with showback and chargeback on the attributed remainder.
- Unit economics: a business signal ingested through a Data Manager recipe becomes the allocation key, so completed tasks, documents processed or conversations handled divide the allocated AI spend from the same dataset.
- Budgeting and forecasting: a monthly budget and a token allowance per team and per user, with month-end spend projected from the current run rate, on the same basis as cloud cost forecasting.
- Anomaly management: AI spend that departs from an application's baseline flagged with the application and owner already attached, so the alert arrives with a named owner instead of needing one found.
- The service graph: each application held with its infrastructure, its owner, its dependencies, its cost, its vulnerabilities and its recent changes, discovered through cloud APIs rather than entered by hand, with third-party business data on the same graph. That is the record an autonomous completion rate or a value generation ratio attaches to. See multi-cloud CMDB, what a CMDB is and service mapping.
Cloudaware does not produce autonomous completion rate or token efficiency ratio. Autonomous completion rate comes from the agent harness's own run telemetry and token efficiency ratio comes from source control, and neither is present in provider billing data. What counts as business value for a given application, and which zone that application is in, remain decisions for its product and finance owners.