


A CloudTrail PutObject spike, an Azure sign-in anomaly, and a suspicious VPC Flow Log record can all look urgent when they hit a dashboard.
The first question isn’t “did the event happen?” Provider logs can usually prove that. The better question is: which asset did it touch, who owns that asset, what service depends on it, and did the event cross a control boundary?
Cloud security monitoring starts when telemetry becomes an investigation path, not when logs are collected or pushed into another dashboard.
The timing pressure is real. CrowdStrike reported that the average eCrime breakout time fell to 29 minutes, with the fastest observed breakout at 27 seconds. If a monitoring program stops at alert creation, it’s not fast enough for the way cloud incidents unfold now.
Key insights
- Cloud security monitoring is not just log collection: It collects, normalizes, enriches, analyzes, and routes cloud security signals so teams can detect risky access, suspicious changes, configuration drift, network anomalies, workload behavior, and compliance-relevant events.
- Cloud monitoring and cloud security monitoring answer different questions: Cloud monitoring checks whether systems are available and healthy. Cloud security monitoring checks whether access, configuration, exposure, data activity, and workload behavior still match the approved security model.
- The weak point is usually context: Cloud teams often have logs, alerts, and dashboards, but alerts still fail during triage when they lack asset, owner, environment, service, risk, and response context.
- Multi-cloud monitoring needs a common investigation model: AWS, Azure, GCP, VMware, and hybrid environments produce different fields and severity logic, so teams need normalized context while preserving provider-level detail for forensic review.
- Effective cloud security monitoring connects alerts to action: A useful finding should show what happened, which asset or service was affected, who owns the response, what action was taken, and what control changed afterward.
- 2026 pressure makes manual triage harder to defend: Faster attacker movement, vulnerability-led breaches, hybrid cloud complexity, and non-human identity growth make owner mapping, asset context, and evidence preservation part of the monitoring program.
- For tool selection, use separate evaluation guides: For a broader platform view, check our guide to the 10 best cloud security tools in 2026, with reviews and pricing. For assessment-focused tooling, check our guide to the 12 best cloud security assessment tools for 2026.
What is cloud security monitoring?
Cloud security monitoring is the continuous collection, normalization, enrichment, analysis, and response process used to detect risky access, suspicious changes, configuration drift, network anomalies, workload behavior, and compliance-relevant events across cloud environments.
| Cloud monitoring | Cloud security monitoring | |
|---|---|---|
| Primary question | Is the system healthy and available? | Is the environment still operating inside the expected security model? |
| Main signals | Uptime, latency, capacity, errors, usage | IAM changes, exposed resources, data access, network flows, workload behavior, drift |
| Main users | Platform, SRE, infrastructure teams | Security engineering, SOC, cloud security, compliance, platform owners |
| Output | Performance and availability insight | Triage-ready security evidence and response path |
Cloud monitoring keeps systems running. Cloud security monitoring proves whether access, configuration, exposure, data activity, and workload behavior still match approved IAM scope, network boundaries, logging requirements, and configuration baselines.
Three references define the control boundary:
- NIST SP 800-137: Continuous monitoring means ongoing awareness of security, vulnerabilities, threats, and changes so teams can make risk decisions.
- NIST CSF 2.0: Detect sits with Govern, Identify, Protect, Respond, and Recover, so monitoring belongs inside the full security loop.
- CIS Controls 8 and 13: Audit log management and network monitoring are control areas, not optional dashboard features.
Cloud based security monitoring depends on provider logs, identity systems, flow records, workload telemetry, configuration state, and asset records. The provider emits many signals. The customer decides what to collect, retain, correlate, and act on. If the process ends at “alert created,” it’s unfinished.
What cloud based security monitoring includes
Cloud security monitoring includes several signal types that need to be collected and interpreted together.
- A control-plane event may be harmless until it is combined with a privileged identity change.
- Network flow may be routine until it points from a production workload to an unfamiliar destination.
- Configuration drift finding may look low priority until the affected asset stores regulated data.
The useful test is simple: what breaks if this signal is missing?
| Component | What it covers | Example signals | Typical owner |
|---|---|---|---|
| Identity and access | Privileged access, failed sign-ins, service principals, managed identities | Azure Sign-in logs, AssumeRole events, IAM changes | IAM / SecOps |
| Audit and control-plane activity | API actions, resource creation, configuration changes | CloudTrail, Azure Activity Logs, GCP Audit Logs | Cloud platform / SecOps |
| Network activity | Flow behavior, ingress, egress, suspicious destinations | VPC Flow Logs, Azure Virtual Network Flow Logs, DNS logs | Network / SecOps |
| Workload and runtime activity | Cluster actions, host changes, container behavior | Kubernetes audit logs, process events, file integrity changes | Platform / security engineering |
| Data access | Sensitive object reads/writes, policy violations | S3 access logs, GCP Data Access logs | Data security / GRC |
| Configuration and posture | Drift, exposed resources, missing controls | Public storage, changed security group, disabled logging | Cloud security / platform |
| Response and evidence | Ticket, owner, timeline, closure | Incident record, MTTR, exception history | SOC / compliance |
AWS CloudTrail records actions taken by a user, role, or AWS service as events.
Azure Activity Logs capture subscription-level operations such as resource create, update, and delete actions, with default retention of 90 days unless exported.
Google Cloud Audit Logs help answer “who did what, where, and when,” while Data Access logs often require explicit enablement.
Kubernetes audit logs provide a chronological record of cluster actions, including who initiated an action, what object was affected, and where the request came from.
A storage bucket is a clean example. It can produce API events, object access logs, configuration changes, data classification signals, and policy findings. None of those signals is enough by itself. Monitoring becomes useful when they are connected to the application, environment, owner, data type, exposure state, and expected access pattern.
Read also: What Are Cloud Security Services? Types, Use Cases, and How to Choose
How cloud security monitoring works
Cloud security monitoring works as a pipeline from telemetry to a decision. A typical workflow looks like this:
- Discover log and telemetry sources
- Ingest cloud, identity, workload, and network events
- Normalize fields across providers and formats
- Enrich events with CMDB, owner, environment, app, criticality, and service context
- Analyze events with correlation rules, anomaly detection, behavior baselines, and threat-informed detections
- Prioritize findings based on severity, exposure, criticality, and blast radius
- Route alerts to the right owner or SOC queue
- Trigger response workflows, tickets, runbooks, or containment
- Preserve evidence and tune rules based on closed incidents
The data model matters as much as the pipeline. If an event can’t resolve to an owner, environment, service, and escalation path, it’s not ready for tier-1 triage.
| Examples | Why it matters | |
|---|---|---|
| Raw event | Event name, principal, source IP, region, timestamp | Proves the action happened |
| Cloud context | Account, subscription, project, resource ID, service | Places the event in provider scope |
| Asset context | CI, owner, app, environment, criticality | Makes triage possible |
| Security context | Exposure, vulnerability, IAM scope, data class | Determines severity |
| Workflow context | Queue, owner, SLA, runbook, exception | Turns alert into action |
NIST SP 800-137 frames continuous monitoring as a process that includes defining a strategy, implementing monitoring, analyzing and reporting findings, responding, and reviewing or updating the program.
Behavior-based detection also belongs in the loop. Sysdig shows that more than 70% of organizations use behavior-based detections, and that 140% more organizations automatically kill processes when specific detections trigger.
A failed sign-in from a new geography is not automatically high severity. But if the account is privileged, tied to a production subscription, and has access to a payment dataset, the priority changes.
Read also: 5 Hybrid Cloud Security Best Practices for 2026
What logs should you collect for cloud security monitoring?
Log management in the cloud starts with coverage, retention, normalization, and queryability. Collecting every possible log sounds safe until storage cost, indexing delay, duplicate alerts, and analyst fatigue turn the monitoring system into a swamp with invoices.
Start with logs that explain identity, control-plane activity, network movement, data access, workload behavior, and configuration change.
| Priority | Log type | Why collect it |
|---|---|---|
| Tier 0 | Audit and control-plane logs | Proves who changed cloud resources |
| Tier 0 | Identity and sign-in logs | Shows access attempts, privileged behavior, and account misuse |
| Tier 0 | Network flow logs for production networks | Supports ingress, egress, and traffic-pattern investigation |
| Tier 1 | Storage and object access logs for sensitive data stores | Supports data access and exfiltration review |
| Tier 1 | Kubernetes audit logs for production clusters | Shows cluster-level actions and API behavior |
| Tier 2 | DNS, load balancer, and edge logs | Helps with traffic analysis, exposure review, and investigation timelines |
| Tier 2 | Billing and cost anomalies | Supporting signal for resource abuse, not primary detection |
- For AWS, VPC Flow Logs capture information about IP traffic going to and from network interfaces in a VPC. S3 monitoring can combine CloudTrail logging for bucket and object API operations with S3 server access logging for object-level request visibility.
- For Azure, Microsoft Entra sign-in logs show who signed in, how they signed in, and what resource they accessed, including service principals and managed identities. Azure Virtual Network Flow Logs record IP traffic through a virtual network and can export to SIEM or IDS tools.
- For GCP, Cloud Audit Logs cover administrative activity and access activity, but Data Access logs often need to be enabled deliberately for services where access visibility matters.
A strong monitoring program collects only telemetry tied to detection, investigation, compliance, or response goals. Teams reduce cost and complexity by focusing on logs with clear security value. As Katerina notes, if a team cannot explain a log source’s purpose, it should not be ingested by default.
Cloud cost monitoring for security as a supporting signal
A sudden compute, GPU, bandwidth, or storage spike can support investigation when it lines up with new resources, unusual regions, network egress, or identity changes. Cost data should not be treated as a standalone detection.
For example, a GPU spend spike in a non-ML account is not proof of compromise. It becomes security-relevant when the same window shows new instance creation in an unused region, new IAM role or policy activity, and outbound traffic to an unfamiliar destination.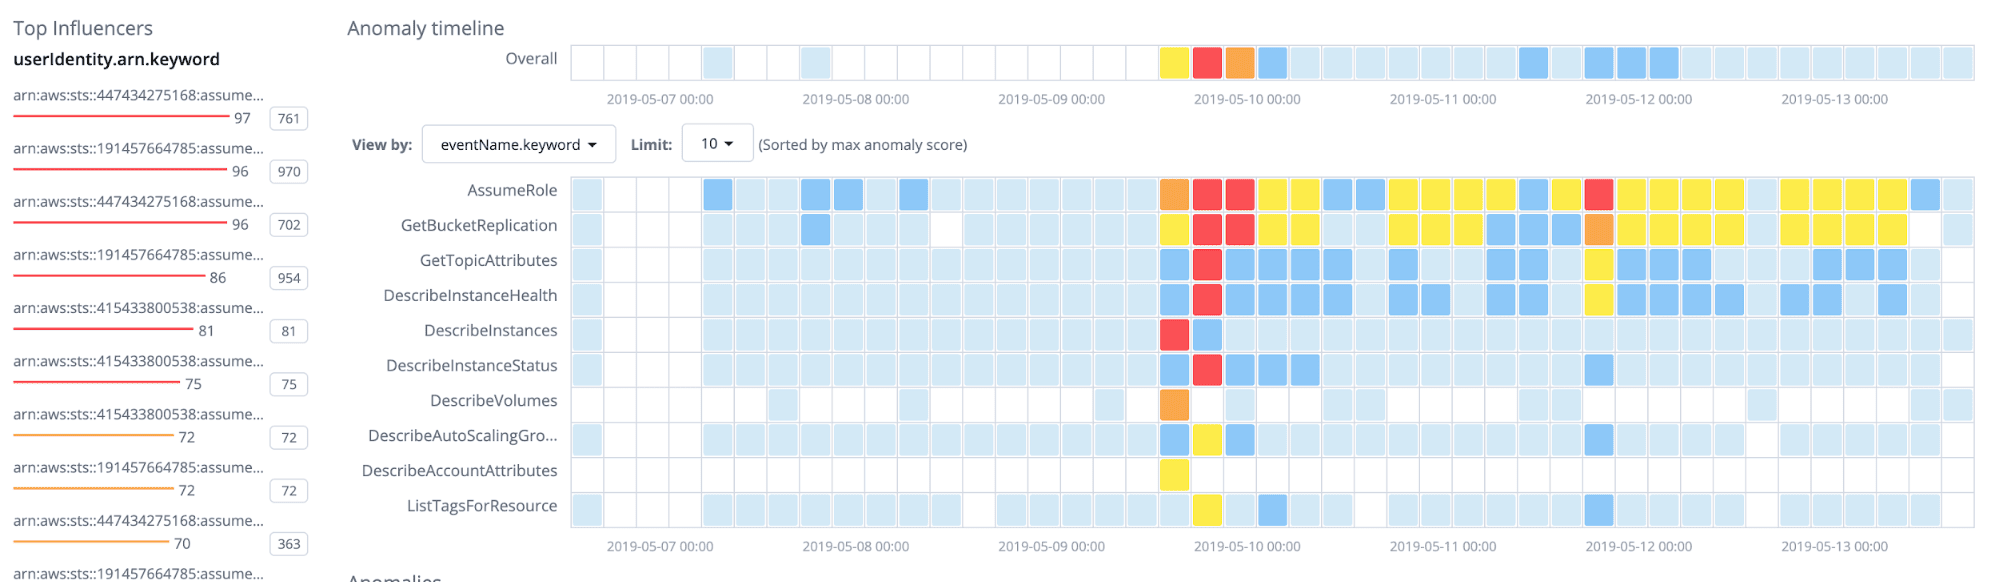 Cloudaware helps investigate this pattern by placing anomaly detection alongside cloud events, network, spending, and CMDB data.
Cloudaware detects unusual AWS activity and breaks it down by influencer, event name, severity, actual volume, and typical baseline. For cost-related anomalies, the same investigation model applies: use the cost spike as the time window, then pivot into related resources, owners, IAM changes, network traffic, and service relationships in the CMDB.
Read also: Cloud Data Security Best Practices - A Playbook for Multi-Cloud and Migration
Cloud security monitoring best practices for enterprise teams
Most monitoring advice starts in the wrong place: enable more logs, add more alerts, review dashboards more often. That is not where enterprise cloud teams usually fail.
Practitioner discussions around AWS, DevOps, and cybersecurity communities agree on the same point: teams need clearer monitoring objectives, stronger log coverage for the sources that matter, and enough context to reduce alert fatigue.
Better monitoring is not just a tooling issue, although teams should still know where their cloud security monitoring tools fit in the workflow.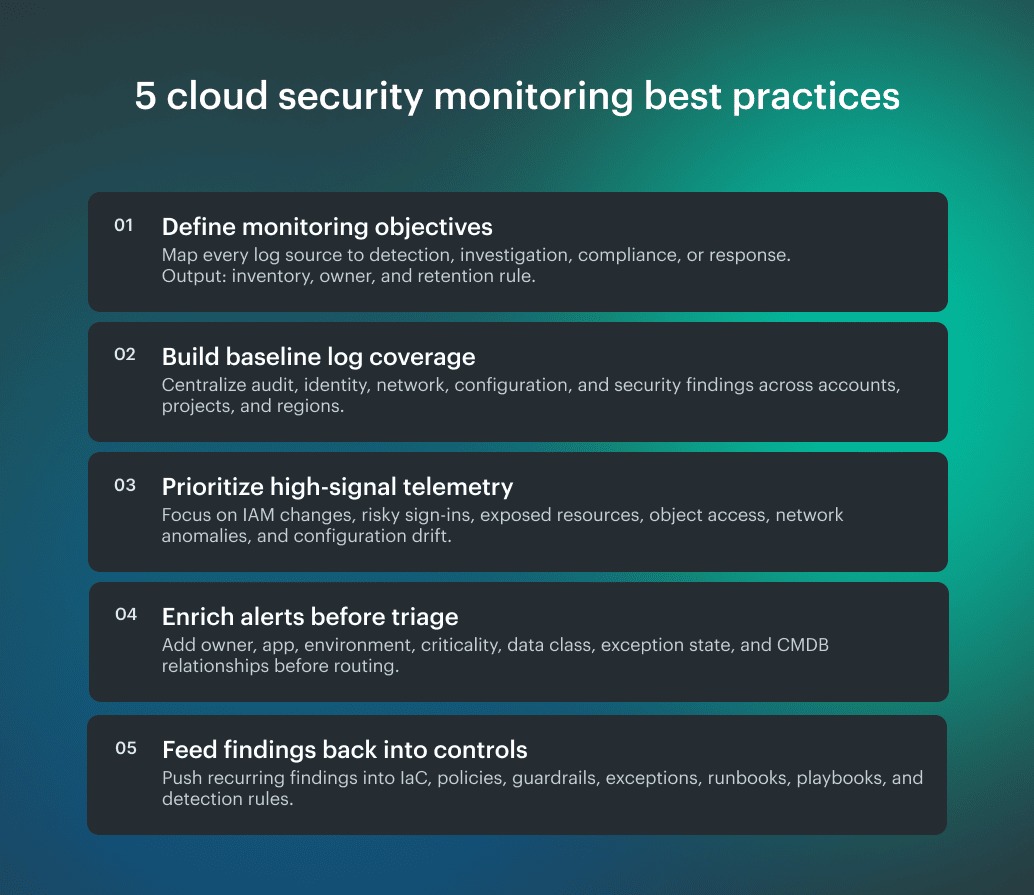
What CIS and NIST recommend for cloud security monitoring
CIS Control 8 defines audit log management as the process to “Collect, alert, review, and retain audit logs of events that could help detect, understand, or recover from an attack.” CIS Control 13 covers network monitoring and defense across enterprise infrastructure.
Together, they support the baseline requirement: cloud teams need audit logs and network evidence that are collected, searchable, retained, and tied to investigation use cases.
NIST SP 800-137 adds the operating loop. Continuous monitoring is not just collection; the process includes defining a strategy, implementing monitoring, analyzing findings, responding, and reviewing or updating the monitoring program.
The practical recommendation is: collect the logs that support real decisions, centralize enough evidence to investigate across cloud accounts, enrich alerts before triage, tune rules by false-positive rate, and push recurring findings back into control design.
Read also: Popular DevSecOps Frameworks for Cloud Security in 2026
Why context matters in cloud network security monitoring
Cloud network security monitoring becomes useful when network events are tied to real assets, owners, environments, applications, data sensitivity, and business services. A denied flow, public IP, DNS query, or unusual outbound connection can be routine or critical depending on what is behind it.
Raw logs don’t know that. A VPC Flow Log record may show source, destination, port, protocol, action, and bytes. Helpful, but incomplete. It still doesn’t tell the analyst whether the source belongs to a production payment application, a test workload, a regulated data pipeline, or an abandoned instance with no owner.
CMDB enrichment changes the triage model. Instead of asking analysts to jump between cloud consoles, tags, tickets, and Slack, enrichment should answer:
- What asset generated the event?
- Which service or application does it support?
- Who owns it?
- Is it production, development, test, or sandbox?
- What data or business process could be affected?
- What changed before the event?
- Which response owner should get the case?
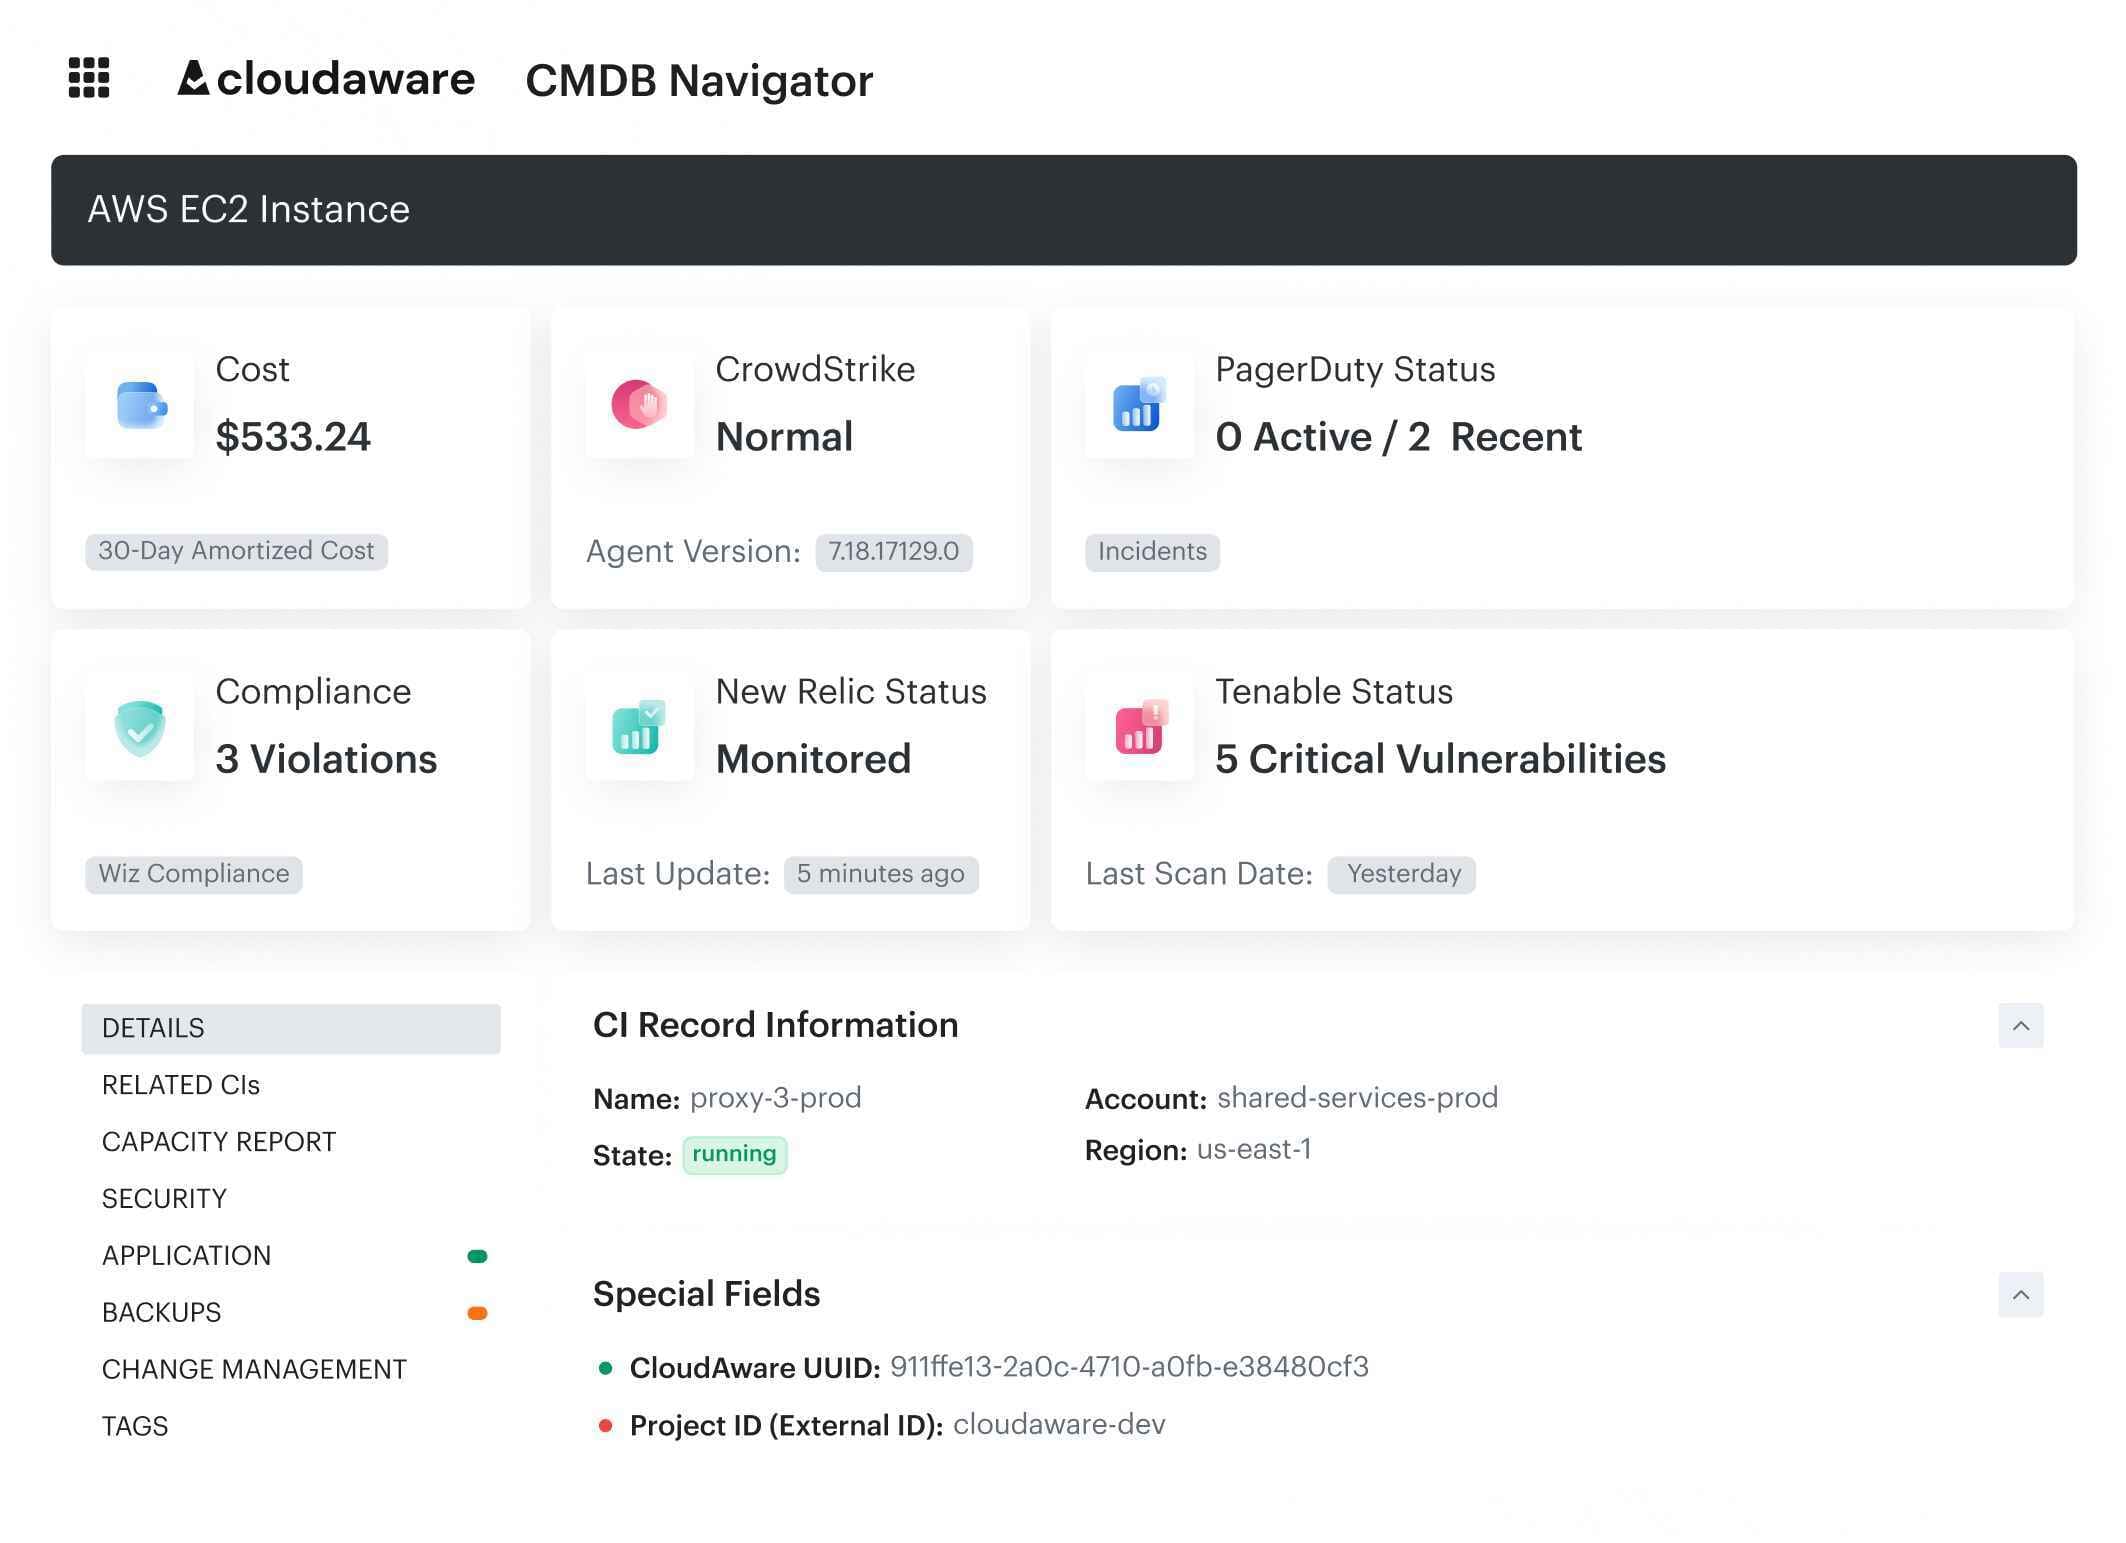 Instead of copying a resource ID into multiple cloud consoles and ticketing systems, an engineer can start from the affected CI and move outward: security posture, incidents, vulnerabilities, application relationship, change history, owner metadata, and response path.
That asset context is what makes MITRE ATT&CK useful in detection work. MITRE ATT&CK’s Cloud Matrix maps cloud events to attacker behavior, but the mapping only helps when the event is tied to the affected asset, identity, service, and blast radius.
The same applies to non-human identities. CSA’s report highlights AI identity risk as an extension of existing NHI problems: visibility, ownership, and credential management. Service accounts, managed identities, API tokens, and AI-related identities need owner, purpose, scope, and lifecycle metadata. Without that context, risky identity activity can look like normal automation.
Read also: How to Create a Cloud Security Policy in 8-Steps
End-to-end example: unusual object activity in cloud storage
A full monitoring path should show how a signal becomes a decision. The example below starts with unusual S3 object activity, then adds the context an engineer needs to decide whether the event is routine access, policy drift, or a real security issue.
| Step | What happens | Monitoring requirement |
|---|---|---|
| Signal | S3 GetObject activity spikes from an unusual principal | Object access logs and CloudTrail events are collected |
| Enrichment | Bucket maps to regulated data store in production | CMDB, data classification, and environment context are available |
| Related event | IAM policy expanded 20 minutes earlier | Identity and control-plane events are correlated |
| Network context | Outbound traffic appears from related workload to unfamiliar destination | VPC Flow Logs are searchable and tied to the asset |
| Priority | Event affects sensitive data and production service | Severity is based on business impact and blast radius |
| Action | Open incident, notify owner, review policy change, preserve evidence | Ticketing and response workflow are connected |
| Follow-up | Add detection for similar identity + storage + egress pattern | Closed incident feeds rule tuning |
The table shows the monitoring path. The screenshot below shows what that path should look like in practice: a finding tied to the affected asset, owner, environment, recent change, policy impact, and next action.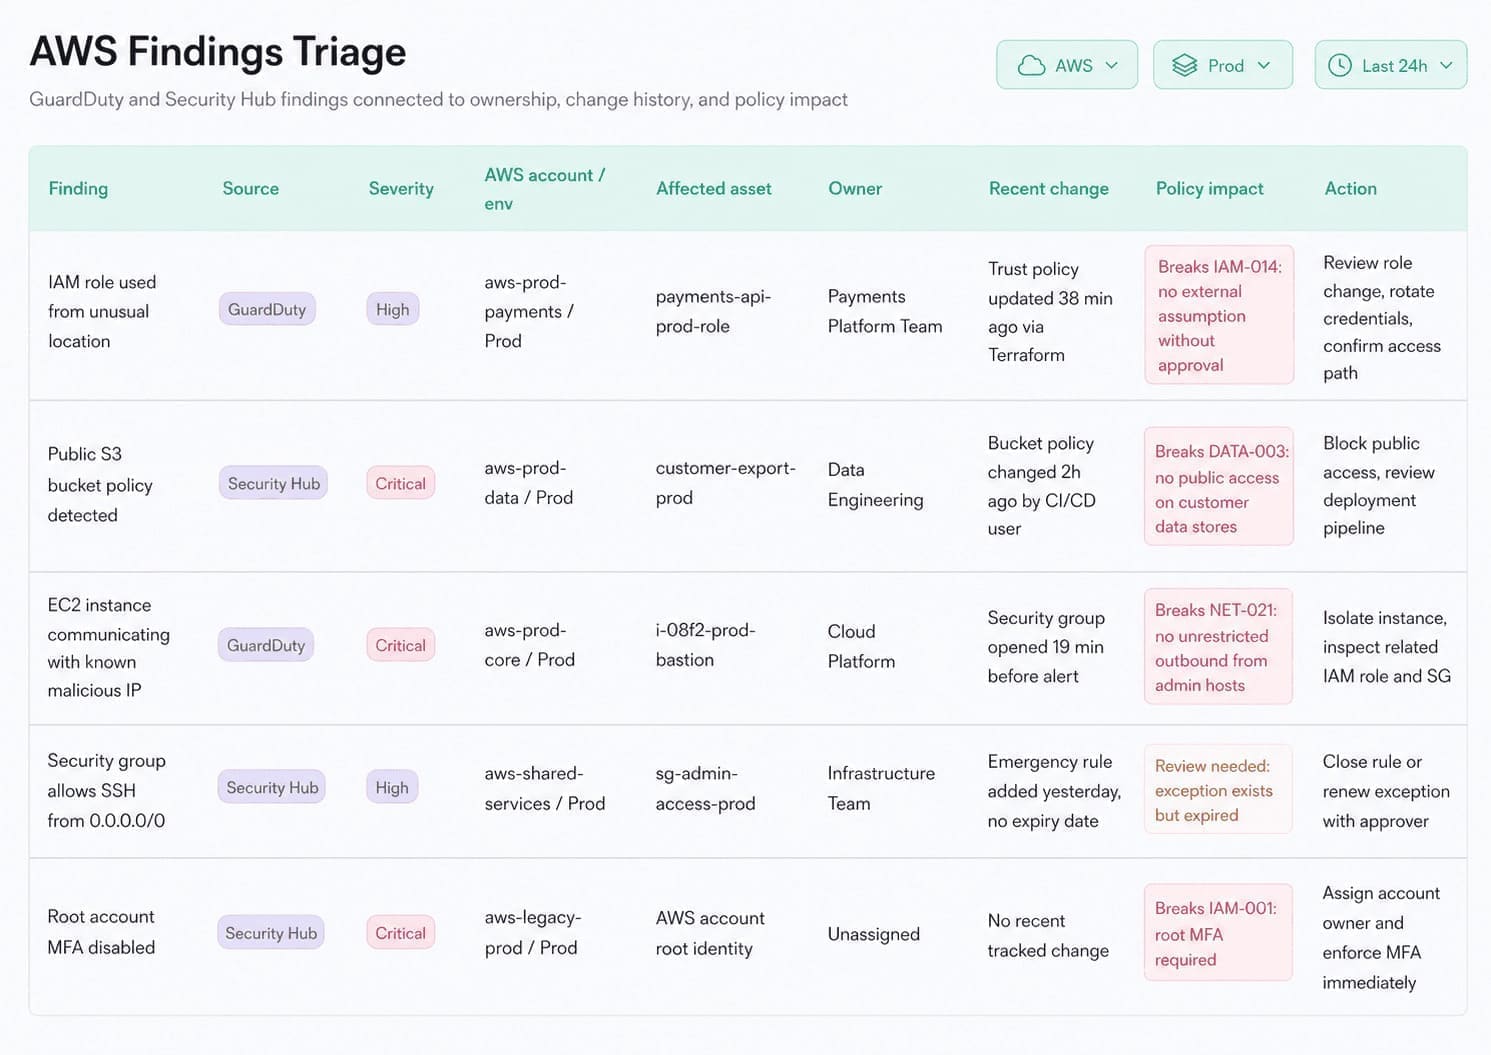 Usually, the analyst has to rebuild this context manually by copying a resource ID across cloud consoles, SIEM alerts, spreadsheets, and ticket threads. Cloudaware brings the investigation context into one triage view: finding source, severity, affected account, environment, asset, owner, recent change, policy impact, and action.
That changes the response. The same alert can be routed as low-risk noise, policy drift, expired exception, or a production incident based on the asset, owner, change history, and control impact behind it.
Read also: Cloud Security Assessment Framework - Matrix, Checklist & Template
Multi-cloud and multi-location monitoring benefits
Fortinet’s 2026 Cloud Security Report states that 88% of organizations now operate across hybrid or multi-cloud environments. The value of multi cloud security monitoring is a common investigation model across provider, account, region, resource, identity, owner, environment, service, policy, detection rule, and response owner.
Multi-cloud is also not always a clean architecture decision. In mid-to-large enterprises, it is often the archaeological record of mergers, platform preferences, shadow IT, compliance boundaries, vendor negotiations, and teams solving problems before central governance showed up with a spreadsheet.
The main cloud security multi-location monitoring benefits are:
- Faster triage: Analysts compare AWS, Azure, GCP, and hybrid signals without rebuilding context for every provider.
- Cleaner exposure review: Security teams can spot region-specific exposure, shadow infrastructure, and inconsistent baselines.
- Better compliance evidence: Teams can show how controls apply across business units, regions, accounts, and regulated services.
- Lower investigation cost: Engineers spend less time copying IDs between consoles and more time validating impact.
- Cost and abuse visibility: Unusual resources, orphaned infrastructure, and suspicious usage patterns can be reviewed alongside cost impact.
The goal is not to flatten every cloud event into generic mush. Analysts still need original provider fields for forensic detail. The goal is to normalize enough context to investigate consistently.
A suspicious outbound flow from AWS and a comparable Azure network event should be readable inside one investigation model. The original provider event should still be available when the analyst needs exact fields.
Signs your cloud security monitoring program breaks
Cloud security monitoring fails fastest when the alert reaches the team before the context does. In 2026, attackers move faster, cloud estates are more fragmented, vulnerability exploitation is a primary breach path, and non-human identities keep multiplying faster than ownership models can catch up.
For example, Verizon reported vulnerability exploitation as the top breach entry point at 31%, and CSA reported that 68% of organizations cannot reliably distinguish AI-agent activity from human activity.
- Faster attacker movement: Alerts that cannot resolve to an owner sit in a queue while someone reconstructs ownership from tags, tickets, Slack, or tribal knowledge. When breakout time is measured in minutes, that delay becomes part of the exposure window.
- Hybrid and multi-cloud evidence gaps: Logging coverage that differs by account, subscription, project, or region makes incident response depend on where the workload happened to run. The team needs a consistent monitoring standard across AWS, Azure, GCP, and hybrid infrastructure.
- Tool sprawl and missing context: Tier-1 analysts should not need cloud console access to triage basic alerts. If the monitoring layer does not show account, region, resource, environment, service, and owner, the alert creates another investigation before response can start.
- Vulnerability-led breaches: Vulnerability alerts lose urgency when they are disconnected from asset criticality, exposure, owner, and service impact. The team sees severity, but cannot decide what must be fixed first.
- Non-human identity growth: New service accounts, managed identities, API tokens, and AI-agent identities create risk when they appear without owner, purpose, scope, and lifecycle metadata. Identity activity then looks like normal automation until access scope becomes unclear during an investigation.
- Configuration drift without control feedback: Repeated drift alerts are a sign that monitoring keeps reporting the same control failure without feeding the fix back into IaC, policy, or guardrails.
These failure points explain why monitoring can look solid in architecture diagrams and still underperform during incidents. A working program keeps enough asset, owner, environment, identity, change, and response context attached to each finding so the next step is clear.
Read also: A 2026 Practitioner Guide to Cloud Security Vulnerabilities
From alerts to response: cloud security monitoring & management
Mandiant’s report states that global median dwell time rose to 14 days, exploits accounted for 32% of intrusions, and organizations first detected malicious activity internally 52% of the time. Verizon reported that vulnerability exploitation became the top breach entry point at 31%, and third-party involvement reached 48% of breaches.
Those numbers point to the same operating problem: monitoring has to preserve enough context to move from detection to response without manual reconstruction. A vulnerability finding needs an owner and the affected service. A cloud alert needs a configuration context. A third-party issue needs dependency mapping before the team can scope impact.
A closed-loop workflow should run like this:
- Detect the event: Capture the cloud, identity, network, workload, or configuration signal.
- Enrich the finding: Add asset, owner, environment, identity, and CMDB context.
- Assign severity: Base priority on exposure, business impact, and blast radius.
- Route the work: Send the finding to the right SOC queue, platform team, service owner, or incident process.
- Open the ticket: Create the Jira, ServiceNow, PagerDuty, or case record with the required technical context.
- Preserve evidence: Attach related events, affected assets, decisions, actions, and timestamps.
- Run the playbook: Validate, contain, remediate, escalate, or approve the exception.
- Measure response quality: Track MTTD, MTTR, false-positive rate, recurrence, and closure quality.
- Improve the control: Push repeated drift or recurring findings back into IaC, policy, guardrails, runbooks, or detection rules.
Audit evidence and engineering evidence answer different questions. Compliance evidence proves the event followed the required process. Engineering evidence proves the condition was fixed or deliberately accepted.
Monitoring can support SOC 2, PCI DSS, HIPAA, ISO 27001, and internal audit by preserving access records, incident evidence, change history, retention, and response decisions. Compliance still depends on control design, scope, governance, and audit requirements.
Read also: Cloud Security Compliance Standards - 8 Frameworks Guide
Resolve security monitoring alerts with Cloudaware
Cloudaware supports cloud security monitoring by making the CMDB the join point between cloud events, affected assets, owners, vulnerabilities, configuration state, policy impact, and response workflows.
Its role sits alongside SIEM, cloud-native security services, scanners, and ticketing systems: keep each finding connected to the operational context teams need to validate impact, route work, fix the issue, and preserve evidence. Core capabilities:
- Unified asset context: Discover and normalize multi-cloud and hybrid infrastructure, then tie each resource to the owner, environment, application, account, region, and related CIs needed for investigation.
- Alert enrichment: Connect cloud findings to the CMDB context so analysts can see which asset was affected, who owns it, which service depends on it, and whether the event affects production, regulated data, or a known exception.
- Multi-cloud investigation model: Give AWS, Azure, GCP, VMware, and hybrid infrastructure a common asset and ownership model while preserving provider-level details for forensic review.
- Vulnerability and exposure prioritization: Move triage beyond severity scores by tying findings to asset criticality, service impact, owner, environment, and remediation path.
- Configuration and policy context: Show whether a finding is tied to drift, a policy violation, an approved exception, or a control gap that needs to be fixed in IaC, guardrails, or operational process.
- Response evidence: Keep the affected asset, finding, owner, decision, action, and closure context connected, so closed alerts can support incident review, audit evidence, and recurring control improvement.