


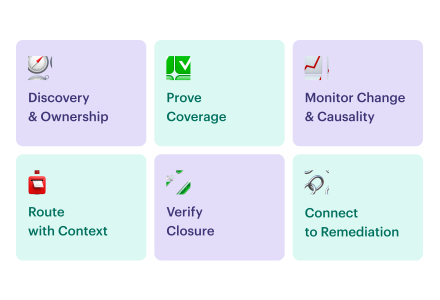
Cloud security observability becomes operational when a signal can survive six questions: What happened? Where did it happen? What changed? Why does it matter? Who owns the response? Can the team prove closure?
Security teams must reconstruct incidents across heterogeneous estates. A 2025 Cloud Security Alliance survey found that 63% of respondents used multiple cloud providers, while 82% maintained some form of hybrid infrastructure. Each environment introduces different resource identifiers, event schemas, ownership records, and retention boundaries.
Alert volume compounds the problem, but missing context creates a separate delay. Cisco’s 2025 global security research found that 57% of respondents lost investigation time to data-management gaps, 59% reported too many alerts, and 55% reported too many false positives.
Cloud security observability connects telemetry with current resource state, relationships, business context, recent changes, ownership, and response evidence. A finding then carries more than severity. It shows whether the resource is exposed, business-critical, reachable, and owned.
Key insights
- Centralized telemetry is an input, not the outcome. Logs become useful when analysts can connect them to the affected resource, service, owner, recent change, and required response.
- Coverage requires an asset-based denominator. Counting connected sources does not show which critical assets lack required, fresh, queryable signals.
- Prioritized events need a minimum context contract. Resource identity, application, environment, owner, exposure, criticality, dependencies, workflow state, and exception status should travel with the signal.
- Time and topology support explanation. A timeline shows what happened. Relationships and before-and-after state help determine what changed and which services may be affected.
- An ownerless alert is operationally incomplete. Routing, SLA, escalation, validation, and closure evidence must be designed before a critical alert fires.
- Decision quality matters more than data volume. Telemetry coverage, context completeness, time-to-context, change-correlation rate, ownerless critical signals, and verified-closure rate reveal gaps that ingestion volume cannot.
What is cloud security observability?
Cloud security observability is the ability to explain the security-relevant state and behavior of a cloud or hybrid environment from its signals and context, then turn that explanation into an owned, traceable action.
Logs, metrics, and traces remain important signal forms. Security teams also work with cloud audit events, identity activity, configuration changes, network flows, host and container events, posture findings, vulnerabilities, and ticket transitions. No individual source supplies the complete operating model.
Adjacent capabilities answer different questions and can coexist in the same architecture.
| Capability | Primary question | Strength | Limit and handoff |
|---|---|---|---|
| Cloud security monitoring | Did a known condition, rule, or threshold trigger? | Continuous checks, alerting, and operational awareness | Sends a signal into investigation and response |
| Visibility and inventory | What assets exist, and how are they configured? | Scope, configuration, ownership, and relationship data | Provides the denominator and context for signals |
| SIEM and CSPM | Which events or posture conditions require attention? | Collection, normalization, correlation, detection, and policy findings | Supplies signal classes that still need business and workflow context |
| Security observability | Can the team explain an unplanned security question and act on the answer? | Connects coverage, context, change, ownership, and evidence | Depends on reliable telemetry, inventory, and operating workflows |
Security observability therefore describes an organizational capability rather than a replacement product category. A SIEM can analyze events. A CSPM platform can expose misconfiguration and policy risk. EDR, scanners, and cloud-native services contribute other signals.
See how cloud security posture management works for the operating model, then compare leading cloud security posture management vendors against your coverage and workflow requirements.
The architecture can share telemetry and context without forcing every team into the same interface. SRE may investigate latency changes in APM while security works with identity anomalies in a SIEM. Both views should preserve the same resource or service ID, environment, deployment version, actor, and timestamp so an analyst can pivot between them.
This approach also reflects practitioner experience with monitoring performance and security together: separate workflows remain useful when they resolve to shared identifiers and change context.
The context-to-action loop
Security observability becomes operational when a signal passes through five gates: coverage, context, causality, ownership, and verified closure. Each gate adds evidence required by the next. Automated routing cannot compensate for an unresolved resource, and a closed ticket does not prove that risk was removed.
Test the loop on one critical business service before applying it across the estate.
1. Prove telemetry coverage
Measure coverage against the resources expected to produce each required security signal, not against the number of connected tools. A healthy connector can still conceal an unmonitored account, region, cluster, or log class.
Track:
- % of in-scope resources producing the required signals
- Median and p95 signal age
- Missing or stale coverage by provider, environment, and critical service
AWS guidance illustrates why configuration matters. A CloudTrail trail may exist while lacking multi-Region coverage, management events, encryption, or log-file validation. The AWS Config managed rule for security trails evaluates those properties rather than treating trail existence as sufficient.
Failure condition: The source is connected, but part of the production estate remains invisible.
2. Add decision-ready context
A resource ID identifies the cloud object. Security leaders also need to know which business service depends on it, how critical and exposed it is, which dependencies affect the risk, and who owns the production decision.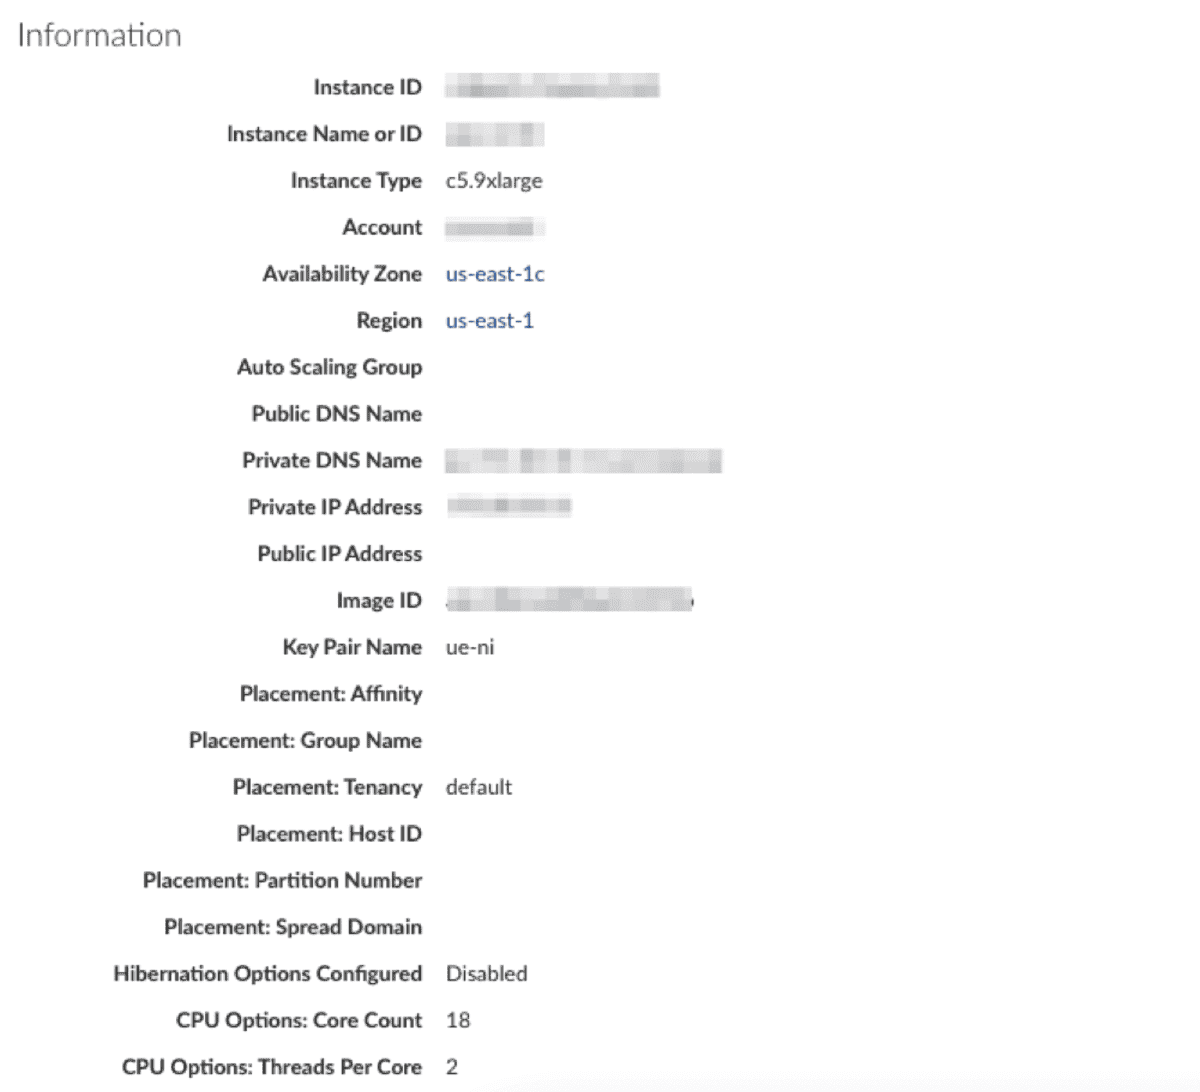 Element of Cloudaware UI. Request a demo to see how it works.
Resolve prioritized signals to a stable CI and attach:
- Application or business service
- Environment and criticality
- Exposure and relevant dependencies
- Accountable owner and resolver group
Report context completeness alongside owner coverage. An aggregate completeness score can conceal a decisive gap, such as production findings without an accountable team.
Failure condition: The resource is identified, but its business impact, exposure path, or owner remains unknown.
3. Build a defensible change timeline
Place the signal beside configuration changes, deployments, identity activity, and prior resource state. The minimum timeline should show the actor, action, changed property, timestamp, and before-and-after state.
Provider evidence has limits. Azure Resource Graph Change Analysis, for example, retains queryable changes for 14 days and does not capture data-plane changes.
Use shared pivots such as resource ID, service, environment, deployment version, actor, and event time to search across tools. Temporal proximity narrows the investigation but does not prove causality.
Failure condition: Events are correlated by time but cannot be tied to a changed property.
4. Obtain accepted ownership
Automatic assignment records where a ticket was sent. Operational ownership begins when the accountable team accepts the case with enough context to act.
Preserve the affected CI and service, supporting evidence, expected action, priority, dependency impact, SLA, and closure test. This prevents the resolver from repeating the investigation across cloud, SIEM, CMDB, and deployment tools.
Track time-to-owner, first-assignment acceptance, ownerless findings, and reassignment rate. Repeated transfers usually expose stale ownership data or incorrect service relationships.
Failure condition: The case is routed but repeatedly transferred, rejected, or left in a generic queue.
5. Verify the production outcome
Ticket closure records workflow status. Risk closure requires new evidence from the affected production state.
After remediation, re-run the relevant policy, configuration query, scanner, or runtime test. Classify the outcome as remediated, accepted exception, resource removed, or false finding. Retain the original signal, affected CI and service, decision, implementation time, validation method, and observed post-action state.
Track validation coverage, implementation-to-validation time, recurring conditions, reopened cases, and expired exceptions. Feed missing telemetry, incorrect ownership, and failed validation back into the next cycle.
Failure condition: The ticket is marked Done, but no control confirms that the condition changed.
Where observability breaks across a hybrid estate
The largest cloud security observability gaps usually occur between tools and operating teams rather than inside an individual telemetry source. A provider service may generate the right event, a SIEM may normalize it, and a scanner may assign severity, yet the organization can still lack the identity, owner, or validation evidence needed to act.
Private cloud environments add hypervisor, management-plane, and self-operated control evidence; the private cloud data security guide covers those execution boundaries.
| Breakpoint | What the team sees | Underlying failure | Operational consequence |
|---|---|---|---|
| Incomplete collection | A source reports healthy while some accounts, regions, clusters, or log classes remain silent | Connector status is used as a proxy for estate coverage | Investigations begin with an unknown blind spot |
| Fragmented identity | Several records describe one resource, or a provider ID cannot be resolved | Tool-specific identifiers are not reconciled to a stable CI | Signals cannot be joined reliably across sources |
| Missing relationships | The finding has a resource and severity but no affected-service scope | Inventory is flat or dependency records are stale | Analysts cannot establish blast radius or route the case correctly |
| Lost change context | Security, deployment, identity, and provider timelines must be compared manually | Shared identifiers and event-time pivots are absent | Correlation takes longer and causal claims remain weak |
| Weak ownership | Findings enter generic queues or move repeatedly between teams | Application and resolver mappings are missing or outdated | Response time is consumed by reassignment |
| Restricted or overexposed context | Teams either lack relevant evidence or receive broader security data than their role requires | Shared telemetry lacks role- and dataset-level access boundaries | Investigations remain fragmented or consolidation creates confidentiality risk |
| Unverified closure | A completed ticket becomes the only proof of remediation | The workflow lacks a post-change validation requirement | The original production condition may persist |
Repair the earliest unreliable dependency. Automated routing cannot compensate for unresolved asset identity, and polished dashboards cannot compensate for an unknown coverage denominator.
How to assess security observability maturity
The maturity model below assesses operating capability rather than product ownership. Score each dimension separately. Use the lowest critical dimension as the next improvement priority instead of averaging away a hard gap.
| Level | Coverage | Context | Causality | Action | Evidence |
|---|---|---|---|---|---|
| 0: Fragmented | Sources and asset lists disagree; blind spots are unknown | Raw, source-specific fields | Manual console hopping | Ad hoc inbox or chat | No reliable evidence chain |
| 1: Centralized | Major sources are ingested; denominator is missing | Common storage and basic fields | Searchable chronology | Manual triage and tickets | Events are retained |
| 2: Normalized | Expected versus observed is available by platform or service | Stable identifiers and normalized schema | Events are grouped by CI and time | Routing rules exist | Source and ticket lineage is retained |
| 3: Contextual | Critical services and dependencies are covered | Owner, app, environment, exposure, criticality, and relationships are current | Change and impact paths are visible | Business-aware prioritization and SLAs | Context completeness and exceptions are measured |
| 4: Closed loop | Coverage is continuously reconciled | Fresh context travels with every action | Cross-cloud timeline supports explanation | Owned workflow, guardrails, retest, and feedback | Verified closure and event-to-action history |
Two hard gates prevent an inflated score:
- A team cannot claim Level 2 coverage while the critical-asset denominator is unknown.
- A team cannot claim Level 4 operation while owner routing, retest, or closure evidence is missing.
For example, a security team may centralize cloud audit logs and host signals, normalize identifiers, and retain tickets. If critical services still lack fresh ownership and change context, the program remains limited at the context stage even if the SIEM layer is mature. Illustrative percentages can help size the gap, but the decision should be based on which required fields and services are missing.
Four dashboards that expose observability gaps
The dashboards that matter reveal where the context-to-action loop is failing. Alert totals, log volume, and closed-ticket counts can improve while critical resources remain silent, analysts search several consoles for basic context, or workflows close without a production-state check.
Security, SRE, and platform teams do not need one undifferentiated dashboard. They need role-specific views that resolve to the same resource, service, environment, deployment, owner, and event time.
Estate and telemetry coverage
This view compares the assets and services expected to produce security signals with those actually producing valid, fresh, queryable data.
Track full and partial coverage by provider, account, subscription, project, cluster, resource type, environment, and service criticality. Include missing sources, median and p95 signal age, coverage drift, and unknown resources producing events outside the approved inventory.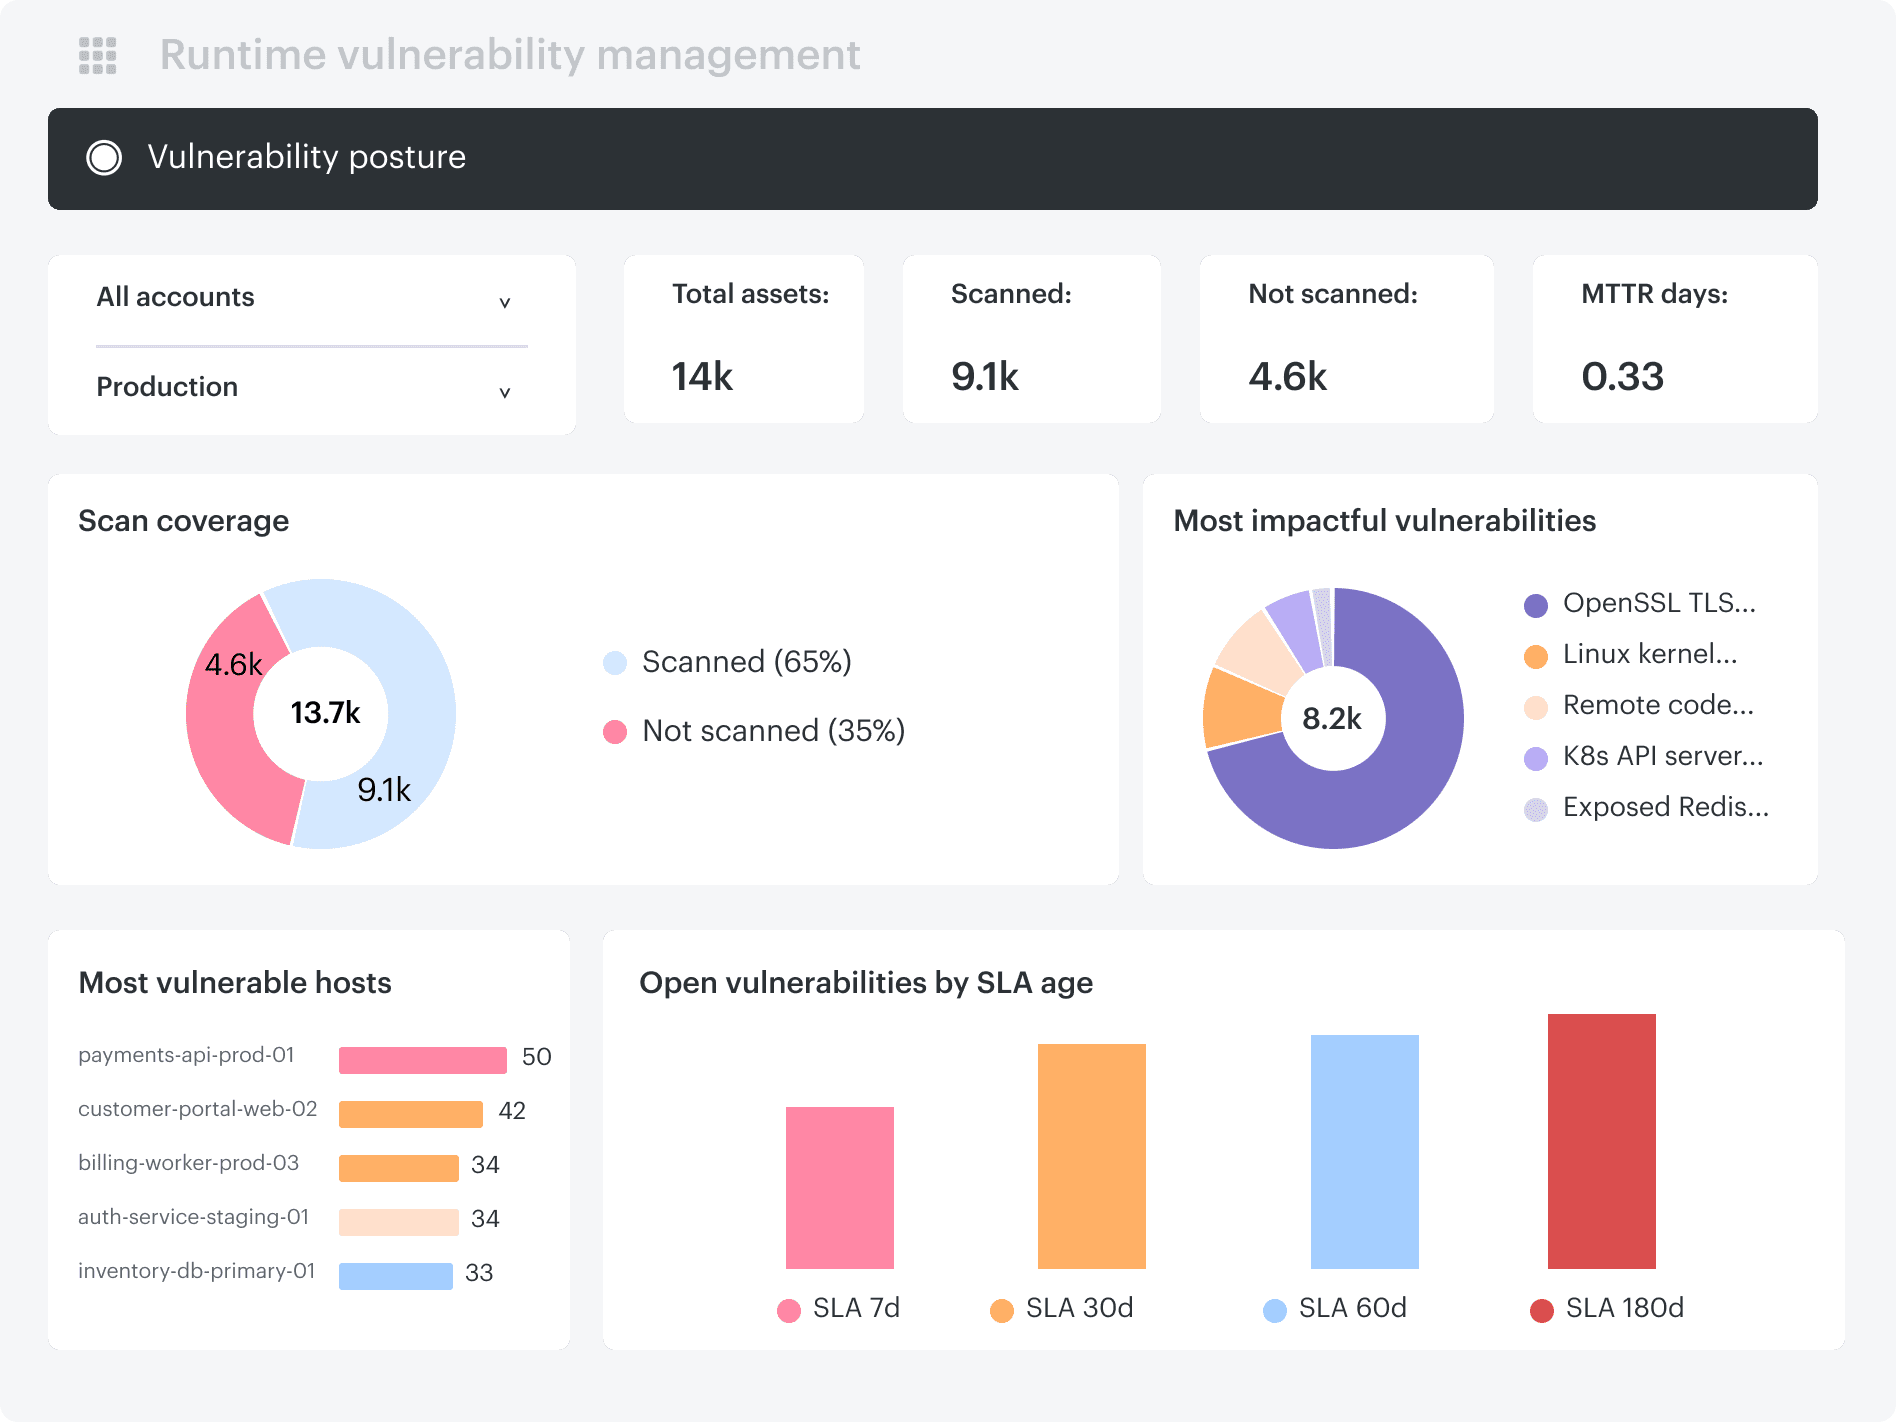 Cloudaware UI dashboard showing asset scan coverage, unscanned resources, vulnerability exposure, and SLA aging.
The dashboard should answer one question: Which collection gap should be fixed first?
“Logs ingested” cannot answer it because a high-volume source may conceal a small, critical population that has gone silent.
Context completeness
This view shows whether an analyst can interpret a prioritized signal without manually enriching it. Track the share of signals that are:
- Resolved to a stable CI
- Mapped to an application or business service
- Assigned to a current owner
- Connected to relevant dependencies
- Paired with recent change history
Report each field separately and as an all-fields rate. A high aggregate can otherwise conceal near-zero owner coverage.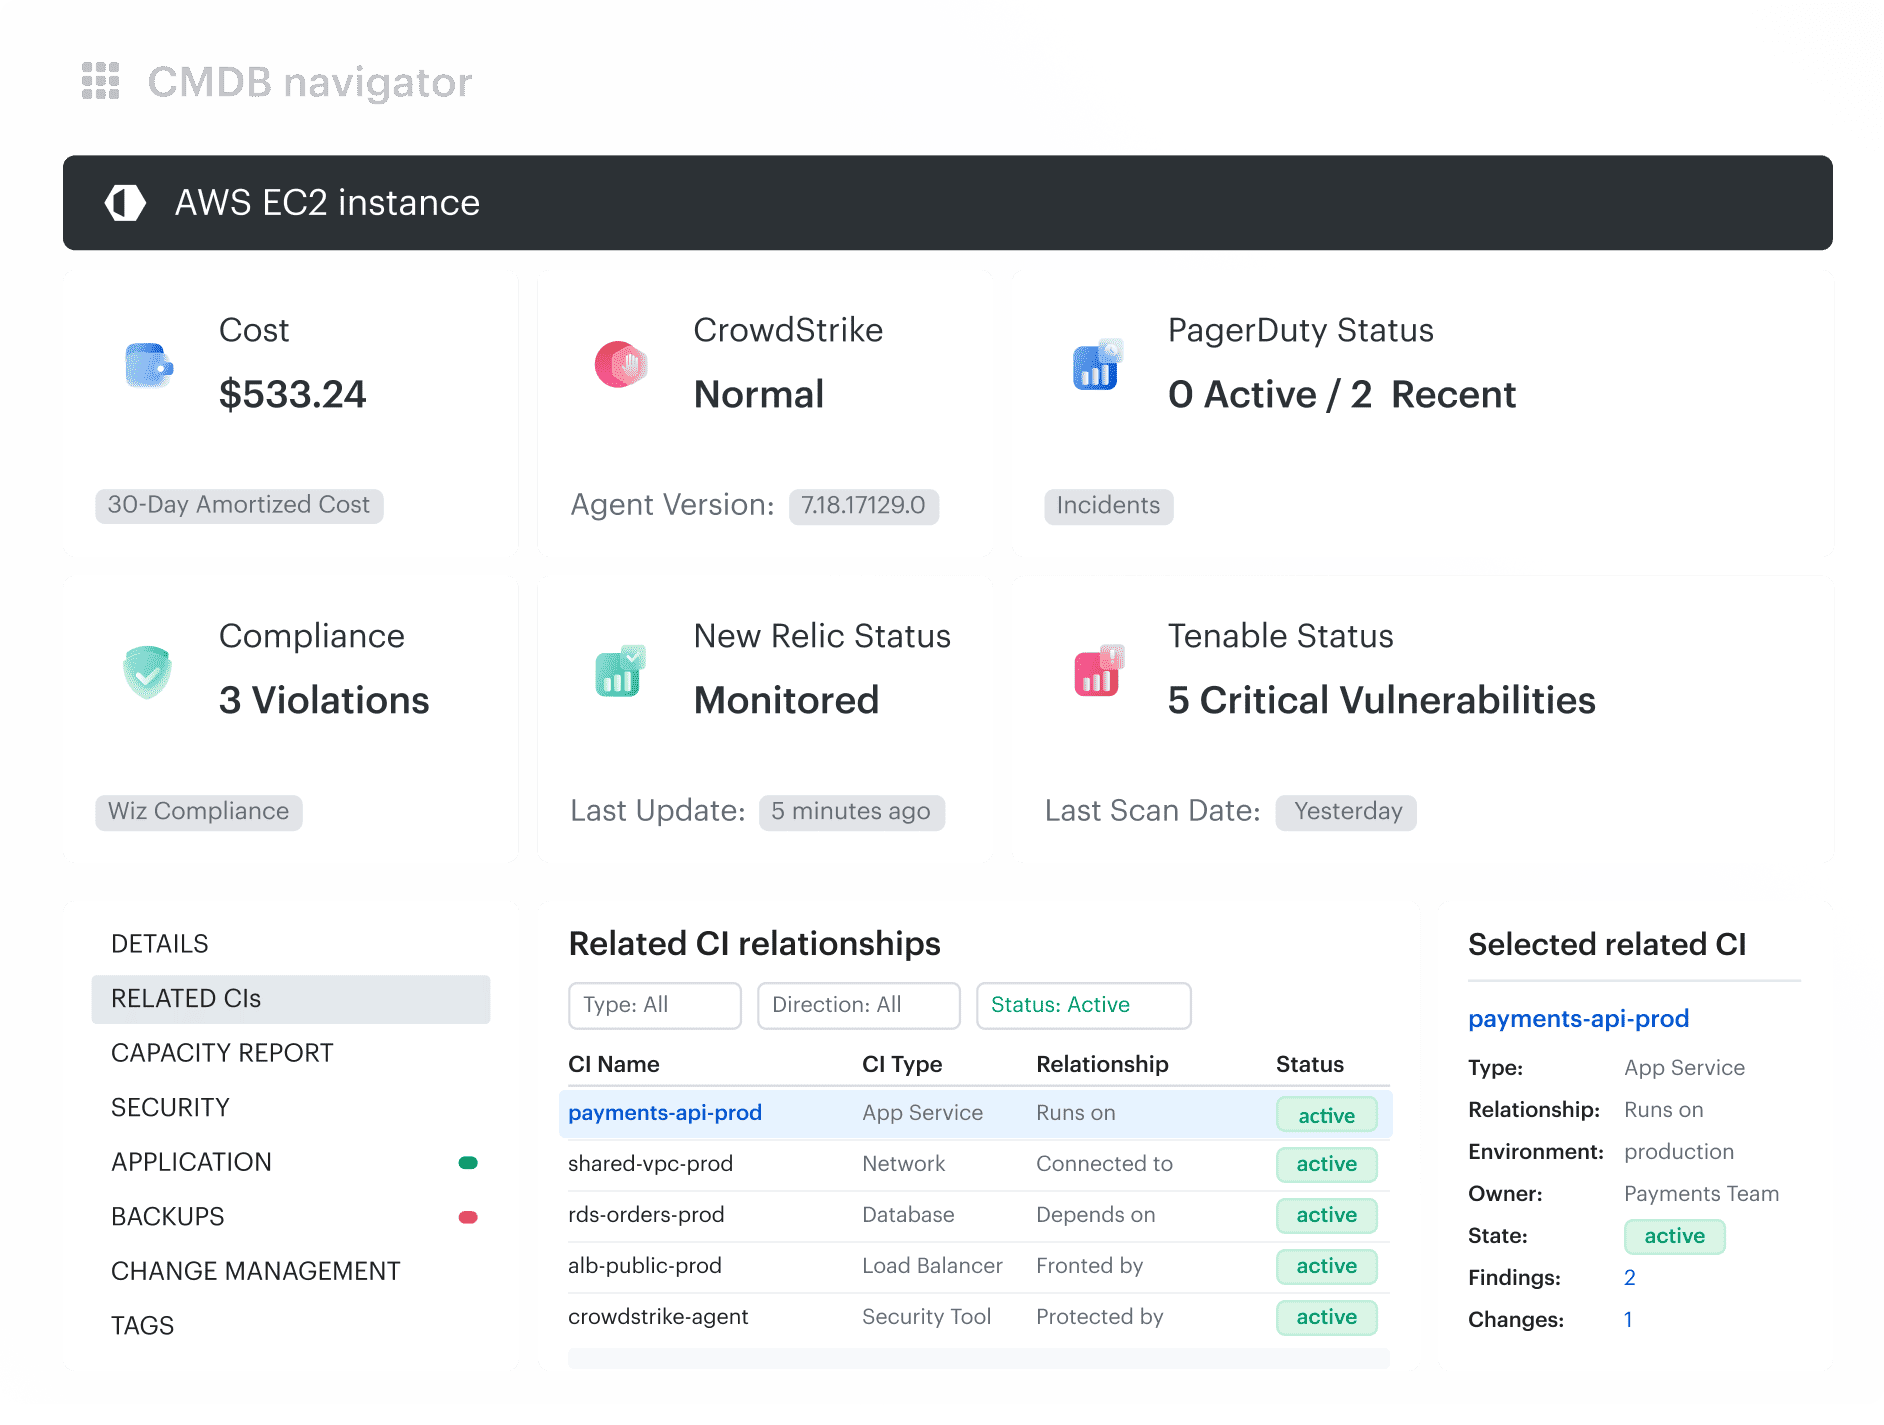 Cloudaware CMDB Navigator showing an AWS EC2 instance with related services, owners, dependencies, monitoring, incidents, compliance, vulnerabilities, and cost.
The dashboard should distinguish duplicate identities, unresolved provider IDs, stale owners, and missing application mappings as separate failure classes
Investigation and ownership flow
This view isolates the delay between signal creation and accepted ownership. Measure median and p95:
- Time-to-context
- Time-to-owner
- Queue age
Add ownerless-alert rate, reassignment rate, first-assignment acceptance, and the number of consoles consulted before a decision.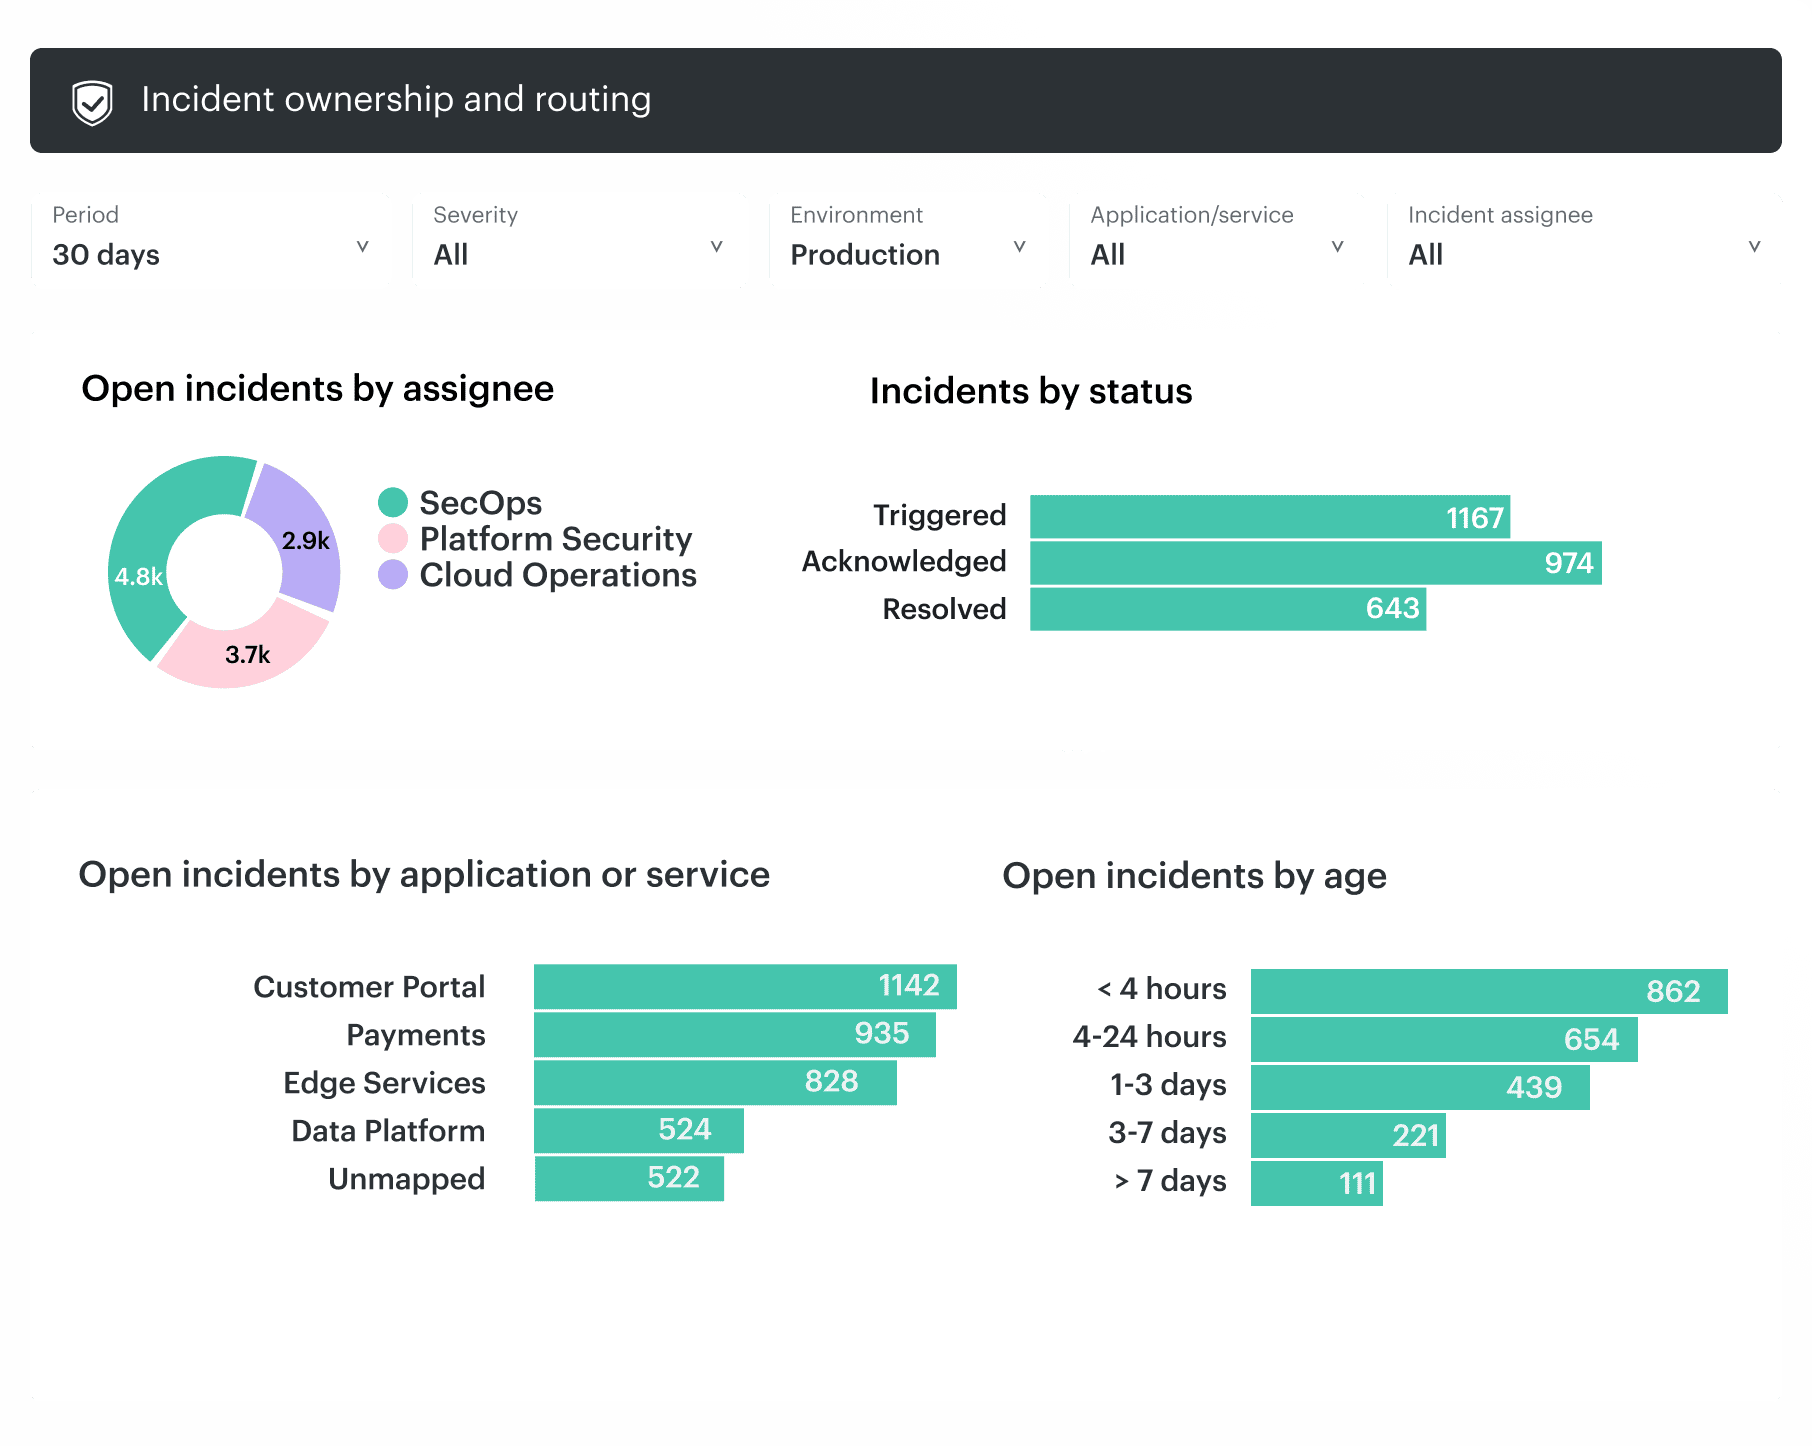 Cloudaware UI dashboard showing open incidents by assignee, workflow status, application or service, and age.
MTTD and MTTR remain useful, but they are too coarse to show whether time was lost during detection, enrichment, assignment, remediation, or validation. A high reassignment rate often indicates weak ownership data or service mapping rather than slow analysts.
Closure and evidence quality
This view tests whether completed workflows represent observed security outcomes. Track:
- Cases with machine-observed validation
- Cases closed through accepted exceptions
- Exceptions approaching or past expiry
- Implementation-to-validation time
- Recurring conditions
- Reopened cases
- Administrative closures without an observed state change
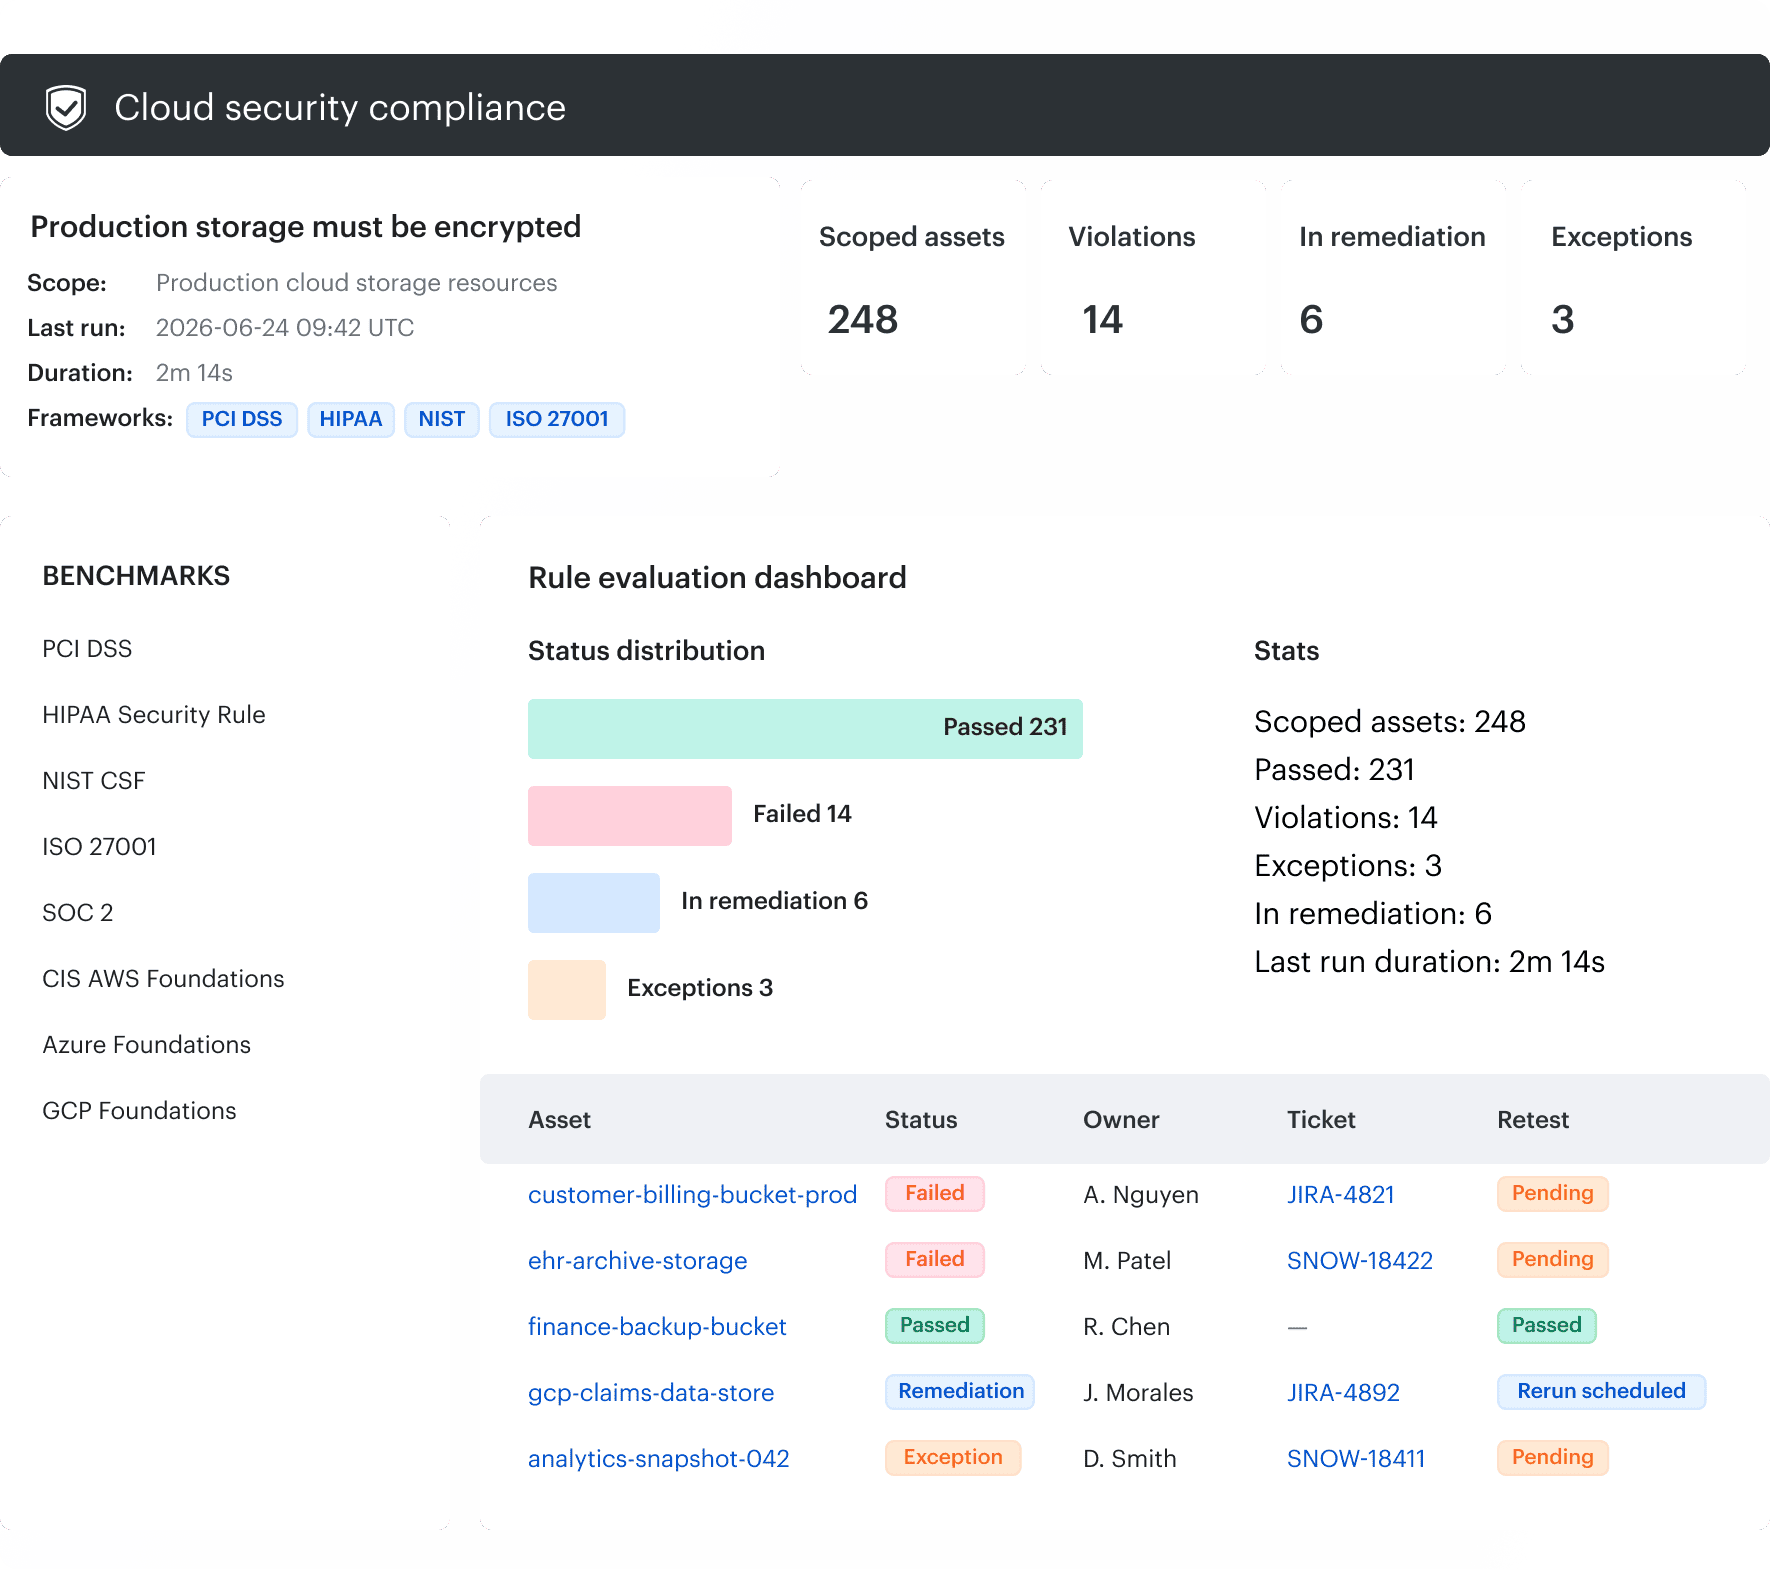 Cloudaware UI dashboard showing policy evaluation results, remediation status, exceptions, assigned owners, tickets, and retest status.
A high closure rate can represent efficient remediation, aggressive administrative closure, disappearing assets, or accepted risk. Separate those outcomes. If a resource was deleted, record deletion as the observed result rather than claiming the original condition was remediated.
What an observable investigation looks like
Consider an illustrative case in which a security service reports that a production storage resource or workload endpoint became publicly reachable.
Observability does not replace analyst judgment. It removes the manual work required to establish basic scope and makes the conclusion traceable.
Resolve the signal to the affected resource
First, resolve the provider-specific identifier to a stable CI. Confirm the account, subscription, or project, region, environment, application, service criticality, and signal timestamp.
Check when the source last evaluated the resource and whether another monitoring, posture, vulnerability, or runtime source observes the same condition. A severe finding tied to a development sandbox requires a different response from the same condition on an internet-facing service processing regulated data.
In healthcare environments, align the response with healthcare data security best practices, applicable healthcare data security standards, and the requirements used to evaluate healthcare data security software.
Reconstruct the change and blast radius
Place the signal beside recent configuration, identity, and deployment changes.
AWS CloudTrail and Config, Azure Activity Log and Resource Graph Change Analysis, and GCP Audit Logs and Cloud Asset Inventory can contribute the actor, timestamp, changed property, and before-and-after state. Temporal proximity creates a lead. The analyst must confirm that the changed property produced the exposure and exclude concurrent changes.
Traverse relationships to identify connected load balancers, security groups, workloads, storage, identities, and dependent services. This determines whether the condition affects one resource or a broader service path.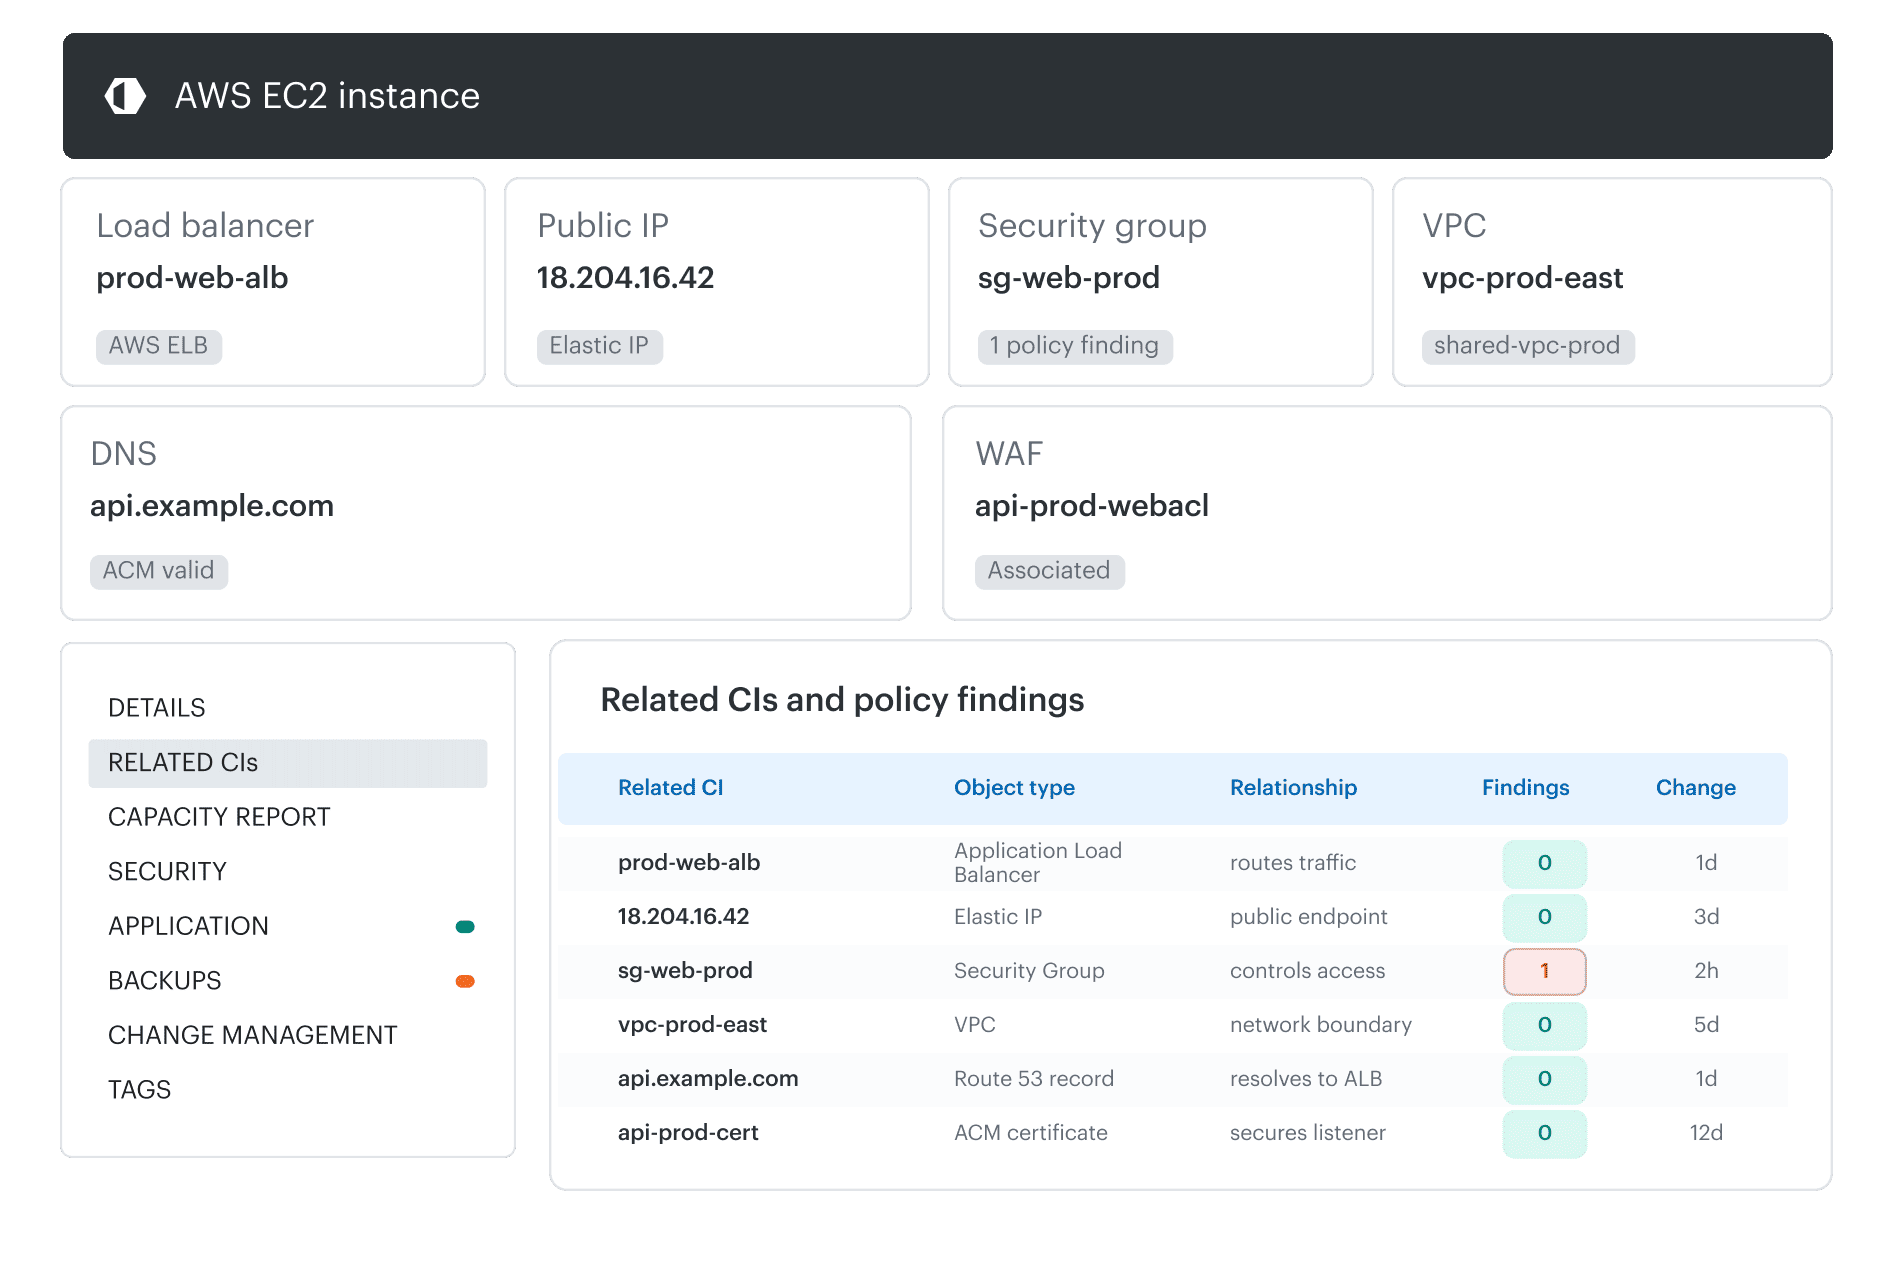 Cloudaware CMDB Navigator view showing an AWS EC2 instance’s network relationships, policy findings, and recent changes across related CIs.
Stable identity matters because display names can be reused, while ephemeral resources may disappear before the investigation begins.
Route action and retain proof
Route the case with the CI, service, observed exposure, changed property, source timestamps, owner, and expected action intact. Record any approved exception with an approver, scope, rationale, compensating control, and expiration date.
After remediation, re-evaluate the resource and retain the before-and-after state, assignment history, implementation timestamp, validation method, and ticket link.
The final record should distinguish four outcomes:
| Outcome | Required evidence |
|---|---|
| Remediated and verified | The relevant control confirms that the condition no longer exists |
| Resource deleted | Deletion evidence and confirmation that the risk was not transferred elsewhere |
| Accepted exception | Approver, rationale, scope, expiration date, and compensating controls |
| Administrative closure | Workflow completion without a demonstrated change in production state |
Only the first three explain what happened to the risk.
A practical implementation sequence
Build security observability in dependency order. Starting with enterprise-wide automation before scope, identity, and ownership are reliable tends to scale misrouting and false assurance.
Phase 1: Define scope and minimum evidence
Select one critical application or business service. Identify the cloud and hybrid resources supporting it, then define:
- Required signal classes
- Freshness thresholds
- Owner fields
- Dependency context
- Closure evidence
Use the cloud security architecture review checklist to define the evidence expected from the service. For provider-specific readiness, follow the AWS cloud security assessment and Google Cloud security assessment guides.
Define the decision each signal must support before expanding collection. Metrics support trend and threshold analysis, logs preserve event detail, and traces expose request paths. Retaining the same high-volume fact in every signal type increases ingestion, storage, and engineering costs without necessarily improving the investigation.
Phase 2: Normalize identity and context
Reconcile provider identifiers and tool-specific records to stable CIs. Connect resources to accounts, environments, applications, owners, criticality, and dependencies.
Measure unresolved assets, duplicate identities, missing owners, and conflicting ownership sources. Tags provide useful evidence, but reconcile them with CMDB relationships, account ownership, application records, deployment metadata, and workflow history.
Exit when critical signals reliably resolve to the correct service and accountable team.
Phase 3: Connect change, action, and validation
Add configuration and deployment history to the investigation timeline. Route enriched cases into established Jira, ServiceNow, or incident workflows without dropping the CI and service context.
Re-evaluate production state after action. Track exceptions, reopens, recurring conditions, and evidence completeness.
The implementation has five exit criteria:
- Expected signals are present and fresh.
- Critical events have service and owner context.
- Analysts can reconstruct the relevant change window.
- Cases reach an accountable team without repeated reassignment.
- Closed cases contain observed validation or an explicit exception outcome.
Fix the earliest unmet criterion before adding more downstream automation.
Add operational context to security observability with Cloudaware
Cloudaware supports the context-to-action chain through a shared configuration model. The relevant product story is the investigation path rather than a list of disconnected modules.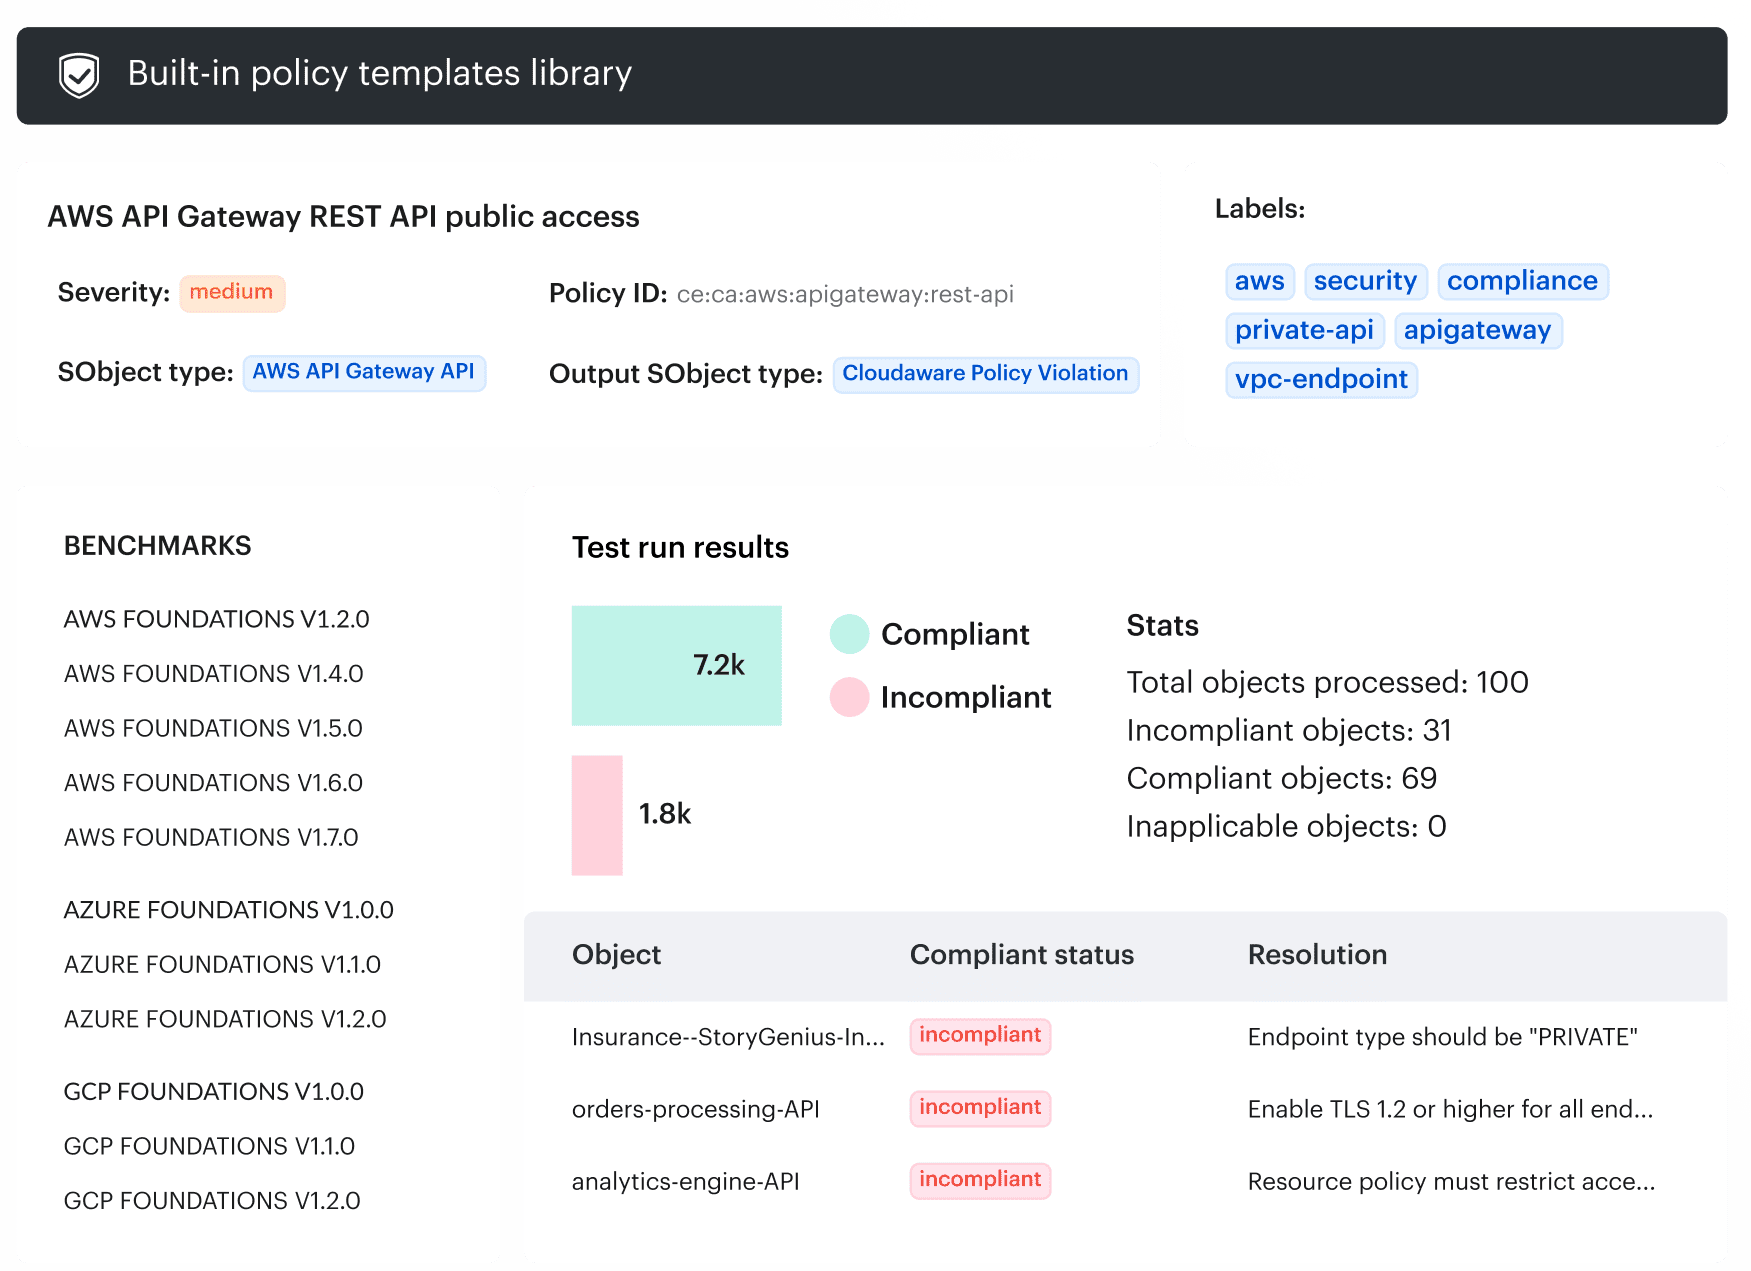 Cloudaware CMDB Navigator dashboard showing cloud inventory and resource trends across connected cloud environments.
- CMDB-backed inventory: Track configuration items across AWS, Microsoft Azure, Google Cloud, Kubernetes, VMware, on-premises infrastructure, and supported third-party systems in one relationship-aware inventory.
- Asset and service relationships: Map dependencies between infrastructure resources, applications, business services, environments, and owners to assess the operational context and potential blast radius of a security signal.
- Cross-tool enrichment: Enrich CI records with findings, vulnerabilities, endpoint signals, monitoring status, incidents, and other operational data collected from supported security and observability integrations.
- Coverage gap reporting: Query CMDB data to identify assets missing expected monitoring, vulnerability scanning, patching, backup, or other operational coverage within a defined scope.
- Policy evaluation: Evaluate infrastructure resources against Cloudaware policies using CMDB configuration, tags, ownership, and relationship data. The documented Compliance Engine v1 library includes 550+ checks covering security, reliability, performance efficiency, and cloud spending.
- Incident and remediation workflows: Link CMDB assets with PagerDuty incidents and Jira issues, or exchange asset, finding, incident, and change context with ServiceNow, so teams can route security work with the affected CI and its current operational context attached.